Slovenia Ball Point Pens Market (2026-2032) | Outlook, Analysis, Segmentation, Value, Trends, Size, Share, Revenue, Industry, Companies, Growth & Forecast
Market Forecast By Product Type (Office Paper Products, Desk Supplies, Mailing Supplies, Computer/printer Supplies, Filing Supplies, Binding Supplies, Time-tracking Supplies), By Distribution Channel (Offline, Online) And Competitive Landscape
| Product Code: ETC5092671 | Publication Date: Nov 2023 | Updated Date: Apr 2026 | Product Type: Market Research Report | |
| Publisher: 6Wresearch | Author: Shubham Padhi | No. of Pages: 60 | No. of Figures: 30 | No. of Tables: 5 |
Slovenia Ball Point Pens Market Size (2020-2030)
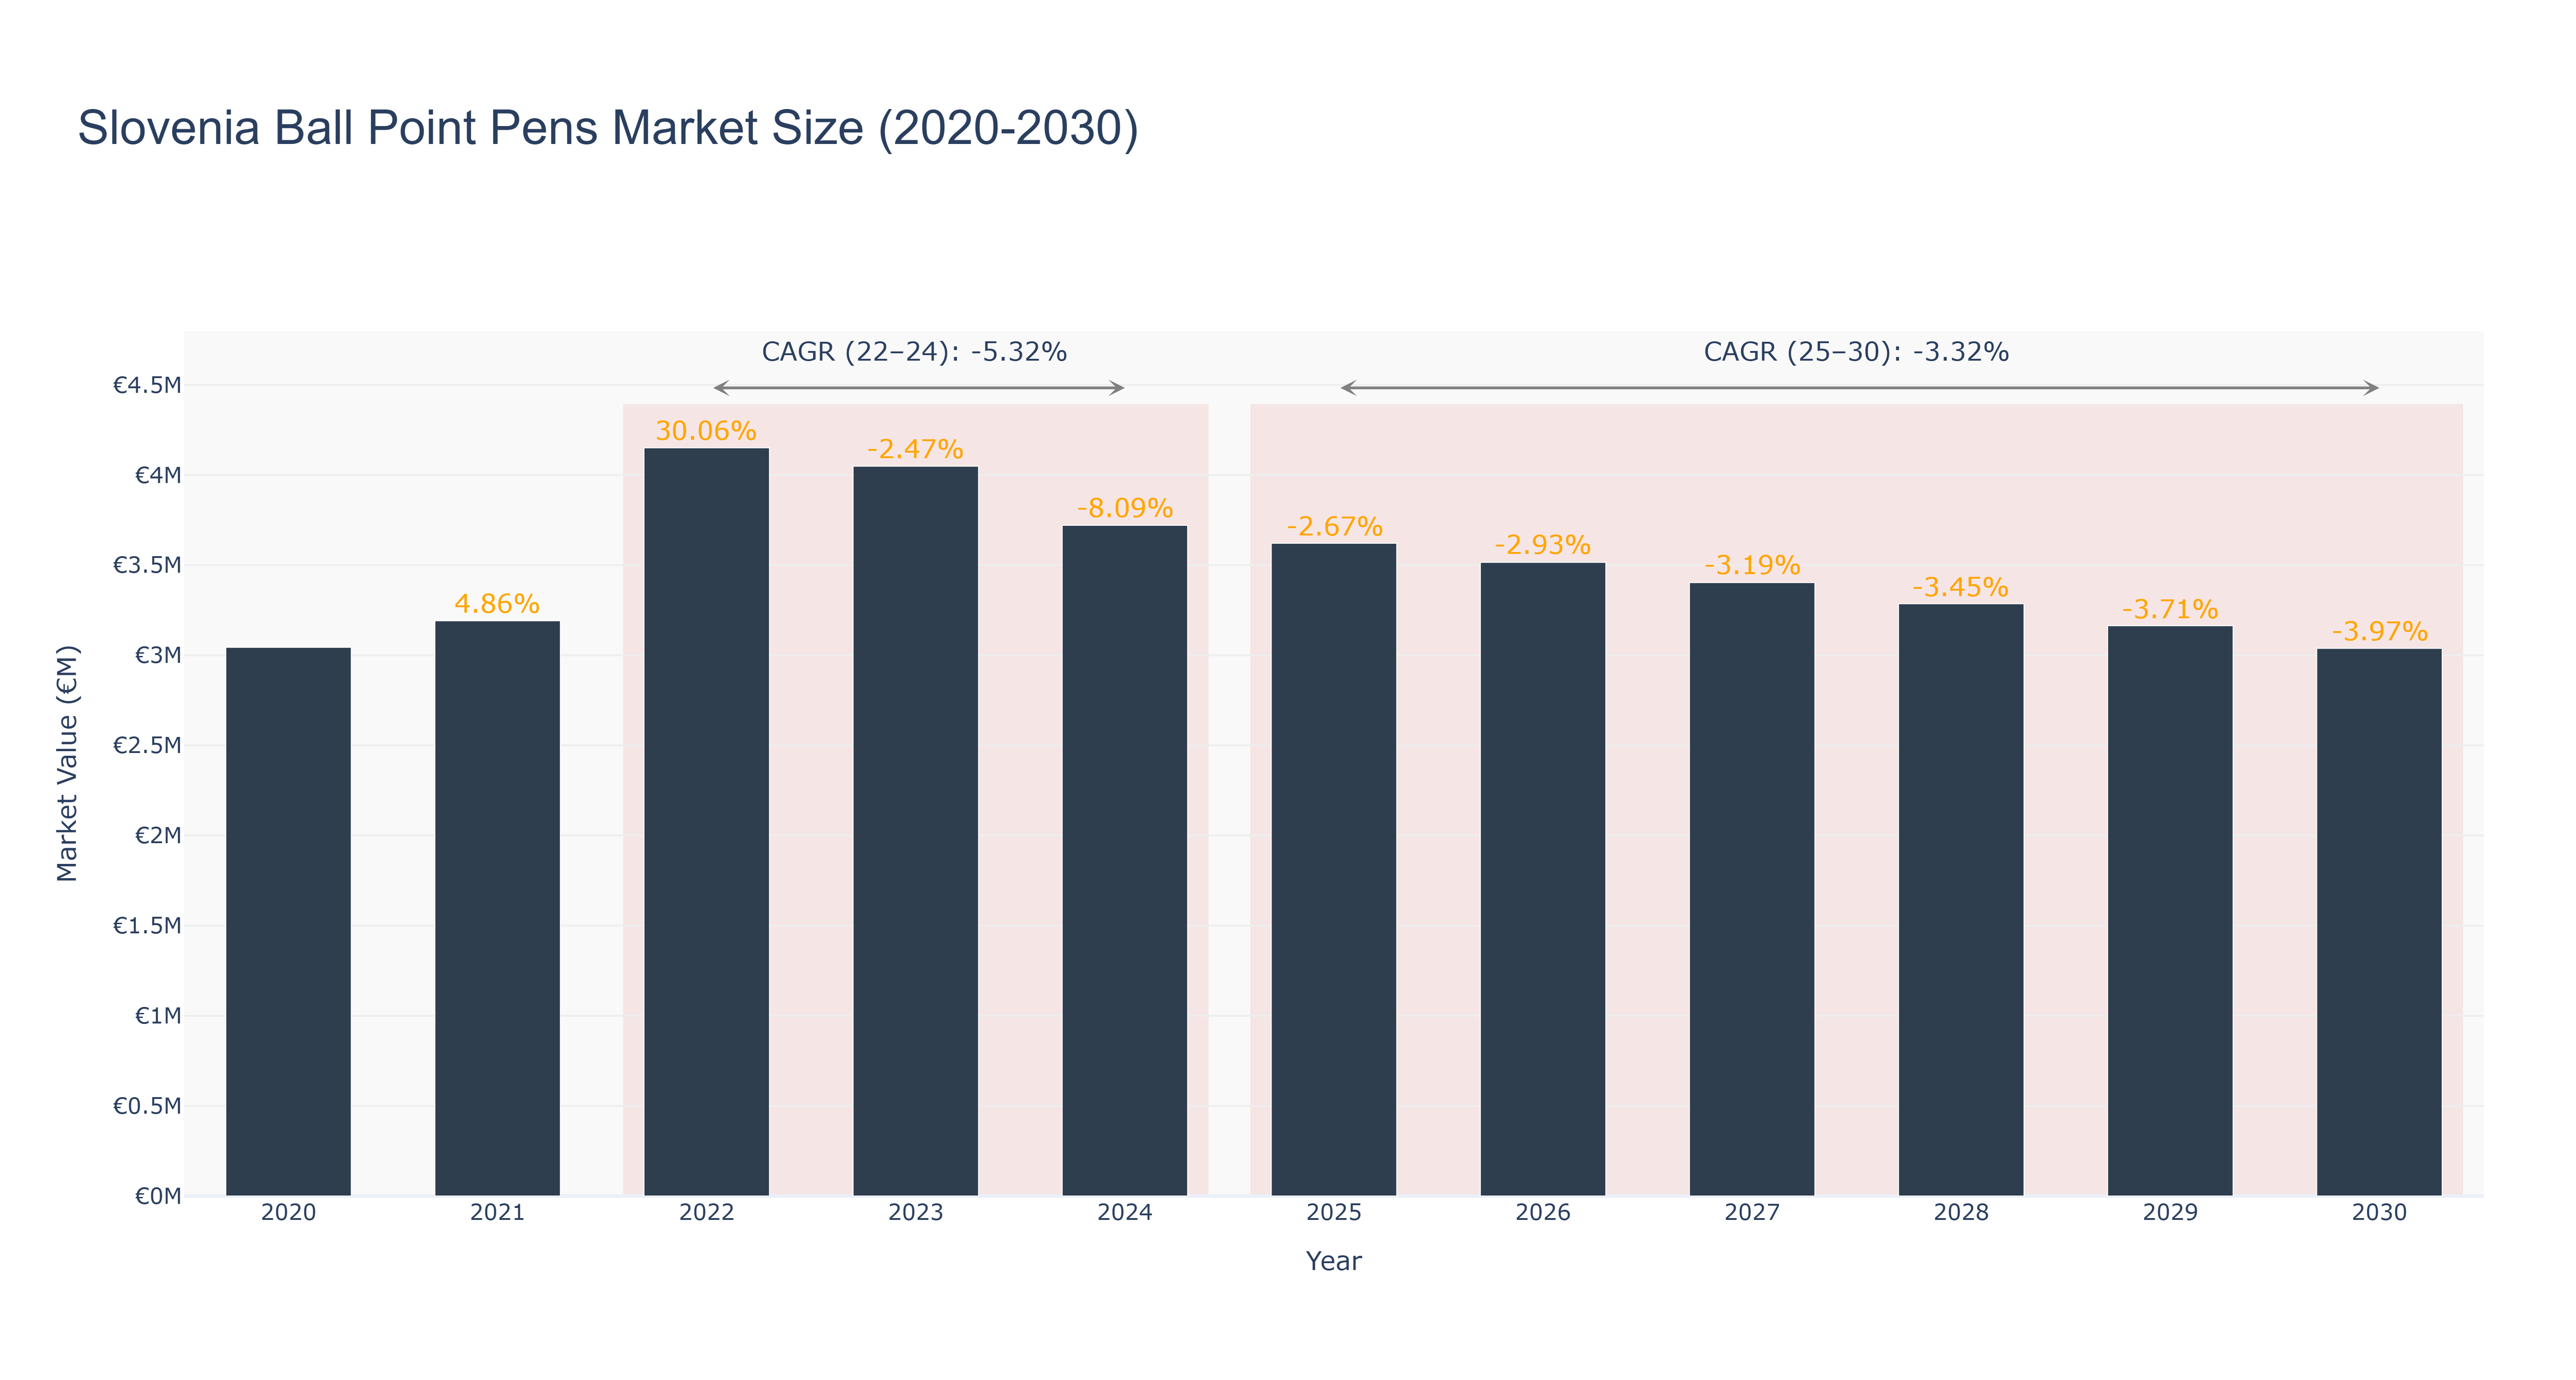
Slovenia's Ball Point Pens Market experienced a peak size of €4.15 million in 2022, followed by a decline to €3.04 million in 2030. The actual market size decreased steadily from 2020 to 2024, with a notable drop in 2024. The forecasted trend from 2025 to 2030 shows a gradual decline in market size. The CAGR for the periods 2022-24 and 2025-30 are -5.32% and -3.32%, respectively. The market's downturn can be attributed to changing consumer preferences towards digital alternatives and reduced office supplies demand due to remote working trends. Looking ahead, Slovenia is set to introduce sustainable packaging initiatives in the stationery sector to align with environmental regulations, which may drive market growth in the future. Industry drivers for the Slovenia Ball Point Pens Market include technological advancements in pen manufacturing, evolving design preferences, and increasing focus on eco-friendly products.
Slovenia Ball Point Pens Market: Production & Trade Performance (2019-2025)
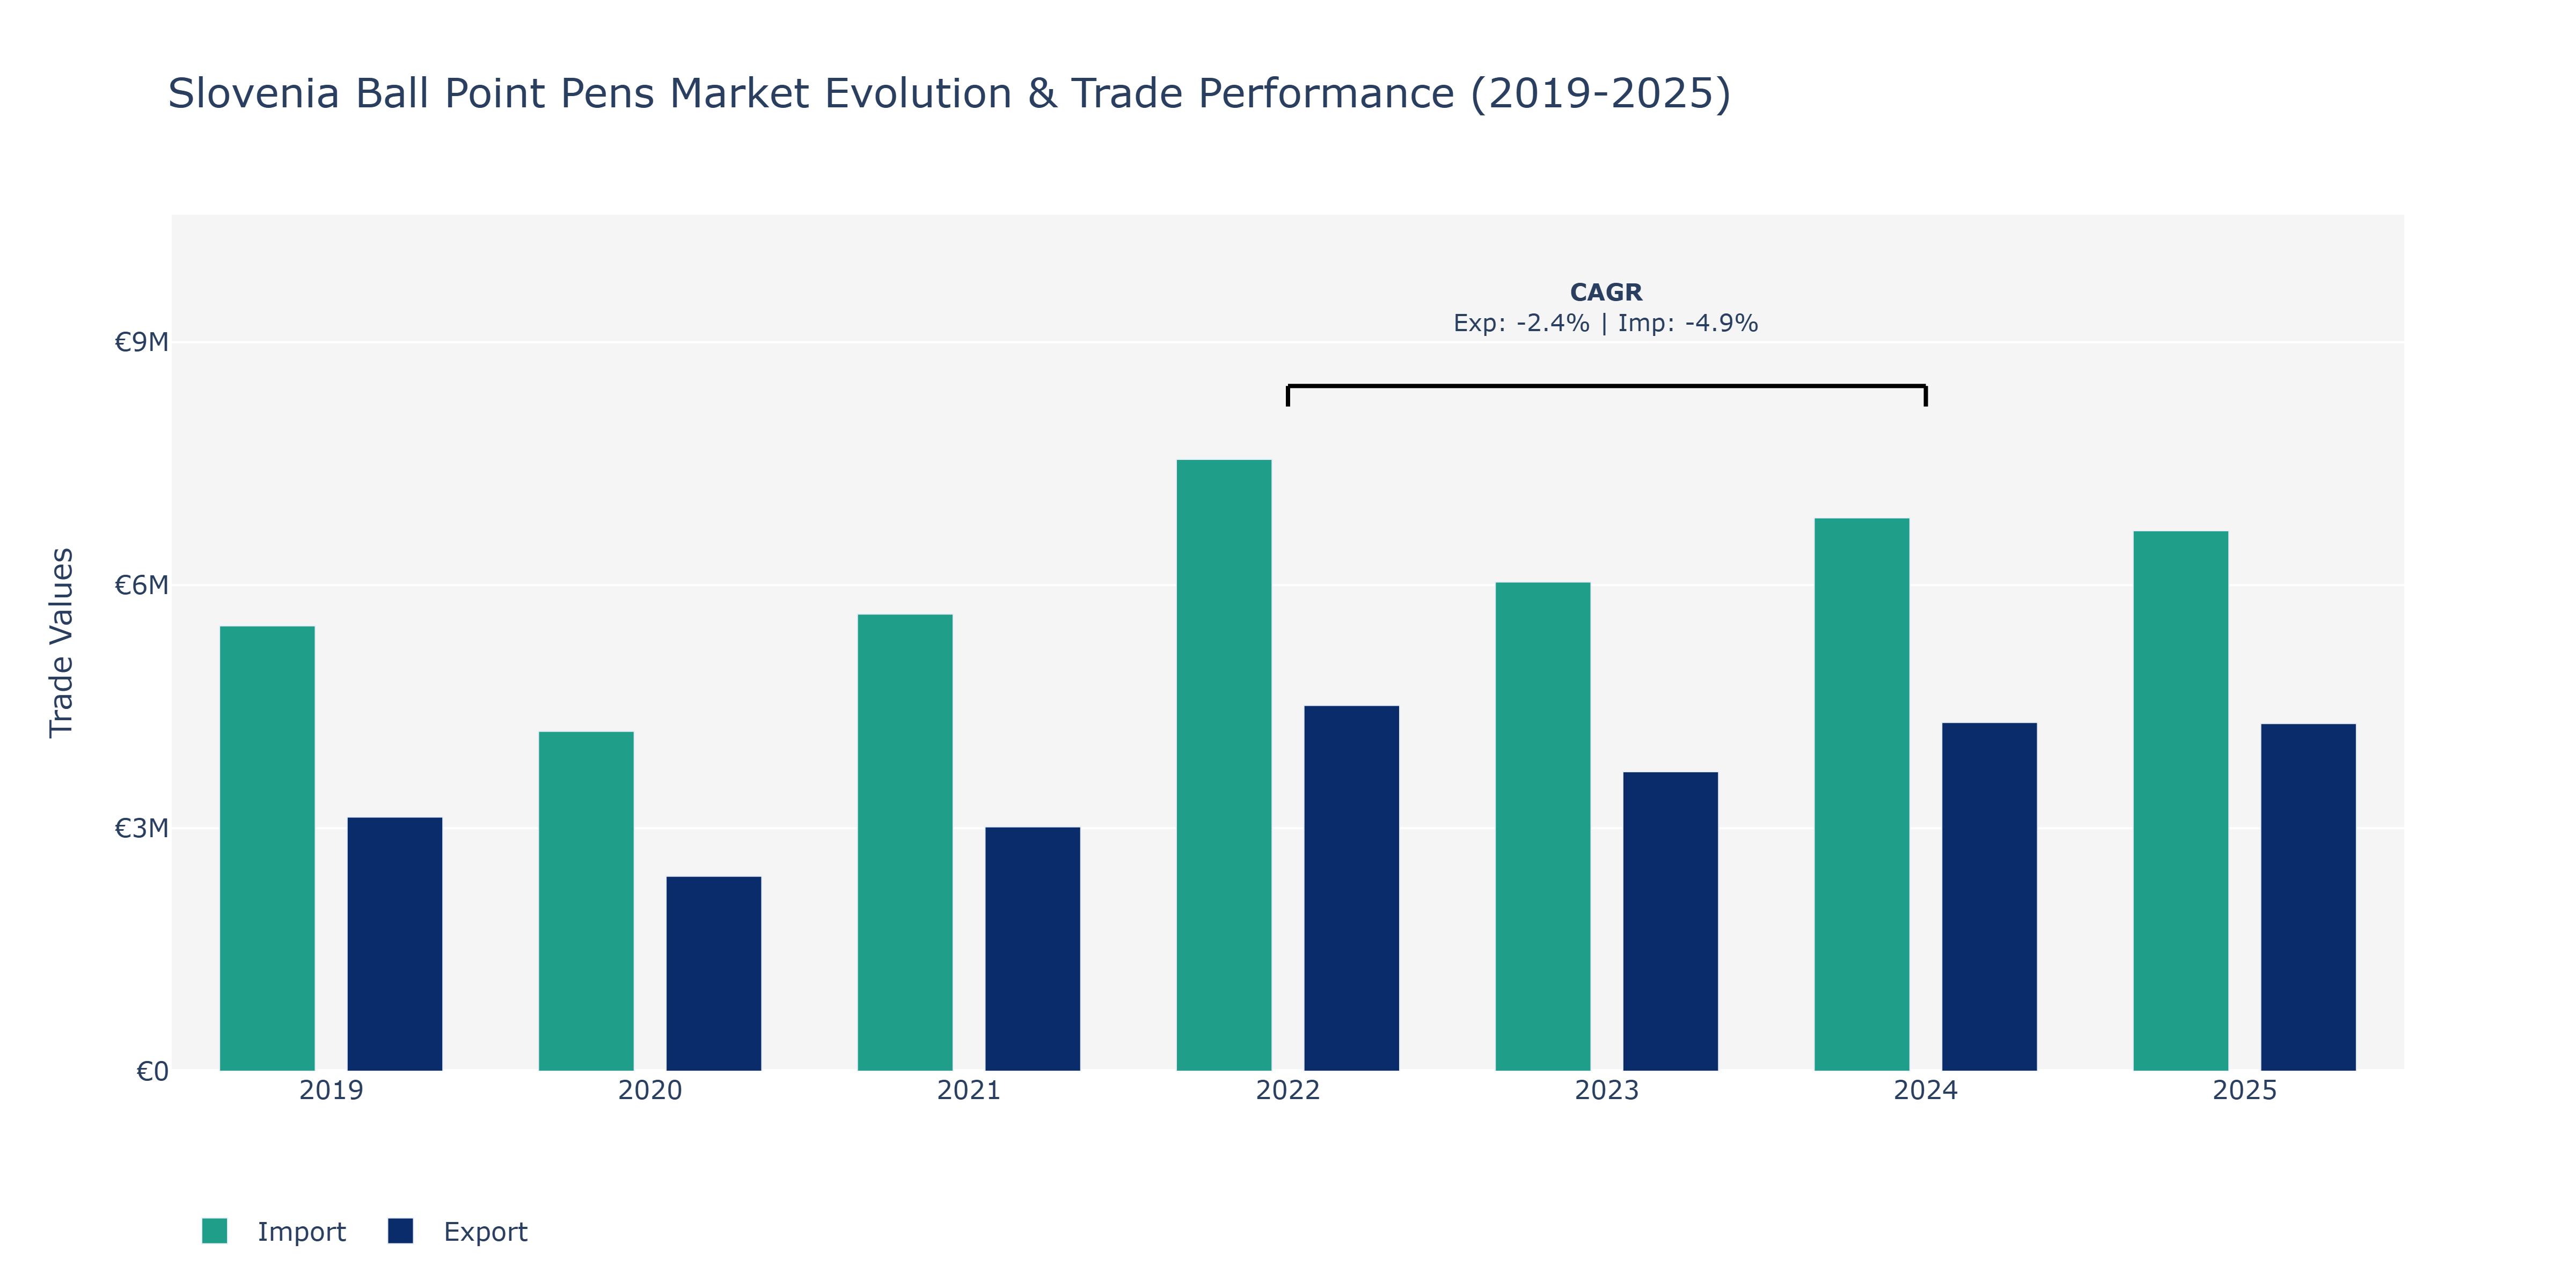
Between 2019 and 2025, Slovenia's Ball Point Pens market witnessed varying trends in Exports and Imports. Exports peaked in 2022 at €4.52 million and then experienced a slight decrease in the following years, settling at around €4.29 million in 2025. Conversely, Imports displayed a similar pattern, reaching a peak of €7.55 million in 2022 and stabilizing around €6.67 million in 2025. These fluctuations can be attributed to several factors such as changes in global demand for stationery products, currency exchange rates impacting trade competitiveness, and evolving supply chain dynamics. The decline in both Exports and Imports in the later years could be influenced by market saturation, increased competition from other countries, and shifts in consumer preferences towards digital alternatives. To maintain a competitive edge, stakeholders in the Slovenian Ball Point Pens market may need to focus on innovation, diversification of product offerings, and strategic partnerships to navigate the evolving market landscape.
Key Highlights of the Report:
- Slovenia Ball Point Pens Market Outlook
- Market Size of Slovenia Ball Point Pens Market, 2025
- Forecast of Slovenia Ball Point Pens Market, 2032
- Historical Data and Forecast of Slovenia Ball Point Pens Revenues & Volume for the Period 2022-2032F
- Slovenia Ball Point Pens Market Trend Evolution
- Slovenia Ball Point Pens Market Drivers and Challenges
- Slovenia Ball Point Pens Price Trends
- Slovenia Ball Point Pens Porter`s Five Forces
- Slovenia Ball Point Pens Industry Life Cycle
- Historical Data and Forecast of Slovenia Ball Point Pens Market Revenues & Volume By Product Type for the Period 2022-2032F
- Historical Data and Forecast of Slovenia Ball Point Pens Market Revenues & Volume By Office Paper Products for the Period 2022-2032F
- Historical Data and Forecast of Slovenia Ball Point Pens Market Revenues & Volume By Desk Supplies for the Period 2022-2032F
- Historical Data and Forecast of Slovenia Ball Point Pens Market Revenues & Volume By Mailing Supplies for the Period 2022-2032F
- Historical Data and Forecast of Slovenia Ball Point Pens Market Revenues & Volume By Computer/printer Supplies for the Period 2022-2032F
- Historical Data and Forecast of Slovenia Ball Point Pens Market Revenues & Volume By Filing Supplies for the Period 2022-2032F
- Historical Data and Forecast of Slovenia Ball Point Pens Market Revenues & Volume By Binding Supplies for the Period 2022-2032F
- Historical Data and Forecast of Slovenia Ball Point Pens Market Revenues & Volume By Time-tracking Supplies for the Period 2022-2032F
- Historical Data and Forecast of Slovenia Ball Point Pens Market Revenues & Volume By Distribution Channel for the Period 2022-2032F
- Historical Data and Forecast of Slovenia Ball Point Pens Market Revenues & Volume By Offline for the Period 2022-2032F
- Historical Data and Forecast of Slovenia Ball Point Pens Market Revenues & Volume By Online for the Period 2022-2032F
- Slovenia Ball Point Pens Import Export Trade Statistics
- Market Opportunity Assessment By Product Type
- Market Opportunity Assessment By Distribution Channel
- Slovenia Ball Point Pens Top Companies Market Share
- Slovenia Ball Point Pens Competitive Benchmarking By Technical and Operational Parameters
- Slovenia Ball Point Pens Company Profiles
- Slovenia Ball Point Pens Key Strategic Recommendations
Frequently Asked Questions About the Market Study (FAQs):
6Wresearch actively monitors the Slovenia Ball Point Pens Market and publishes its comprehensive annual report, highlighting emerging trends, growth drivers, revenue analysis, and forecast outlook. Our insights help businesses to make data-backed strategic decisions with ongoing market dynamics. Our analysts track relevent industries related to the Slovenia Ball Point Pens Market, allowing our clients with actionable intelligence and reliable forecasts tailored to emerging regional needs.
Yes, we provide customisation as per your requirements. To learn more, feel free to contact us on sales@6wresearch.com
1 Executive Summary |
2 Introduction |
2.1 Key Highlights of the Report |
2.2 Report Description |
2.3 Market Scope & Segmentation |
2.4 Research Methodology |
2.5 Assumptions |
3 Slovenia Ball Point Pens Market Overview |
3.1 Slovenia Country Macro Economic Indicators |
3.2 Slovenia Ball Point Pens Market Revenues & Volume, 2022 & 2032F |
3.3 Slovenia Ball Point Pens Market - Industry Life Cycle |
3.4 Slovenia Ball Point Pens Market - Porter's Five Forces |
3.5 Slovenia Ball Point Pens Market Revenues & Volume Share, By Product Type, 2022 & 2032F |
3.6 Slovenia Ball Point Pens Market Revenues & Volume Share, By Distribution Channel, 2022 & 2032F |
4 Slovenia Ball Point Pens Market Dynamics |
4.1 Impact Analysis |
4.2 Market Drivers |
4.2.1 Growing demand for writing instruments in schools and offices |
4.2.2 Increasing focus on eco-friendly and sustainable products |
4.2.3 Innovation in pen design and features to attract consumers |
4.3 Market Restraints |
4.3.1 Intense competition from other writing instruments like gel pens and markers |
4.3.2 Fluctuating raw material prices affecting production costs |
4.3.3 Economic uncertainty impacting consumer spending on non-essential items |
5 Slovenia Ball Point Pens Market Trends |
6 Slovenia Ball Point Pens Market Segmentations |
6.1 Slovenia Ball Point Pens Market, By Product Type |
6.1.1 Overview and Analysis |
6.1.2 Slovenia Ball Point Pens Market Revenues & Volume, By Office Paper Products, 2022-2032F |
6.1.3 Slovenia Ball Point Pens Market Revenues & Volume, By Desk Supplies, 2022-2032F |
6.1.4 Slovenia Ball Point Pens Market Revenues & Volume, By Mailing Supplies, 2022-2032F |
6.1.5 Slovenia Ball Point Pens Market Revenues & Volume, By Computer/printer Supplies, 2022-2032F |
6.1.6 Slovenia Ball Point Pens Market Revenues & Volume, By Filing Supplies, 2022-2032F |
6.1.7 Slovenia Ball Point Pens Market Revenues & Volume, By Binding Supplies, 2022-2032F |
6.2 Slovenia Ball Point Pens Market, By Distribution Channel |
6.2.1 Overview and Analysis |
6.2.2 Slovenia Ball Point Pens Market Revenues & Volume, By Offline, 2022-2032F |
6.2.3 Slovenia Ball Point Pens Market Revenues & Volume, By Online, 2022-2032F |
7 Slovenia Ball Point Pens Market Import-Export Trade Statistics |
7.1 Slovenia Ball Point Pens Market Export to Major Countries |
7.2 Slovenia Ball Point Pens Market Imports from Major Countries |
8 Slovenia Ball Point Pens Market Key Performance Indicators |
8.1 Number of new product launches in the ball point pens segment |
8.2 Percentage of sales from sustainable or eco-friendly ball point pens |
8.3 Consumer satisfaction and loyalty metrics for ball point pen brands |
9 Slovenia Ball Point Pens Market - Opportunity Assessment |
9.1 Slovenia Ball Point Pens Market Opportunity Assessment, By Product Type, 2022 & 2032F |
9.2 Slovenia Ball Point Pens Market Opportunity Assessment, By Distribution Channel, 2022 & 2032F |
10 Slovenia Ball Point Pens Market - Competitive Landscape |
10.1 Slovenia Ball Point Pens Market Revenue Share, By Companies, 2025 |
10.2 Slovenia Ball Point Pens Market Competitive Benchmarking, By Operating and Technical Parameters |
11 Company Profiles |
12 Recommendations | 13 Disclaimer |
Global Go To Market Strategy - 2030
Export potential enables firms to identify high-growth global markets with greater confidence by combining advanced trade intelligence with a structured quantitative methodology. The framework analyzes emerging demand trends and country-level import patterns while integrating macroeconomic and trade datasets such as GDP and population forecasts, bilateral import–export flows, tariff structures, elasticity differentials between developed and developing economies, geographic distance, and import demand projections. Using weighted trade values from 2020–2024 as the base period to project country-to-country export potential for 2030, these inputs are operationalized through calculated drivers such as gravity model parameters, tariff impact factors, and projected GDP per-capita growth. Through an analysis of hidden potentials, demand hotspots, and market conditions that are most favorable to success, this method enables firms to focus on target countries, maximize returns, and global expansion with data, backed by accuracy.
By factoring in the projected importer demand gap that is currently unmet and could be potential opportunity, it identifies the potential for the Exporter (Country) among 190 countries, against the general trade analysis, which identifies the biggest importer or exporter.
To discover high-growth global markets and optimize your business strategy:
Click Here
Pricing
- Single User License$ 1,995
- Department License$ 2,400
- Site License$ 3,120
- Global License$ 3,795

Leadership Perspectives from Industry Events
Search
Thought Leadership and Analyst Meet


Our Clients
6WResearch In News
- India Export Attractiveness Tracker 2026
- India Air Conditioner Market Set for Strong Rebound in 2026 After Weather-Led Correction and GST-Driven Recovery: 6Wresearch
- ADAS in India: How Automatic Emergency Braking, Blind Spot Detection & Driver Monitoring are Transforming Road Safety
- Doha a strategic location for EV manufacturing hub: IPA Qatar
- Demand for luxury TVs surging in the GCC, says Samsung
- Empowering Growth: The Thriving Journey of Bangladesh’s Cable Industry
Latest Reports
- Nicaragua RPG Gaming Market (2026-2032)
- New Zealand RPG Gaming Market (2026-2032)
- Netherlands RPG Gaming Market (2026-2032)
- Nauru RPG Gaming Market (2026-2032)
- Namibia RPG Gaming Market (2026-2032)
- Mozambique RPG Gaming Market (2026-2032)
- Montenegro RPG Gaming Market (2026-2032)
- Mongolia RPG Gaming Market (2026-2032)
- Monaco RPG Gaming Market (2026-2032)
- Micronesia RPG Gaming Market (2026-2032)
Industry Events and Analyst Meet

EV India Expo 2026

HIMTEX 2026

India Refining Summit 2026

India EV Show 2026

EV tech India Expo 2026
Whitepaper
- Middle East & Africa Commercial Security Market Click here to view more.
- Middle East & Africa Fire Safety Systems & Equipment Market Click here to view more.
- GCC Drone Market Click here to view more.
- Middle East Lighting Fixture Market Click here to view more.
- GCC Physical & Perimeter Security Market Click here to view more.