Slovenia Bio Butadiene Market (2026-2032) | Investment Trends, Value, Consumer Insights, Revenue, Trends, Drivers, Share, Companies, Strategy, Restraints, Segmentation, Pricing Analysis, Supply, Industry, Opportunities, Demand, Analysis, Competitive, Forecast, Growth, Competition, Size, Segments, Strategic Insights, Challenges, Outlook
Market Forecast By Source Type (Biomass-Based, Corn-Based, Sugar-Based), By Application (Synthetic Rubber, Plastics, Adhesives), By End User (Automotive, Construction, Packaging), By Production Method (Catalysis, Biocatalysis, Fermentation), By Environmental Impact (Renewable, Low Carbon Footprint, Biodegradable) And Competitive Landscape
| Product Code: ETC11449956 | Publication Date: Apr 2025 | Updated Date: Apr 2026 | Product Type: Market Research Report | |
| Publisher: 6Wresearch | No. of Pages: 65 | No. of Figures: 34 | No. of Tables: 19 | |
Slovenia Bio Butadiene Market Size (2020-2030)
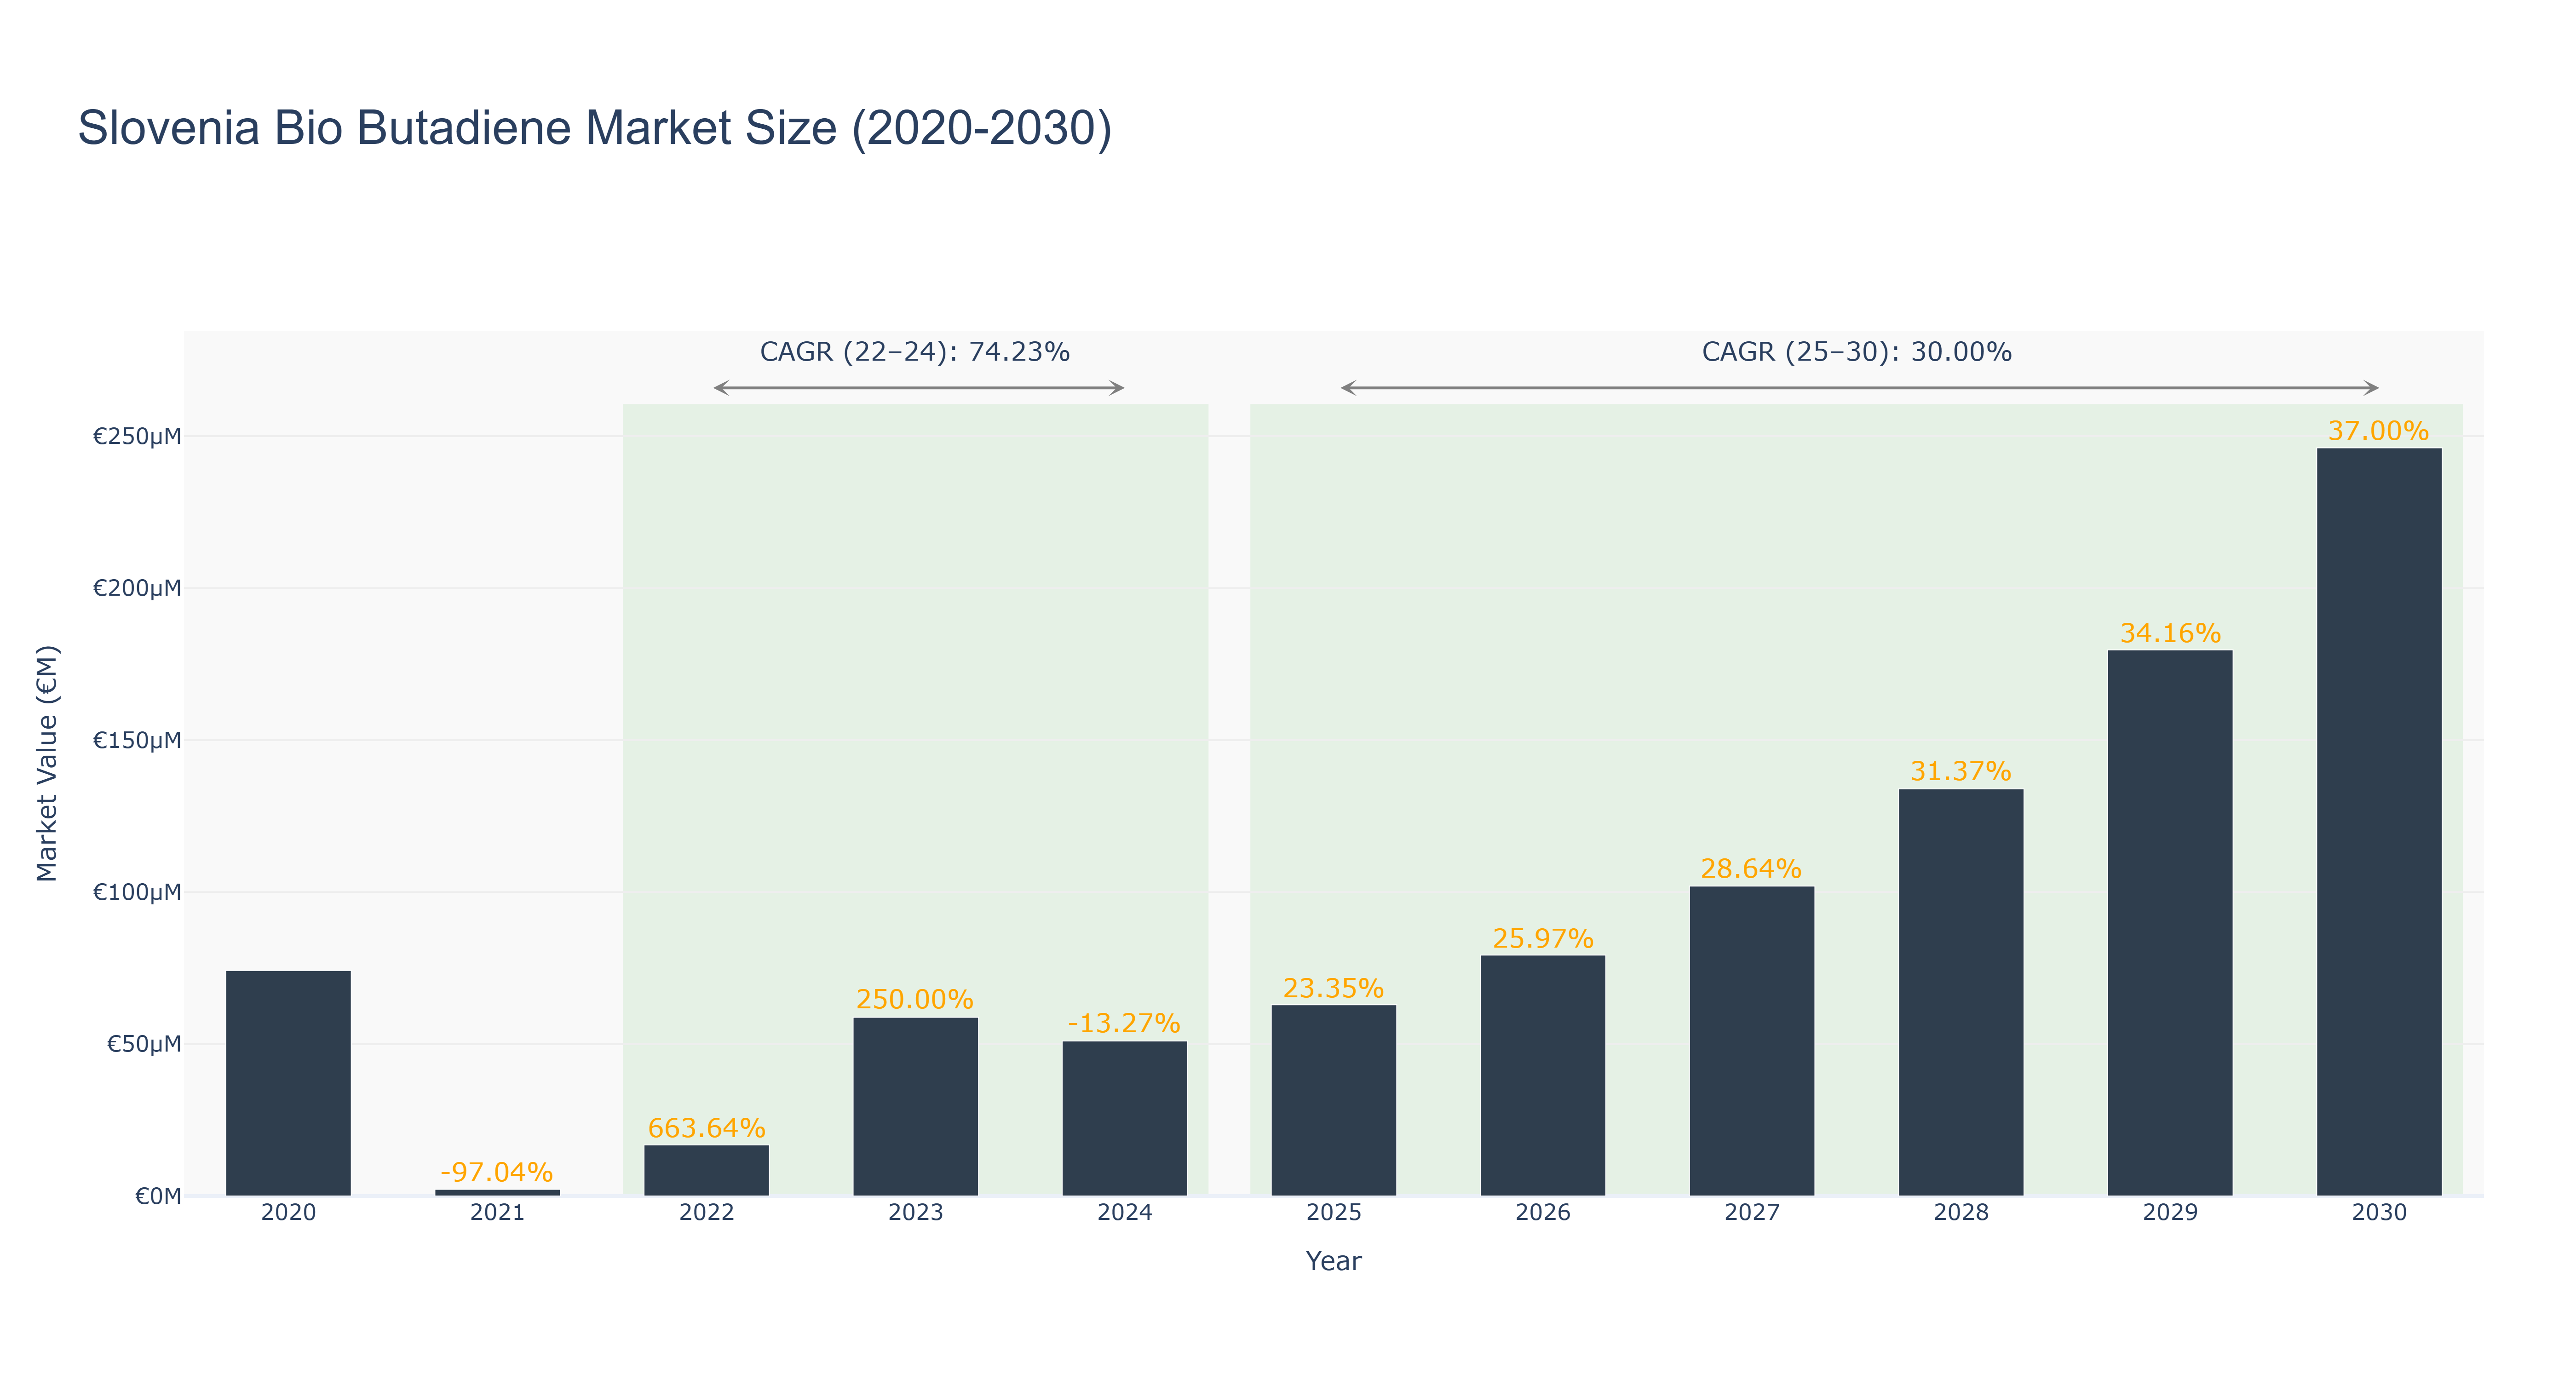
The Slovenia Bio Butadiene Market has demonstrated a volatile yet promising trajectory, marked by significant fluctuations in market size. The market peaked in 2023, reaching €58.80, following a remarkable recovery from €16.80 in 2022, reflecting a staggering growth of 250.00%. The actual market size saw a drastic decline to €2.20 in 2021, but subsequent years have shown a robust CAGR of 74.23% from 2022 to 2024. Looking ahead, the forecasted period from 2025 to 2030 anticipates a more stable growth trajectory, with projected market sizes increasing from €62.91 in 2025 to €246.17 by 2030, representing a CAGR of 30.00%. Key drivers for this growth include increasing environmental regulations and a shift towards sustainable materials. As Slovenia continues to invest in renewable technologies and bio-based products, the bio butadiene sector is poised for expansion, supported by ongoing innovations and government initiatives.
Slovenia Bio Butadiene Market: Production & Trade Performance (2019-2025)
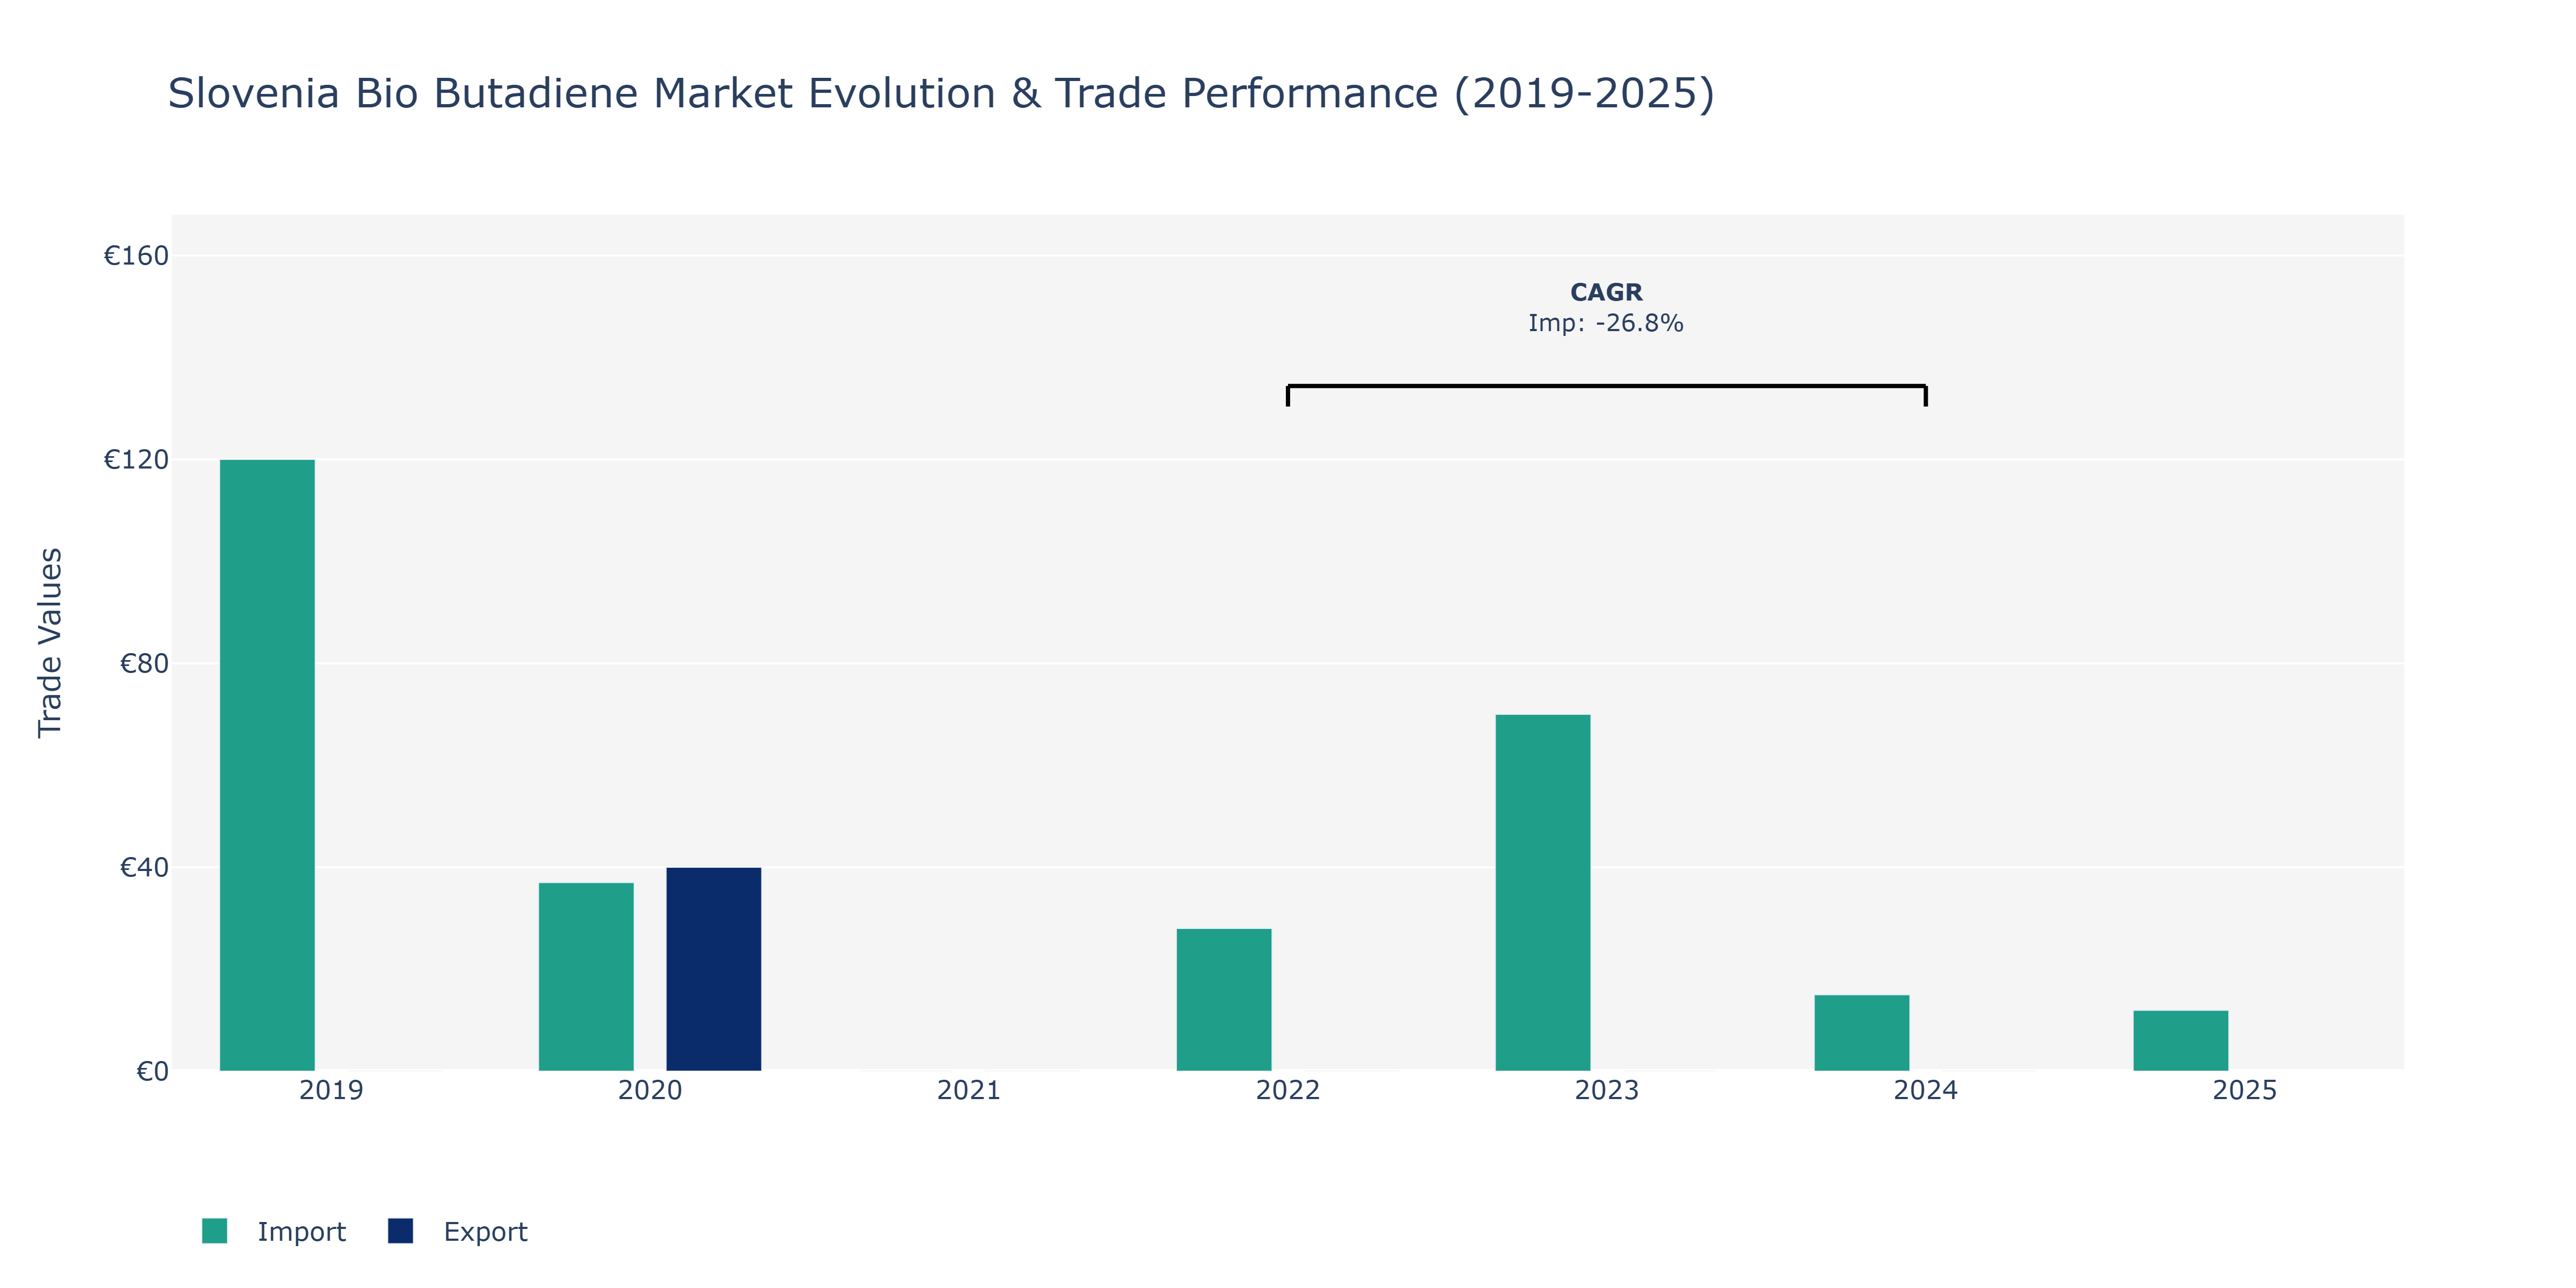
Between 2019 and 2025, Slovenia's Bio Butadiene Market showcased notable fluctuations in imports. In 2019, imports stood at €120.0 million, decreasing significantly in 2020 to €37.0 million. The declining trend continued in 2022, dropping to €28.0 million, with a sharp decline to €15.0 million in 2024. In 2025, imports further decreased to €11.94 million. These fluctuations can be attributed to various factors such as changes in demand, global market conditions, and possibly shifts in sourcing strategies by market players. The decreasing trend in imports indicates potential shifts in supply chains or changes in domestic production capabilities within the bio butadiene market in Slovenia. To sustain market stability and growth, stakeholders may need to explore strategies to enhance domestic production capabilities or diversify sourcing channels to mitigate the impact of such fluctuations in the future.
Key Highlights of the Report:
- Slovenia Bio Butadiene Market Outlook
- Market Size of Slovenia Bio Butadiene Market, 2025
- Forecast of Slovenia Bio Butadiene Market, 2032
- Historical Data and Forecast of Slovenia Bio Butadiene Revenues & Volume for the Period 2022-2032F
- Slovenia Bio Butadiene Market Trend Evolution
- Slovenia Bio Butadiene Market Drivers and Challenges
- Slovenia Bio Butadiene Price Trends
- Slovenia Bio Butadiene Porter's Five Forces
- Slovenia Bio Butadiene Industry Life Cycle
- Historical Data and Forecast of Slovenia Bio Butadiene Market Revenues & Volume By Source Type for the Period 2022-2032F
- Historical Data and Forecast of Slovenia Bio Butadiene Market Revenues & Volume By Biomass-Based for the Period 2022-2032F
- Historical Data and Forecast of Slovenia Bio Butadiene Market Revenues & Volume By Corn-Based for the Period 2022-2032F
- Historical Data and Forecast of Slovenia Bio Butadiene Market Revenues & Volume By Sugar-Based for the Period 2022-2032F
- Historical Data and Forecast of Slovenia Bio Butadiene Market Revenues & Volume By Application for the Period 2022-2032F
- Historical Data and Forecast of Slovenia Bio Butadiene Market Revenues & Volume By Synthetic Rubber for the Period 2022-2032F
- Historical Data and Forecast of Slovenia Bio Butadiene Market Revenues & Volume By Plastics for the Period 2022-2032F
- Historical Data and Forecast of Slovenia Bio Butadiene Market Revenues & Volume By Adhesives for the Period 2022-2032F
- Historical Data and Forecast of Slovenia Bio Butadiene Market Revenues & Volume By End User for the Period 2022-2032F
- Historical Data and Forecast of Slovenia Bio Butadiene Market Revenues & Volume By Automotive for the Period 2022-2032F
- Historical Data and Forecast of Slovenia Bio Butadiene Market Revenues & Volume By Construction for the Period 2022-2032F
- Historical Data and Forecast of Slovenia Bio Butadiene Market Revenues & Volume By Packaging for the Period 2022-2032F
- Historical Data and Forecast of Slovenia Bio Butadiene Market Revenues & Volume By Production Method for the Period 2022-2032F
- Historical Data and Forecast of Slovenia Bio Butadiene Market Revenues & Volume By Catalysis for the Period 2022-2032F
- Historical Data and Forecast of Slovenia Bio Butadiene Market Revenues & Volume By Biocatalysis for the Period 2022-2032F
- Historical Data and Forecast of Slovenia Bio Butadiene Market Revenues & Volume By Fermentation for the Period 2022-2032F
- Historical Data and Forecast of Slovenia Bio Butadiene Market Revenues & Volume By Environmental Impact for the Period 2022-2032F
- Historical Data and Forecast of Slovenia Bio Butadiene Market Revenues & Volume By Renewable for the Period 2022-2032F
- Historical Data and Forecast of Slovenia Bio Butadiene Market Revenues & Volume By Low Carbon Footprint for the Period 2022-2032F
- Historical Data and Forecast of Slovenia Bio Butadiene Market Revenues & Volume By Biodegradable for the Period 2022-2032F
- Slovenia Bio Butadiene Import Export Trade Statistics
- Market Opportunity Assessment By Source Type
- Market Opportunity Assessment By Application
- Market Opportunity Assessment By End User
- Market Opportunity Assessment By Production Method
- Market Opportunity Assessment By Environmental Impact
- Slovenia Bio Butadiene Top Companies Market Share
- Slovenia Bio Butadiene Competitive Benchmarking By Technical and Operational Parameters
- Slovenia Bio Butadiene Company Profiles
- Slovenia Bio Butadiene Key Strategic Recommendations
Frequently Asked Questions About the Market Study (FAQs):
6Wresearch actively monitors the Slovenia Bio Butadiene Market and publishes its comprehensive annual report, highlighting emerging trends, growth drivers, revenue analysis, and forecast outlook. Our insights help businesses to make data-backed strategic decisions with ongoing market dynamics. Our analysts track relevent industries related to the Slovenia Bio Butadiene Market, allowing our clients with actionable intelligence and reliable forecasts tailored to emerging regional needs.
Yes, we provide customisation as per your requirements. To learn more, feel free to contact us on sales@6wresearch.com
1 Executive Summary |
2 Introduction |
2.1 Key Highlights of the Report |
2.2 Report Description |
2.3 Market Scope & Segmentation |
2.4 Research Methodology |
2.5 Assumptions |
3 Slovenia Bio Butadiene Market Overview |
3.1 Slovenia Country Macro Economic Indicators |
3.2 Slovenia Bio Butadiene Market Revenues & Volume, 2022 & 2032F |
3.3 Slovenia Bio Butadiene Market - Industry Life Cycle |
3.4 Slovenia Bio Butadiene Market - Porter's Five Forces |
3.5 Slovenia Bio Butadiene Market Revenues & Volume Share, By Source Type, 2022 & 2032F |
3.6 Slovenia Bio Butadiene Market Revenues & Volume Share, By Application, 2022 & 2032F |
3.7 Slovenia Bio Butadiene Market Revenues & Volume Share, By End User, 2022 & 2032F |
3.8 Slovenia Bio Butadiene Market Revenues & Volume Share, By Production Method, 2022 & 2032F |
3.9 Slovenia Bio Butadiene Market Revenues & Volume Share, By Environmental Impact, 2022 & 2032F |
4 Slovenia Bio Butadiene Market Dynamics |
4.1 Impact Analysis |
4.2 Market Drivers |
4.2.1 Increasing focus on sustainability and environmental concerns driving demand for bio-based products. |
4.2.2 Government regulations promoting the use of bio-based materials in industries. |
4.2.3 Growing awareness among consumers regarding the benefits of bio-based products. |
4.3 Market Restraints |
4.3.1 High production costs associated with bio-based materials. |
4.3.2 Limited availability and scalability of raw materials for bio butadiene production. |
4.3.3 Lack of infrastructure and technology for large-scale bio butadiene production. |
5 Slovenia Bio Butadiene Market Trends |
6 Slovenia Bio Butadiene Market, By Types |
6.1 Slovenia Bio Butadiene Market, By Source Type |
6.1.1 Overview and Analysis |
6.1.2 Slovenia Bio Butadiene Market Revenues & Volume, By Source Type, 2022 - 2032F |
6.1.3 Slovenia Bio Butadiene Market Revenues & Volume, By Biomass-Based, 2022 - 2032F |
6.1.4 Slovenia Bio Butadiene Market Revenues & Volume, By Corn-Based, 2022 - 2032F |
6.1.5 Slovenia Bio Butadiene Market Revenues & Volume, By Sugar-Based, 2022 - 2032F |
6.2 Slovenia Bio Butadiene Market, By Application |
6.2.1 Overview and Analysis |
6.2.2 Slovenia Bio Butadiene Market Revenues & Volume, By Synthetic Rubber, 2022 - 2032F |
6.2.3 Slovenia Bio Butadiene Market Revenues & Volume, By Plastics, 2022 - 2032F |
6.2.4 Slovenia Bio Butadiene Market Revenues & Volume, By Adhesives, 2022 - 2032F |
6.3 Slovenia Bio Butadiene Market, By End User |
6.3.1 Overview and Analysis |
6.3.2 Slovenia Bio Butadiene Market Revenues & Volume, By Automotive, 2022 - 2032F |
6.3.3 Slovenia Bio Butadiene Market Revenues & Volume, By Construction, 2022 - 2032F |
6.3.4 Slovenia Bio Butadiene Market Revenues & Volume, By Packaging, 2022 - 2032F |
6.4 Slovenia Bio Butadiene Market, By Production Method |
6.4.1 Overview and Analysis |
6.4.2 Slovenia Bio Butadiene Market Revenues & Volume, By Catalysis, 2022 - 2032F |
6.4.3 Slovenia Bio Butadiene Market Revenues & Volume, By Biocatalysis, 2022 - 2032F |
6.4.4 Slovenia Bio Butadiene Market Revenues & Volume, By Fermentation, 2022 - 2032F |
6.5 Slovenia Bio Butadiene Market, By Environmental Impact |
6.5.1 Overview and Analysis |
6.5.2 Slovenia Bio Butadiene Market Revenues & Volume, By Renewable, 2022 - 2032F |
6.5.3 Slovenia Bio Butadiene Market Revenues & Volume, By Low Carbon Footprint, 2022 - 2032F |
6.5.4 Slovenia Bio Butadiene Market Revenues & Volume, By Biodegradable, 2022 - 2032F |
7 Slovenia Bio Butadiene Market Import-Export Trade Statistics |
7.1 Slovenia Bio Butadiene Market Export to Major Countries |
7.2 Slovenia Bio Butadiene Market Imports from Major Countries |
8 Slovenia Bio Butadiene Market Key Performance Indicators |
8.1 Percentage of bio butadiene used in various industries compared to traditional butadiene. |
8.2 Investment in research and development for bio butadiene technologies. |
8.3 Number of partnerships and collaborations for bio butadiene production and distribution. |
9 Slovenia Bio Butadiene Market - Opportunity Assessment |
9.1 Slovenia Bio Butadiene Market Opportunity Assessment, By Source Type, 2022 & 2032F |
9.2 Slovenia Bio Butadiene Market Opportunity Assessment, By Application, 2022 & 2032F |
9.3 Slovenia Bio Butadiene Market Opportunity Assessment, By End User, 2022 & 2032F |
9.4 Slovenia Bio Butadiene Market Opportunity Assessment, By Production Method, 2022 & 2032F |
9.5 Slovenia Bio Butadiene Market Opportunity Assessment, By Environmental Impact, 2022 & 2032F |
10 Slovenia Bio Butadiene Market - Competitive Landscape |
10.1 Slovenia Bio Butadiene Market Revenue Share, By Companies, 2025 |
10.2 Slovenia Bio Butadiene Market Competitive Benchmarking, By Operating and Technical Parameters |
11 Company Profiles |
12 Recommendations |
13 Disclaimer |
Global Go To Market Strategy - 2030
Export potential enables firms to identify high-growth global markets with greater confidence by combining advanced trade intelligence with a structured quantitative methodology. The framework analyzes emerging demand trends and country-level import patterns while integrating macroeconomic and trade datasets such as GDP and population forecasts, bilateral import–export flows, tariff structures, elasticity differentials between developed and developing economies, geographic distance, and import demand projections. Using weighted trade values from 2020–2024 as the base period to project country-to-country export potential for 2030, these inputs are operationalized through calculated drivers such as gravity model parameters, tariff impact factors, and projected GDP per-capita growth. Through an analysis of hidden potentials, demand hotspots, and market conditions that are most favorable to success, this method enables firms to focus on target countries, maximize returns, and global expansion with data, backed by accuracy.
By factoring in the projected importer demand gap that is currently unmet and could be potential opportunity, it identifies the potential for the Exporter (Country) among 190 countries, against the general trade analysis, which identifies the biggest importer or exporter.
To discover high-growth global markets and optimize your business strategy:
Click Here
Pricing
- Single User License$ 1,995
- Department License$ 2,400
- Site License$ 3,120
- Global License$ 3,795

Leadership Perspectives from Industry Events
Search
Thought Leadership and Analyst Meet


Our Clients
6WResearch In News
- India Export Attractiveness Tracker 2026
- India Air Conditioner Market Set for Strong Rebound in 2026 After Weather-Led Correction and GST-Driven Recovery: 6Wresearch
- ADAS in India: How Automatic Emergency Braking, Blind Spot Detection & Driver Monitoring are Transforming Road Safety
- Doha a strategic location for EV manufacturing hub: IPA Qatar
- Demand for luxury TVs surging in the GCC, says Samsung
- Empowering Growth: The Thriving Journey of Bangladesh’s Cable Industry
Latest Reports
- Nicaragua RPG Gaming Market (2026-2032)
- New Zealand RPG Gaming Market (2026-2032)
- Netherlands RPG Gaming Market (2026-2032)
- Nauru RPG Gaming Market (2026-2032)
- Namibia RPG Gaming Market (2026-2032)
- Mozambique RPG Gaming Market (2026-2032)
- Montenegro RPG Gaming Market (2026-2032)
- Mongolia RPG Gaming Market (2026-2032)
- Monaco RPG Gaming Market (2026-2032)
- Micronesia RPG Gaming Market (2026-2032)
Industry Events and Analyst Meet

EV India Expo 2026

HIMTEX 2026

India Refining Summit 2026

India EV Show 2026

EV tech India Expo 2026
Whitepaper
- Middle East & Africa Commercial Security Market Click here to view more.
- Middle East & Africa Fire Safety Systems & Equipment Market Click here to view more.
- GCC Drone Market Click here to view more.
- Middle East Lighting Fixture Market Click here to view more.
- GCC Physical & Perimeter Security Market Click here to view more.