Slovenia Brewers Spent Grain Market (2026-2032) | Companies, Industry, Growth, Trends, Competitive Landscape, Value, Outlook, Forecast, Segmentation, Size & Revenue, Analysis, Share
Market Forecast By Product (Wheat, Barley, Rye, Oats, Other Grains), By Application (Animal Feed, Food & Beverages, Dietary Supplements, Breweries (Return)) And Competitive Landscape
| Product Code: ETC9312411 | Publication Date: Sep 2024 | Updated Date: Apr 2026 | Product Type: Market Research Report | |
| Publisher: 6Wresearch | Author: Sumit Sagar | No. of Pages: 75 | No. of Figures: 35 | No. of Tables: 20 |
Slovenia Brewers Spent Grain Market Size (2020-2030)
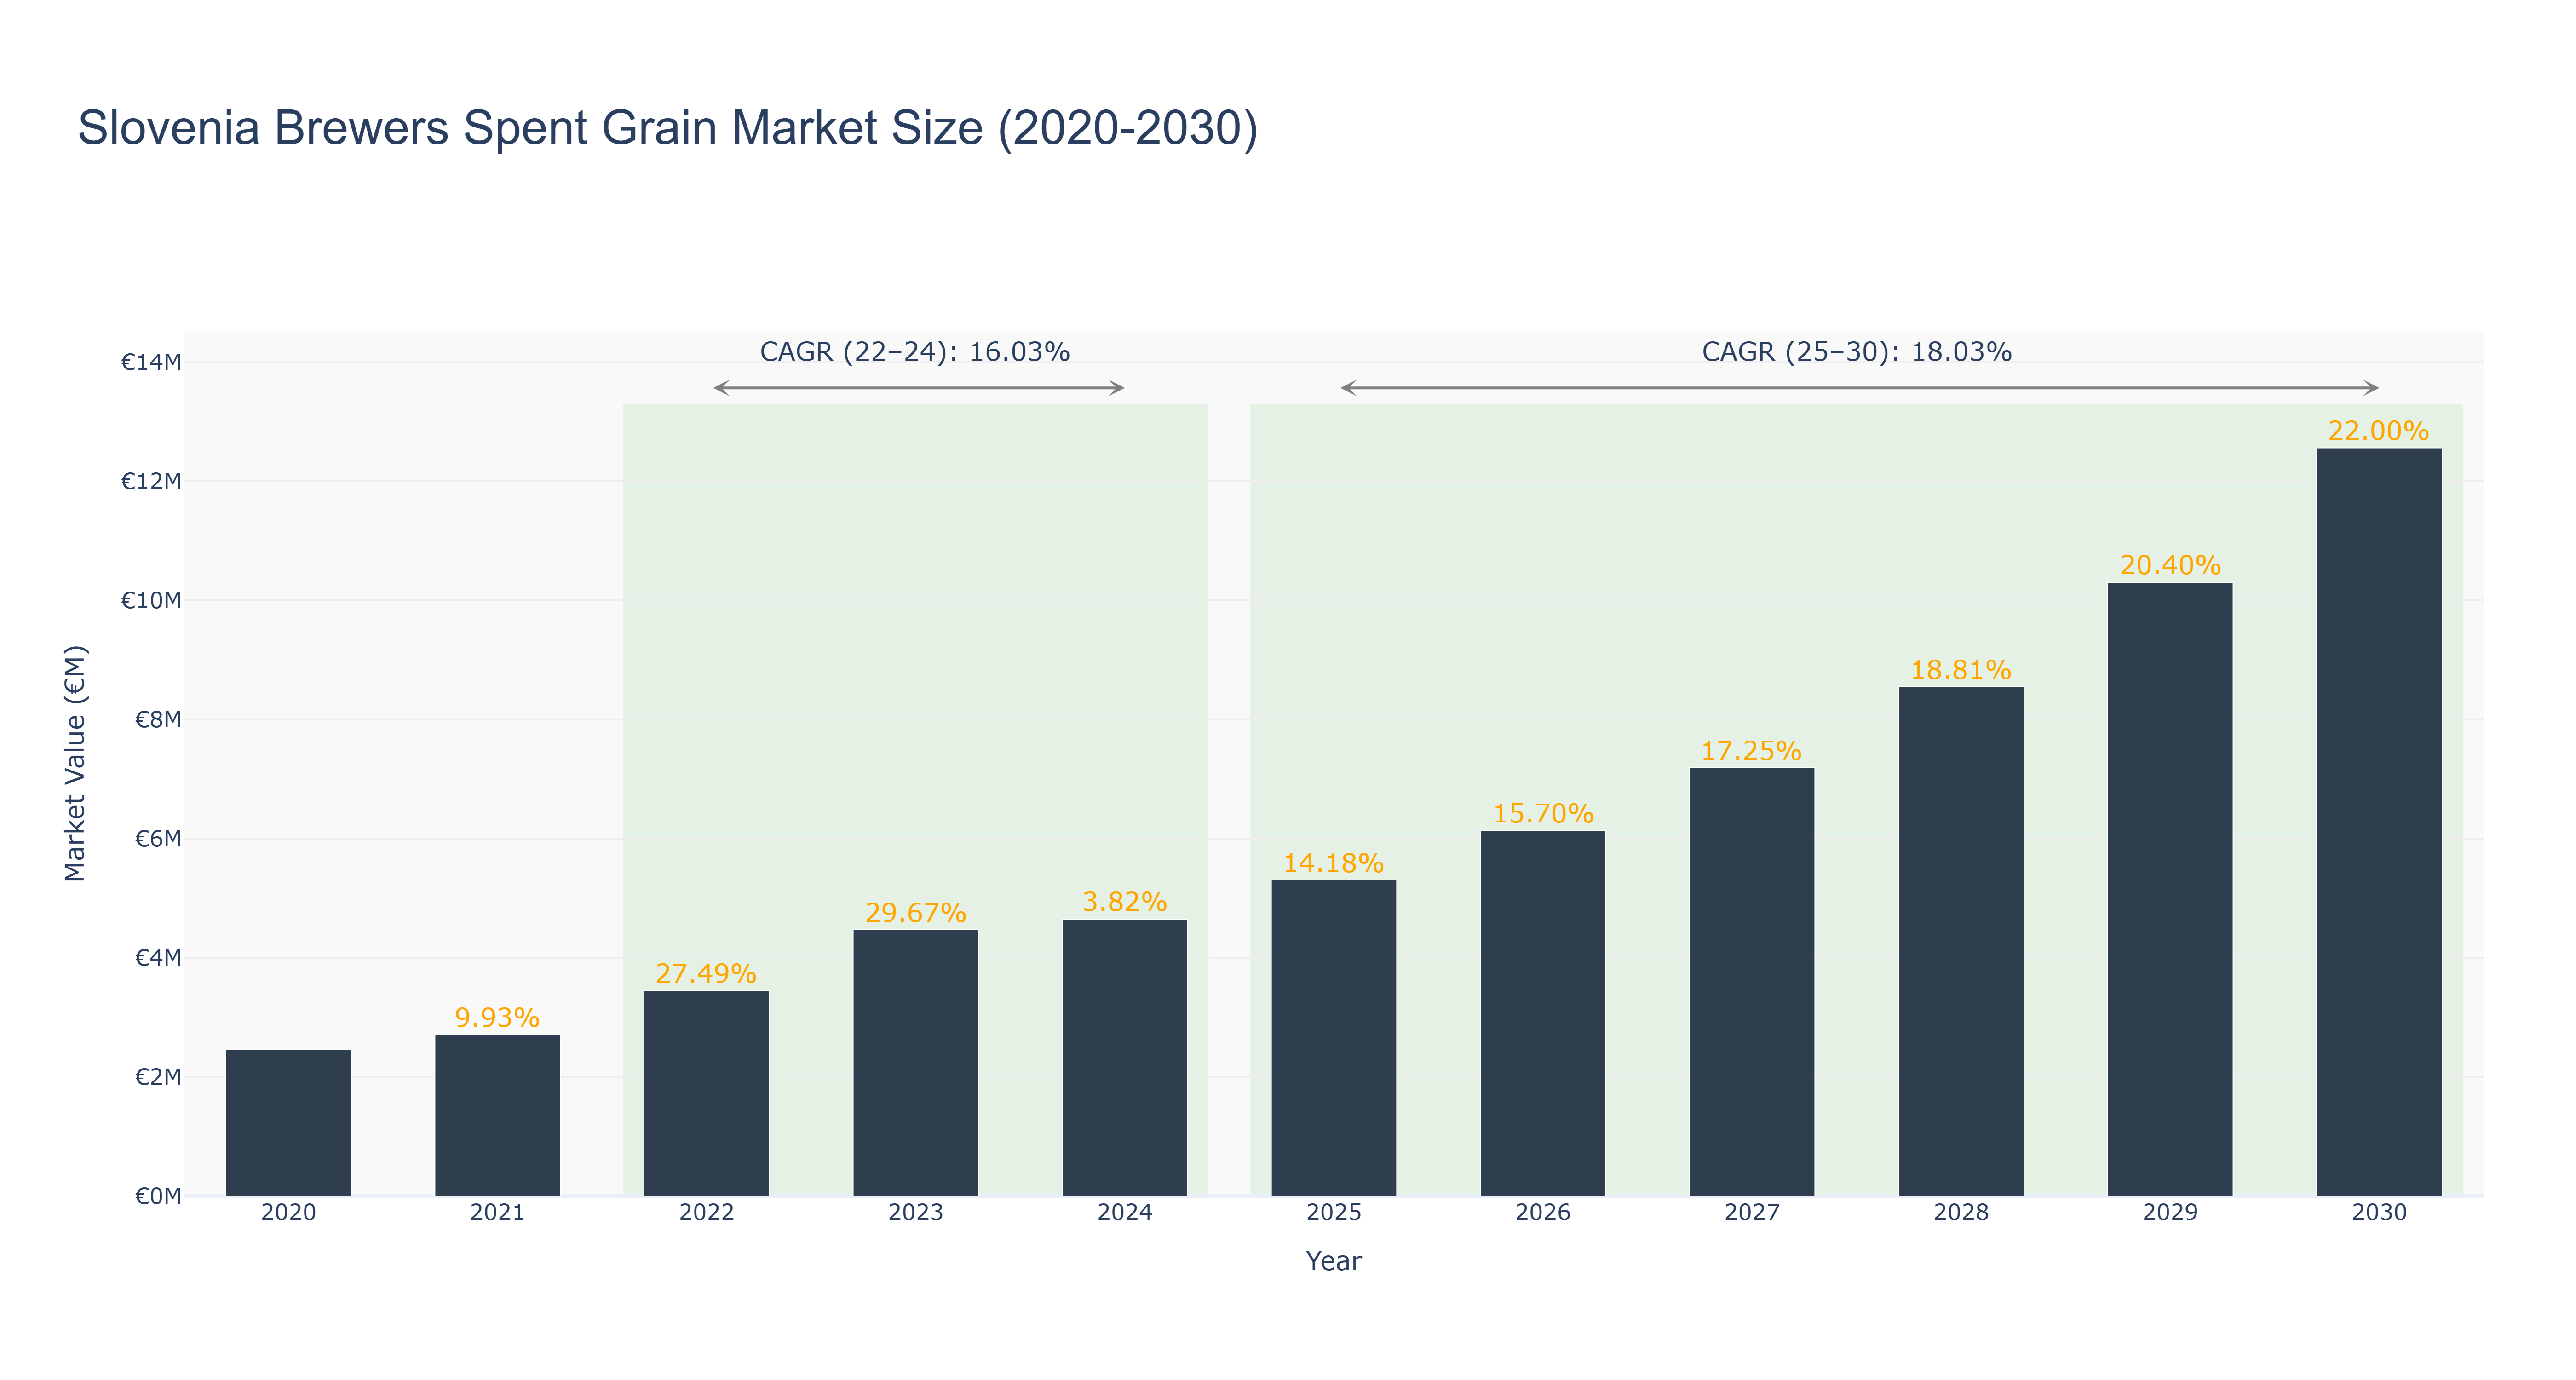
The Slovenia Brewers Spent Grain Market has demonstrated significant growth in recent years, reflecting a peak market size of €4.65 million in 2024, with an impressive compound annual growth rate (CAGR) of 16.03% from 2022 to 2024. The market has been bolstered by an increasing awareness of sustainable practices and the utilization of spent grains in various applications, including animal feed and bioenergy. Looking ahead, the forecasted period from 2025 to 2030 indicates a robust CAGR of 18.03%, with the market projected to reach €12.56 million by 2030. This growth can be attributed to ongoing innovations in recycling technologies and a rising demand for eco-friendly products. As Slovenia continues to enhance its brewing industry infrastructure and sustainability initiatives, the market is poised for sustained expansion, driven by both domestic and international market dynamics.
Slovenia Brewers Spent Grain Market: Production & Trade Performance (2019-2025)
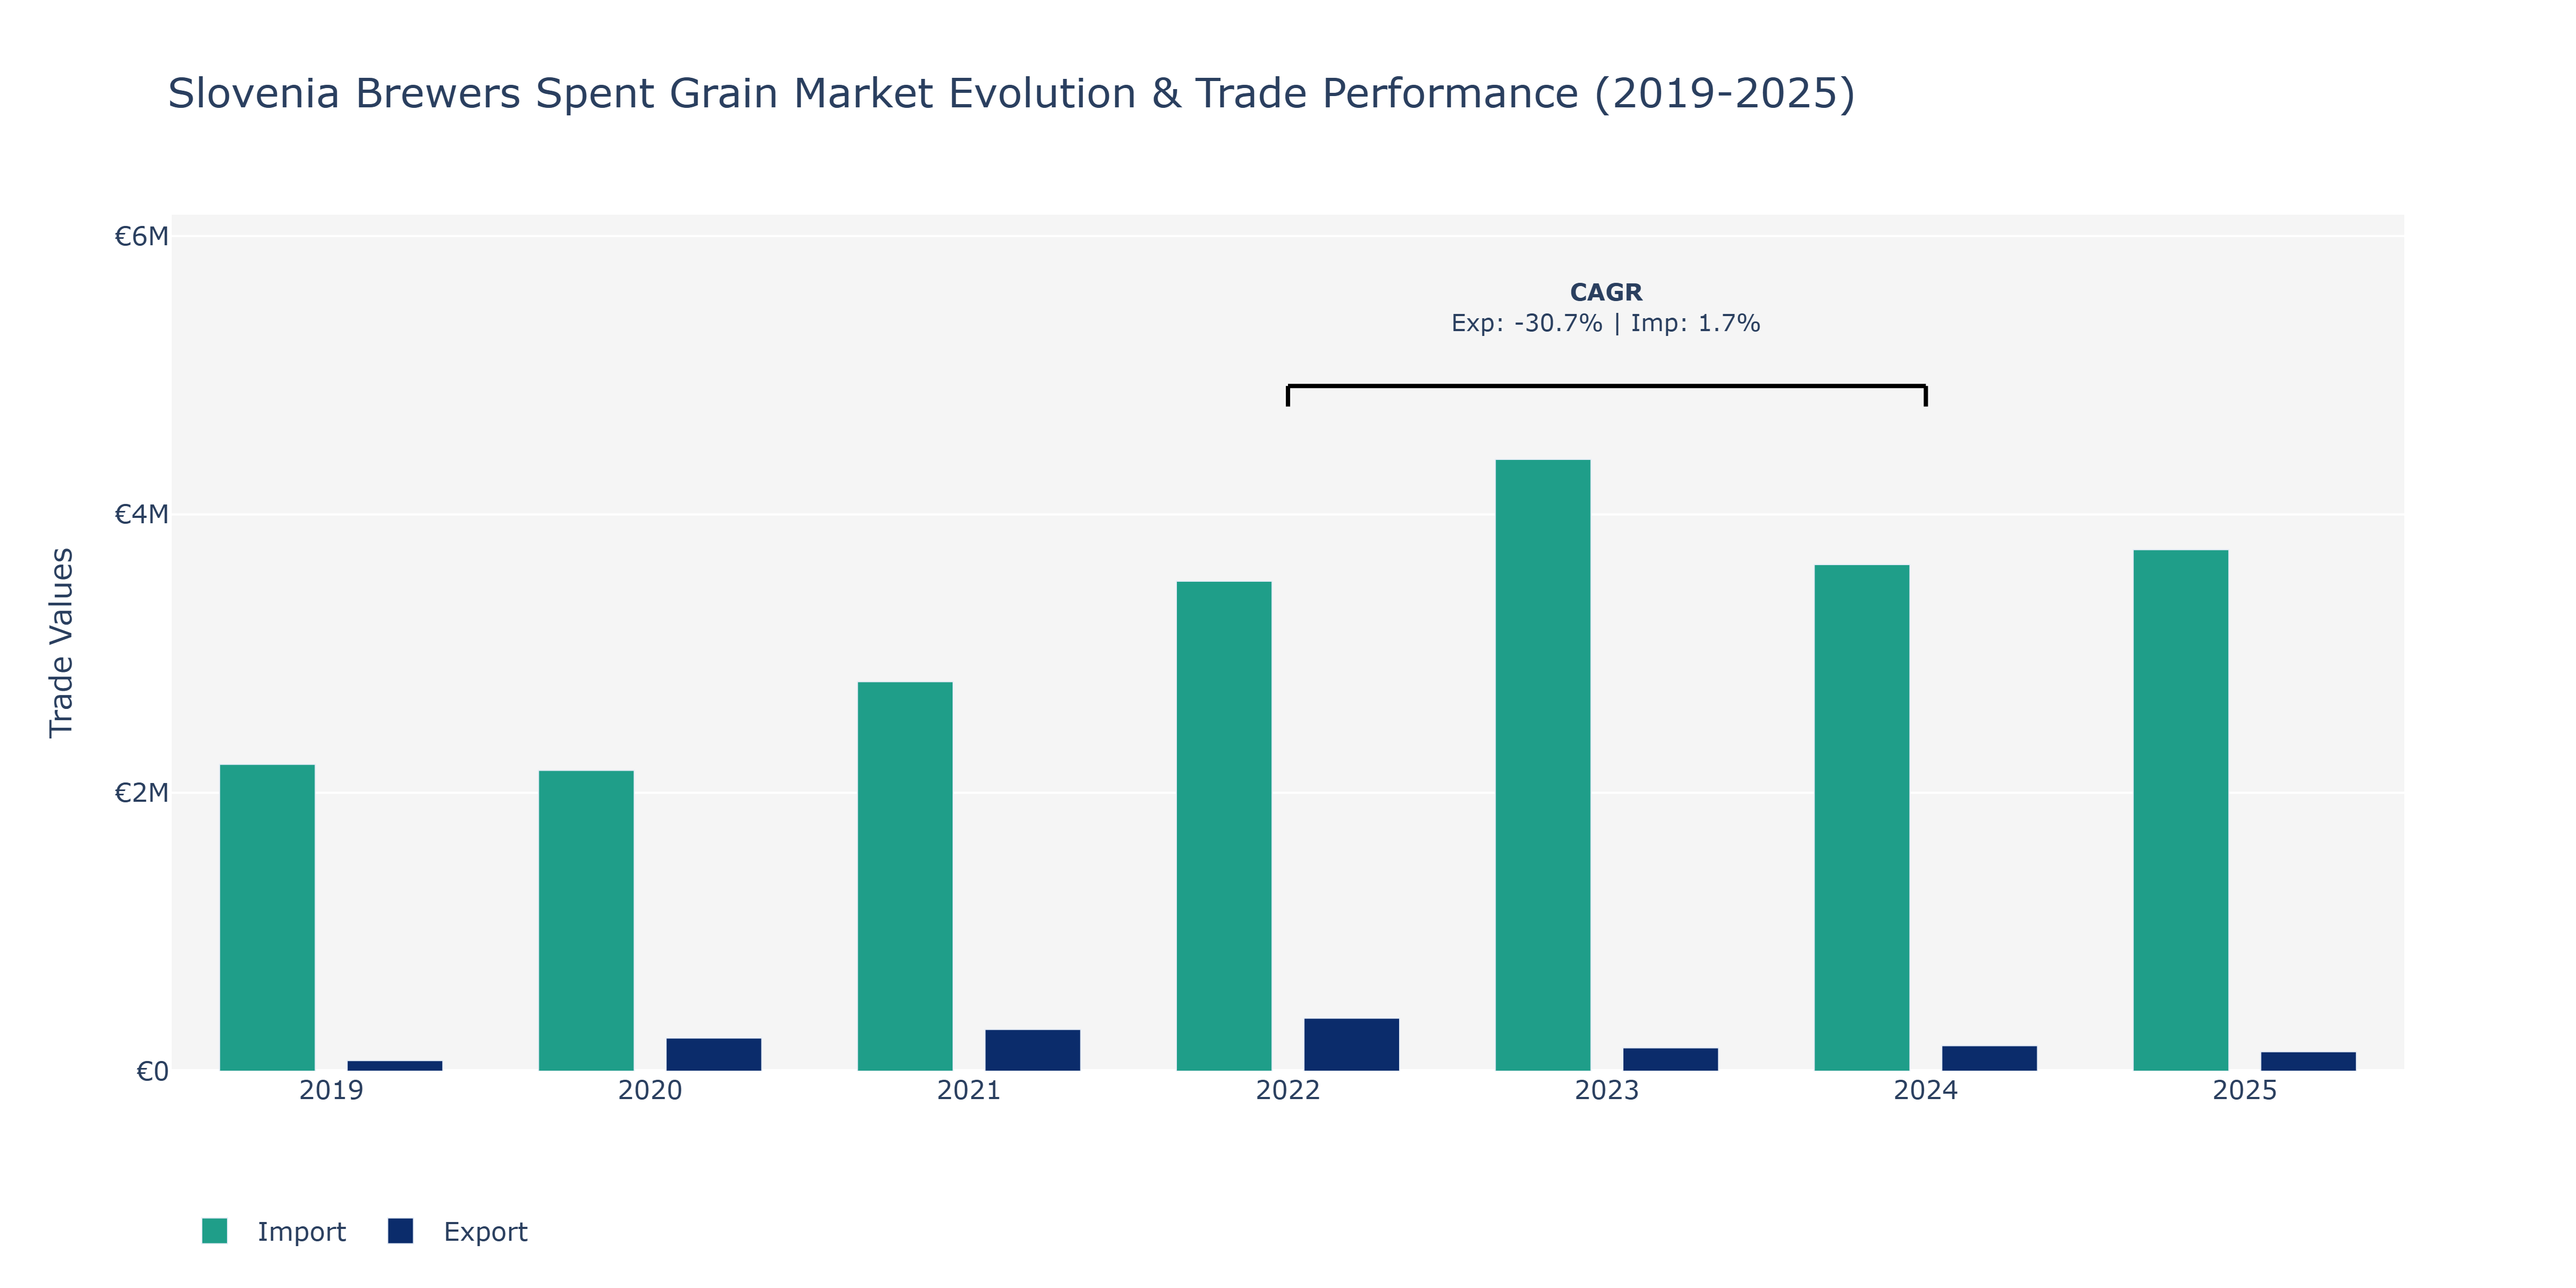
The Slovenia Brewers Spent Grain Market experienced notable fluctuations in both Exports and Imports from 2019 to 2025. In 2019, Imports reached €2.2 million, significantly exceeding Exports of €75.96 thousand. By 2021, both Exports and Imports showed steady growth, with Exports rising to €299.71 thousand and Imports to €2.8 million. However, 2023 saw a sharp decline in Exports to €167.91 thousand, while Imports continued to increase to €4.4 million, marking a peak point. The following year, Exports slightly recovered to €182.75 thousand, whereas Imports decreased to €3.64 million. The most recent value in 2025 revealed Exports at €139.41 thousand and Imports at €3.75 million. The surge in Imports can be attributed to increased demand for spent grain in brewing processes, potentially due to the growing craft beer industry in Slovenia. The fluctuations in Exports may result from varying export destinations, changes in global demand, or domestic supply dynamics impacting production levels.
Key Highlights of the Report:
- Slovenia Brewers Spent Grain Market Outlook
- Market Size of Slovenia Brewers Spent Grain Market, 2025
- Forecast of Slovenia Brewers Spent Grain Market, 2032
- Historical Data and Forecast of Slovenia Brewers Spent Grain Revenues & Volume for the Period 2022-2032F
- Slovenia Brewers Spent Grain Market Trend Evolution
- Slovenia Brewers Spent Grain Market Drivers and Challenges
- Slovenia Brewers Spent Grain Price Trends
- Slovenia Brewers Spent Grain Porter's Five Forces
- Slovenia Brewers Spent Grain Industry Life Cycle
- Historical Data and Forecast of Slovenia Brewers Spent Grain Market Revenues & Volume By Product for the Period 2022-2032F
- Historical Data and Forecast of Slovenia Brewers Spent Grain Market Revenues & Volume By Wheat for the Period 2022-2032F
- Historical Data and Forecast of Slovenia Brewers Spent Grain Market Revenues & Volume By Barley for the Period 2022-2032F
- Historical Data and Forecast of Slovenia Brewers Spent Grain Market Revenues & Volume By Rye for the Period 2022-2032F
- Historical Data and Forecast of Slovenia Brewers Spent Grain Market Revenues & Volume By Oats for the Period 2022-2032F
- Historical Data and Forecast of Slovenia Brewers Spent Grain Market Revenues & Volume By Other Grains for the Period 2022-2032F
- Historical Data and Forecast of Slovenia Brewers Spent Grain Market Revenues & Volume By Application for the Period 2022-2032F
- Historical Data and Forecast of Slovenia Brewers Spent Grain Market Revenues & Volume By Animal Feed for the Period 2022-2032F
- Historical Data and Forecast of Slovenia Brewers Spent Grain Market Revenues & Volume By Food & Beverages for the Period 2022-2032F
- Historical Data and Forecast of Slovenia Brewers Spent Grain Market Revenues & Volume By Dietary Supplements for the Period 2022-2032F
- Historical Data and Forecast of Slovenia Brewers Spent Grain Market Revenues & Volume By Breweries (Return) for the Period 2022-2032F
- Slovenia Brewers Spent Grain Import Export Trade Statistics
- Market Opportunity Assessment By Product
- Market Opportunity Assessment By Application
- Slovenia Brewers Spent Grain Top Companies Market Share
- Slovenia Brewers Spent Grain Competitive Benchmarking By Technical and Operational Parameters
- Slovenia Brewers Spent Grain Company Profiles
- Slovenia Brewers Spent Grain Key Strategic Recommendations
Frequently Asked Questions About the Market Study (FAQs):
6Wresearch actively monitors the Slovenia Brewers Spent Grain Market and publishes its comprehensive annual report, highlighting emerging trends, growth drivers, revenue analysis, and forecast outlook. Our insights help businesses to make data-backed strategic decisions with ongoing market dynamics. Our analysts track relevent industries related to the Slovenia Brewers Spent Grain Market, allowing our clients with actionable intelligence and reliable forecasts tailored to emerging regional needs.
Yes, we provide customisation as per your requirements. To learn more, feel free to contact us on sales@6wresearch.com
1 Executive Summary |
2 Introduction |
2.1 Key Highlights of the Report |
2.2 Report Description |
2.3 Market Scope & Segmentation |
2.4 Research Methodology |
2.5 Assumptions |
3 Slovenia Brewers Spent Grain Market Overview |
3.1 Slovenia Country Macro Economic Indicators |
3.2 Slovenia Brewers Spent Grain Market Revenues & Volume, 2022 & 2032F |
3.3 Slovenia Brewers Spent Grain Market - Industry Life Cycle |
3.4 Slovenia Brewers Spent Grain Market - Porter's Five Forces |
3.5 Slovenia Brewers Spent Grain Market Revenues & Volume Share, By Product, 2022 & 2032F |
3.6 Slovenia Brewers Spent Grain Market Revenues & Volume Share, By Application, 2022 & 2032F |
4 Slovenia Brewers Spent Grain Market Dynamics |
4.1 Impact Analysis |
4.2 Market Drivers |
4.2.1 Increasing awareness about sustainable practices in the brewing industry |
4.2.2 Growing demand for animal feed with high nutritional content |
4.2.3 Rising focus on reducing waste and promoting circular economy practices |
4.3 Market Restraints |
4.3.1 Fluctuations in raw material prices |
4.3.2 Regulatory challenges related to waste management and by-product utilization |
5 Slovenia Brewers Spent Grain Market Trends |
6 Slovenia Brewers Spent Grain Market, By Types |
6.1 Slovenia Brewers Spent Grain Market, By Product |
6.1.1 Overview and Analysis |
6.1.2 Slovenia Brewers Spent Grain Market Revenues & Volume, By Product, 2022-2032F |
6.1.3 Slovenia Brewers Spent Grain Market Revenues & Volume, By Wheat, 2022-2032F |
6.1.4 Slovenia Brewers Spent Grain Market Revenues & Volume, By Barley, 2022-2032F |
6.1.5 Slovenia Brewers Spent Grain Market Revenues & Volume, By Rye, 2022-2032F |
6.1.6 Slovenia Brewers Spent Grain Market Revenues & Volume, By Oats, 2022-2032F |
6.1.7 Slovenia Brewers Spent Grain Market Revenues & Volume, By Other Grains, 2022-2032F |
6.2 Slovenia Brewers Spent Grain Market, By Application |
6.2.1 Overview and Analysis |
6.2.2 Slovenia Brewers Spent Grain Market Revenues & Volume, By Animal Feed, 2022-2032F |
6.2.3 Slovenia Brewers Spent Grain Market Revenues & Volume, By Food & Beverages, 2022-2032F |
6.2.4 Slovenia Brewers Spent Grain Market Revenues & Volume, By Dietary Supplements, 2022-2032F |
6.2.5 Slovenia Brewers Spent Grain Market Revenues & Volume, By Breweries (Return), 2022-2032F |
7 Slovenia Brewers Spent Grain Market Import-Export Trade Statistics |
7.1 Slovenia Brewers Spent Grain Market Export to Major Countries |
7.2 Slovenia Brewers Spent Grain Market Imports from Major Countries |
8 Slovenia Brewers Spent Grain Market Key Performance Indicators |
8.1 Percentage of breweries adopting spent grain utilization practices |
8.2 Growth in the number of partnerships between breweries and animal feed manufacturers for spent grain utilization |
8.3 Increase in research and development investments in finding innovative ways to utilize spent grain |
9 Slovenia Brewers Spent Grain Market - Opportunity Assessment |
9.1 Slovenia Brewers Spent Grain Market Opportunity Assessment, By Product, 2022 & 2032F |
9.2 Slovenia Brewers Spent Grain Market Opportunity Assessment, By Application, 2022 & 2032F |
10 Slovenia Brewers Spent Grain Market - Competitive Landscape |
10.1 Slovenia Brewers Spent Grain Market Revenue Share, By Companies, 2025 |
10.2 Slovenia Brewers Spent Grain Market Competitive Benchmarking, By Operating and Technical Parameters |
11 Company Profiles |
12 Recommendations |
13 Disclaimer |
Global Go To Market Strategy - 2030
Export potential enables firms to identify high-growth global markets with greater confidence by combining advanced trade intelligence with a structured quantitative methodology. The framework analyzes emerging demand trends and country-level import patterns while integrating macroeconomic and trade datasets such as GDP and population forecasts, bilateral import–export flows, tariff structures, elasticity differentials between developed and developing economies, geographic distance, and import demand projections. Using weighted trade values from 2020–2024 as the base period to project country-to-country export potential for 2030, these inputs are operationalized through calculated drivers such as gravity model parameters, tariff impact factors, and projected GDP per-capita growth. Through an analysis of hidden potentials, demand hotspots, and market conditions that are most favorable to success, this method enables firms to focus on target countries, maximize returns, and global expansion with data, backed by accuracy.
By factoring in the projected importer demand gap that is currently unmet and could be potential opportunity, it identifies the potential for the Exporter (Country) among 190 countries, against the general trade analysis, which identifies the biggest importer or exporter.
To discover high-growth global markets and optimize your business strategy:
Click Here
Pricing
- Single User License$ 1,995
- Department License$ 2,400
- Site License$ 3,120
- Global License$ 3,795

Leadership Perspectives from Industry Events
Search
Thought Leadership and Analyst Meet


Our Clients
6WResearch In News
- India Export Attractiveness Tracker 2026
- India Air Conditioner Market Set for Strong Rebound in 2026 After Weather-Led Correction and GST-Driven Recovery: 6Wresearch
- ADAS in India: How Automatic Emergency Braking, Blind Spot Detection & Driver Monitoring are Transforming Road Safety
- Doha a strategic location for EV manufacturing hub: IPA Qatar
- Demand for luxury TVs surging in the GCC, says Samsung
- Empowering Growth: The Thriving Journey of Bangladesh’s Cable Industry
Latest Reports
- Nicaragua RPG Gaming Market (2026-2032)
- New Zealand RPG Gaming Market (2026-2032)
- Netherlands RPG Gaming Market (2026-2032)
- Nauru RPG Gaming Market (2026-2032)
- Namibia RPG Gaming Market (2026-2032)
- Mozambique RPG Gaming Market (2026-2032)
- Montenegro RPG Gaming Market (2026-2032)
- Mongolia RPG Gaming Market (2026-2032)
- Monaco RPG Gaming Market (2026-2032)
- Micronesia RPG Gaming Market (2026-2032)
Industry Events and Analyst Meet

EV India Expo 2026

HIMTEX 2026

India Refining Summit 2026

India EV Show 2026

EV tech India Expo 2026
Whitepaper
- Middle East & Africa Commercial Security Market Click here to view more.
- Middle East & Africa Fire Safety Systems & Equipment Market Click here to view more.
- GCC Drone Market Click here to view more.
- Middle East Lighting Fixture Market Click here to view more.
- GCC Physical & Perimeter Security Market Click here to view more.