Slovenia Catgut Sutures Market (2026-2032) | Size, Segmentation, Analysis, Industry, Trends, Outlook, Companies, Forecast, Revenue, Growth, Share & Value
Market Forecast By Type (Absorbable Sutures, Non-absorbable Sutures), By Raw Material (Natural, Synthetic), By End User Channel (Hospitals, Ambulatory Surgical Centers, Specialty Clinics) And Competitive Landscape
| Product Code: ETC5150260 | Publication Date: Nov 2023 | Updated Date: Apr 2026 | Product Type: Market Research Report | |
| Publisher: 6Wresearch | Author: Shubham Padhi | No. of Pages: 60 | No. of Figures: 30 | No. of Tables: 5 |
Slovenia Catgut Sutures Market Size (2020-2030)
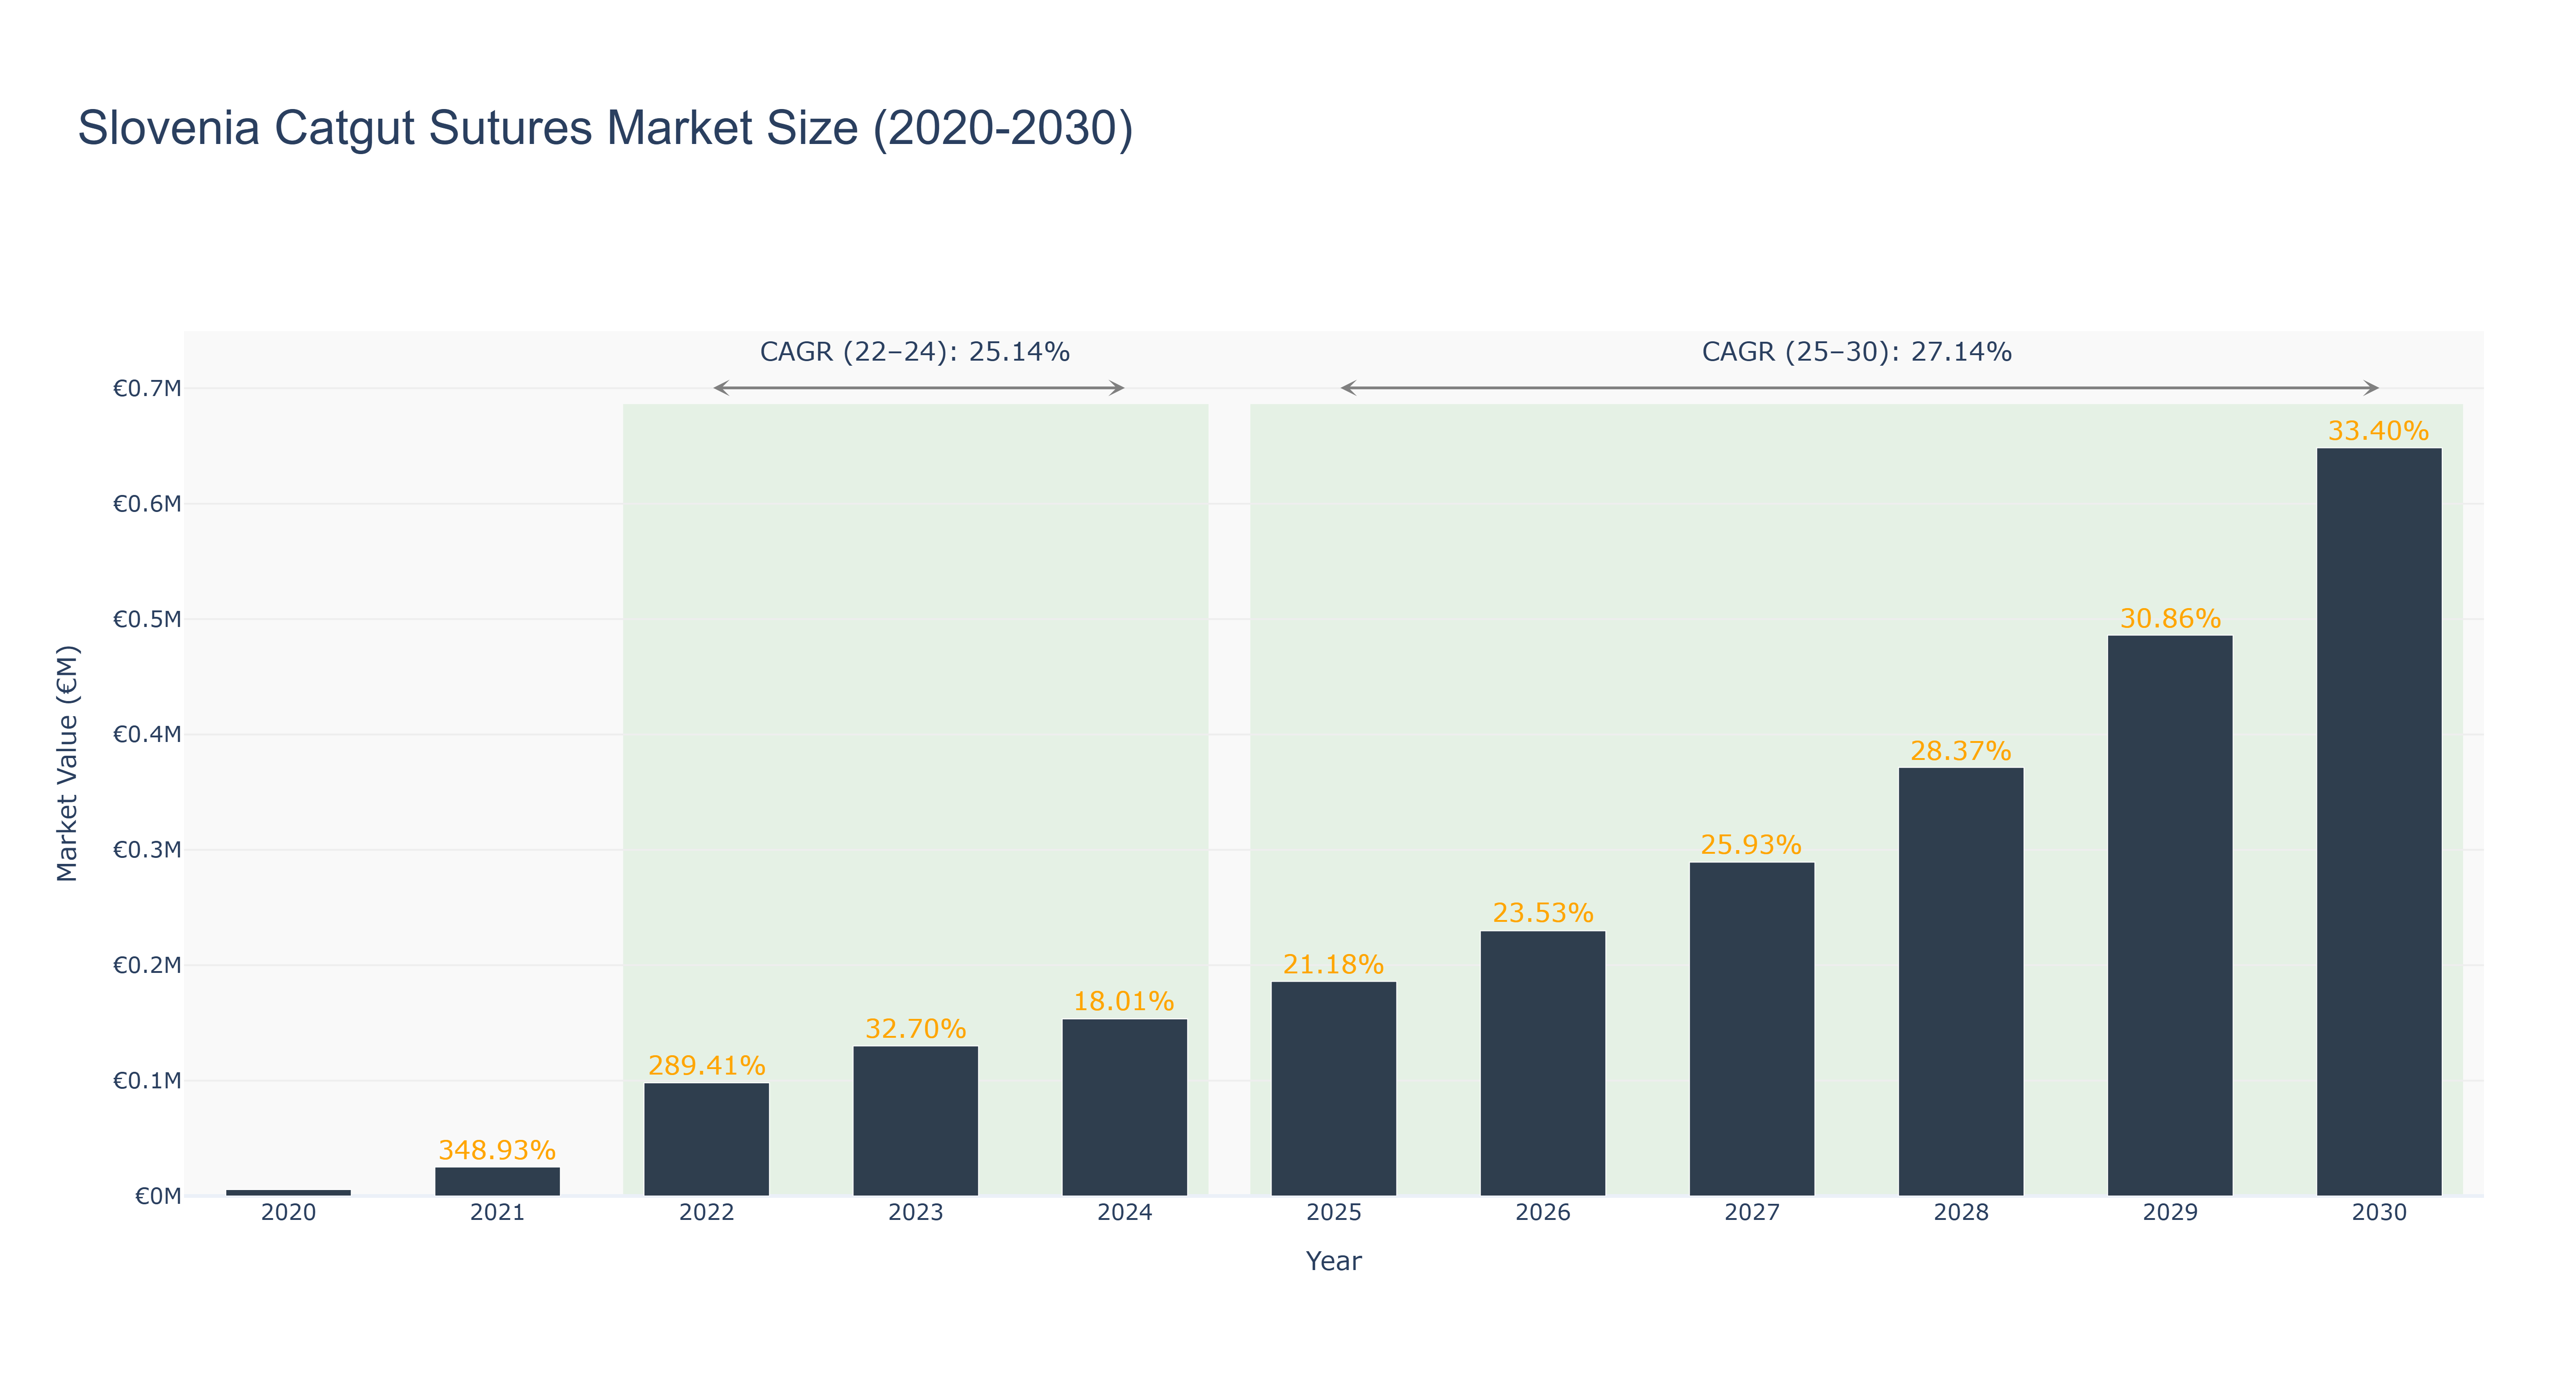
The Slovenia Catgut Sutures Market has shown a steady growth trajectory over the past decade. The market size increased from €0.01 million in 2020 to €0.15 million in 2024, experiencing significant growth each year. The forecasted market size is expected to reach €0.65 million by 2030, with a CAGR of 27.14% from 2025 to 2030. The peak market size was reached in 2030. The market witnessed a notable spike in growth from 2025 onwards, attributed to increasing demand for advanced medical sutures and technological advancements in healthcare. The industry drivers include rising surgical procedures and a growing emphasis on patient outcomes. Looking ahead, Slovenia is set to introduce new regulations promoting the adoption of innovative medical devices, which will likely further boost the Catgut Sutures Market in the country.
Slovenia Catgut Sutures Market: Production & Trade Performance (2019-2025)
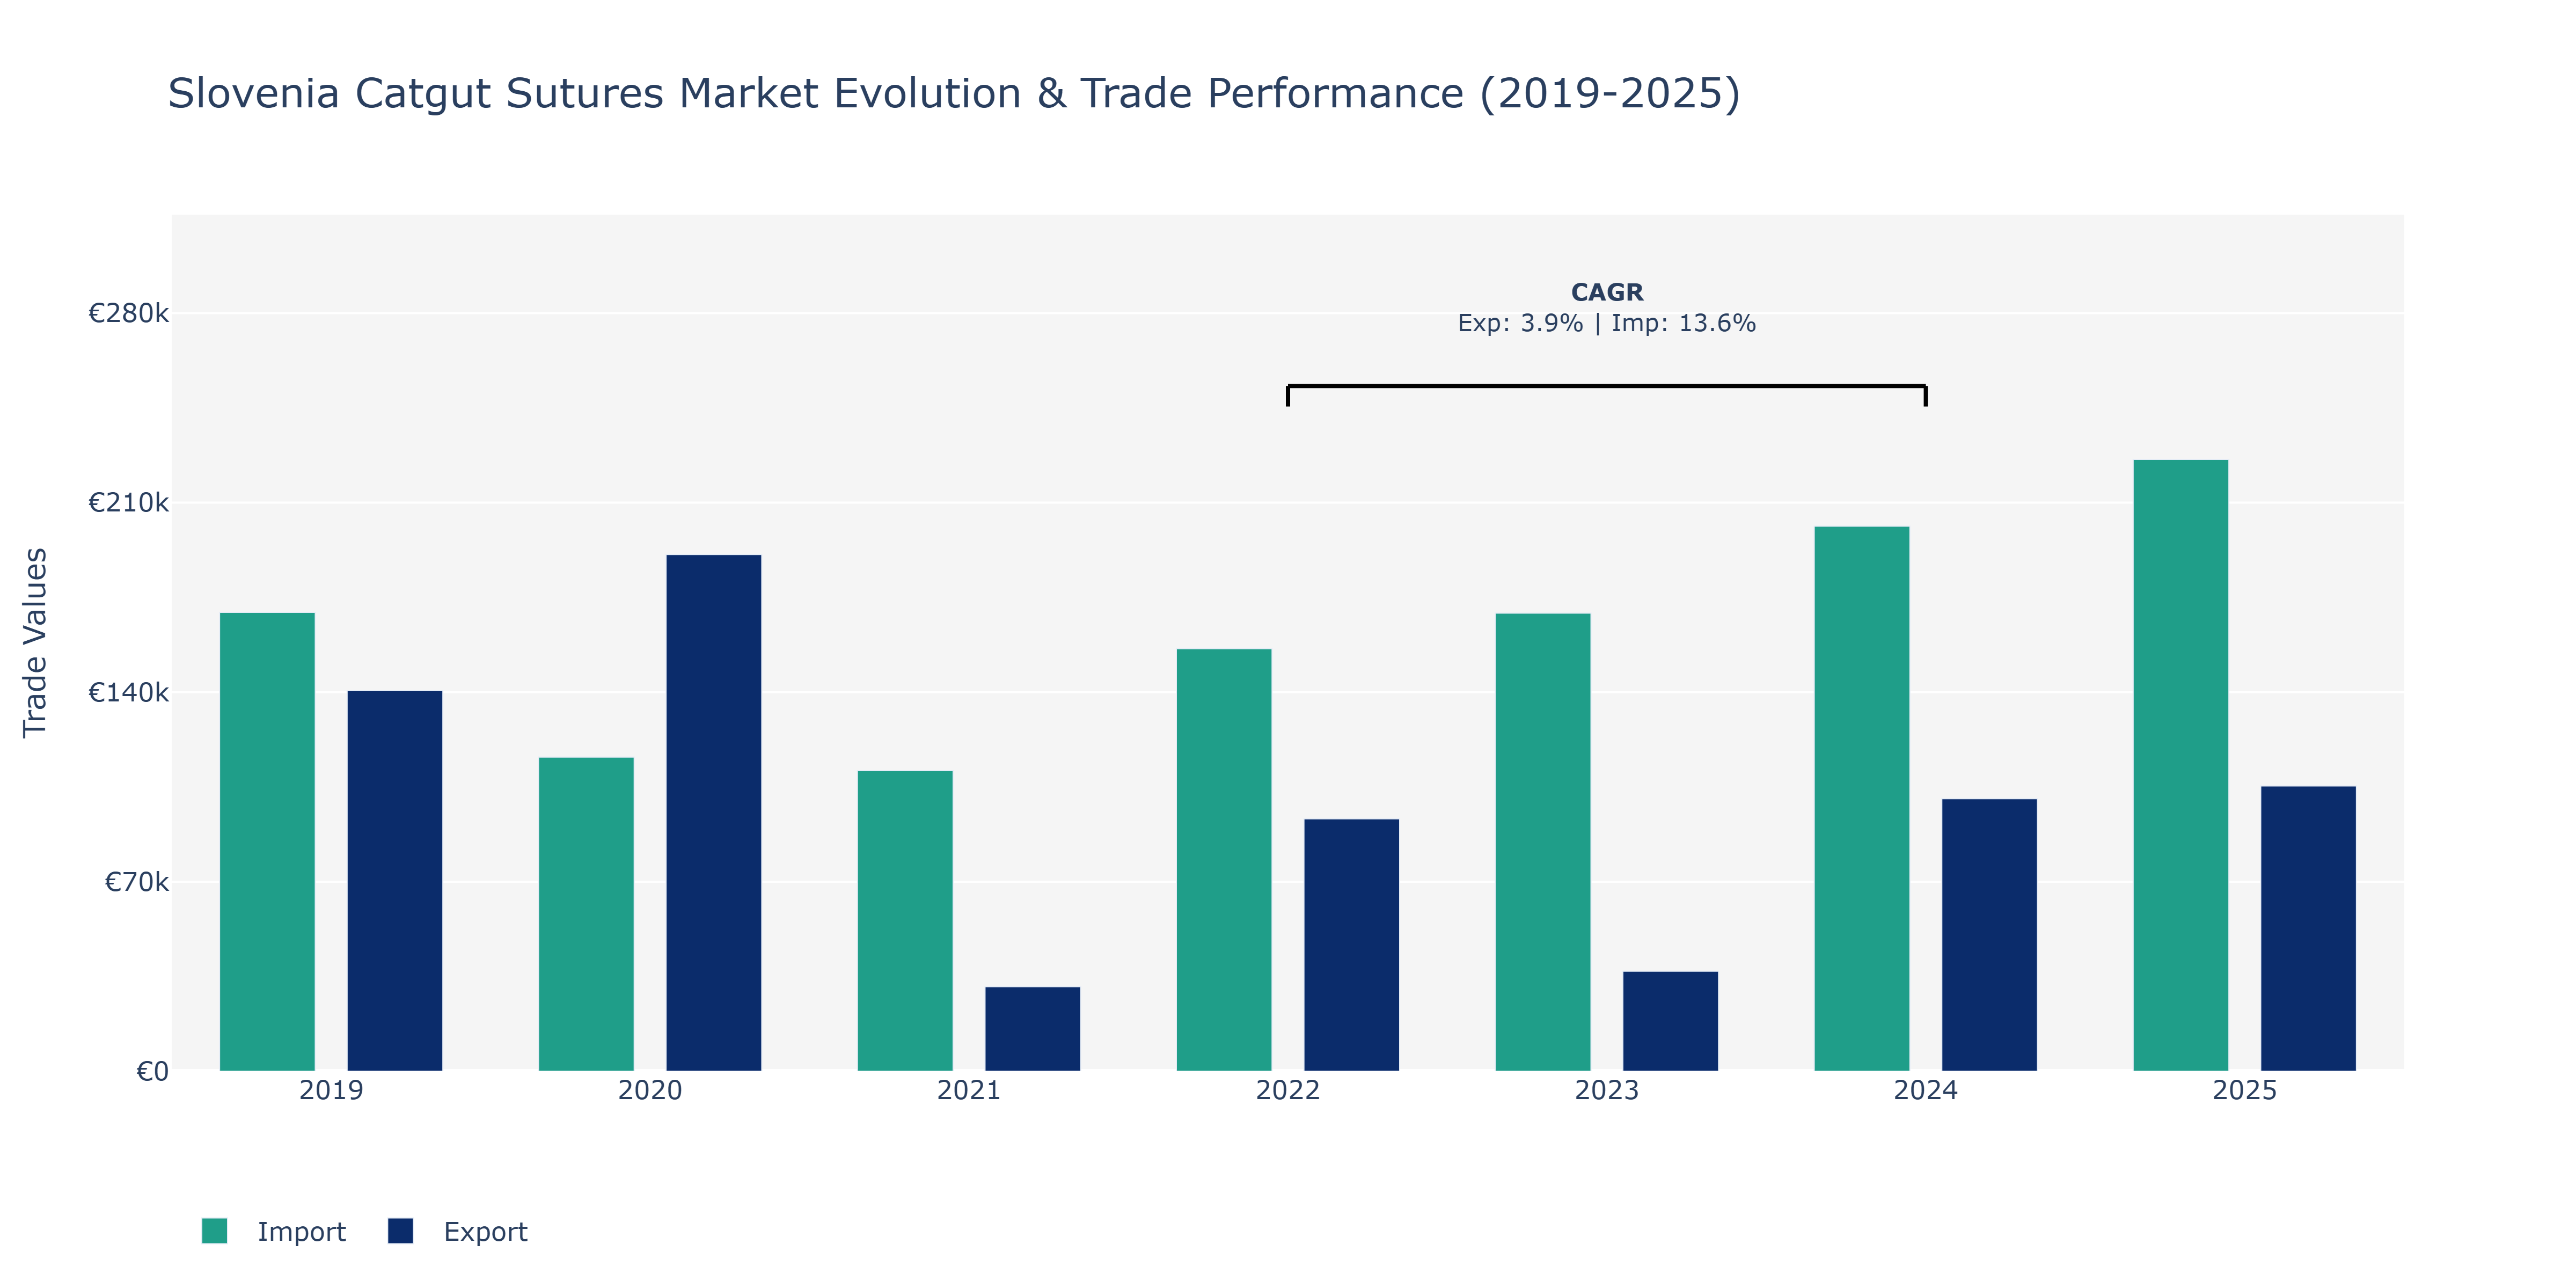
Between 2019 and 2025, Slovenia's Catgut Sutures Market showcased varying trends in exports and imports. Exports surged from €140.54 thousand in 2019 to a peak of €190.85 thousand in 2020 before dropping significantly to €31.22 thousand in 2021. The market rebounded in 2022 to €93.23 thousand, continued a slight upward trajectory in 2023, and peaked at €105.34 thousand in 2025. In contrast, imports fluctuated notably, starting at €169.5 thousand in 2019, dipping to €116.0 thousand in 2020, and then stabilizing around €160 thousand in subsequent years. One possible reason for the export fluctuations could be shifts in demand from key trading partners or changes in domestic production capacities. The increase in imports could be attributed to the need for advanced medical technologies or raw materials to support the growing healthcare sector in Slovenia. Such fluctuations emphasize the market's sensitivity to global economic conditions and local healthcare developments, highlighting the importance of strategic planning for stakeholders in the Catgut Sutures Market.
Key Highlights of the Report:
- Slovenia Catgut Sutures Market Outlook
- Market Size of Slovenia Catgut Sutures Market, 2025
- Forecast of Slovenia Catgut Sutures Market, 2032
- Historical Data and Forecast of Slovenia Catgut Sutures Revenues & Volume for the Period 2022-2032F
- Slovenia Catgut Sutures Market Trend Evolution
- Slovenia Catgut Sutures Market Drivers and Challenges
- Slovenia Catgut Sutures Price Trends
- Slovenia Catgut Sutures Porter`s Five Forces
- Slovenia Catgut Sutures Industry Life Cycle
- Historical Data and Forecast of Slovenia Catgut Sutures Market Revenues & Volume By Type for the Period 2022-2032F
- Historical Data and Forecast of Slovenia Catgut Sutures Market Revenues & Volume By Absorbable Sutures for the Period 2022-2032F
- Historical Data and Forecast of Slovenia Catgut Sutures Market Revenues & Volume By Non-absorbable Sutures for the Period 2022-2032F
- Historical Data and Forecast of Slovenia Catgut Sutures Market Revenues & Volume By Raw Material for the Period 2022-2032F
- Historical Data and Forecast of Slovenia Catgut Sutures Market Revenues & Volume By Natural for the Period 2022-2032F
- Historical Data and Forecast of Slovenia Catgut Sutures Market Revenues & Volume By Synthetic for the Period 2022-2032F
- Historical Data and Forecast of Slovenia Catgut Sutures Market Revenues & Volume By End User Channel for the Period 2022-2032F
- Historical Data and Forecast of Slovenia Catgut Sutures Market Revenues & Volume By Hospitals for the Period 2022-2032F
- Historical Data and Forecast of Slovenia Catgut Sutures Market Revenues & Volume By Ambulatory Surgical Centers for the Period 2022-2032F
- Historical Data and Forecast of Slovenia Catgut Sutures Market Revenues & Volume By Specialty Clinics for the Period 2022-2032F
- Slovenia Catgut Sutures Import Export Trade Statistics
- Market Opportunity Assessment By Type
- Market Opportunity Assessment By Raw Material
- Market Opportunity Assessment By End User Channel
- Slovenia Catgut Sutures Top Companies Market Share
- Slovenia Catgut Sutures Competitive Benchmarking By Technical and Operational Parameters
- Slovenia Catgut Sutures Company Profiles
- Slovenia Catgut Sutures Key Strategic Recommendations
Frequently Asked Questions About the Market Study (FAQs):
6Wresearch actively monitors the Slovenia Catgut Sutures Market and publishes its comprehensive annual report, highlighting emerging trends, growth drivers, revenue analysis, and forecast outlook. Our insights help businesses to make data-backed strategic decisions with ongoing market dynamics. Our analysts track relevent industries related to the Slovenia Catgut Sutures Market, allowing our clients with actionable intelligence and reliable forecasts tailored to emerging regional needs.
Yes, we provide customisation as per your requirements. To learn more, feel free to contact us on sales@6wresearch.com
1 Executive Summary |
2 Introduction |
2.1 Key Highlights of the Report |
2.2 Report Description |
2.3 Market Scope & Segmentation |
2.4 Research Methodology |
2.5 Assumptions |
3 Slovenia Catgut Sutures Market Overview |
3.1 Slovenia Country Macro Economic Indicators |
3.2 Slovenia Catgut Sutures Market Revenues & Volume, 2022 & 2032F |
3.3 Slovenia Catgut Sutures Market - Industry Life Cycle |
3.4 Slovenia Catgut Sutures Market - Porter's Five Forces |
3.5 Slovenia Catgut Sutures Market Revenues & Volume Share, By Type, 2022 & 2032F |
3.6 Slovenia Catgut Sutures Market Revenues & Volume Share, By Raw Material, 2022 & 2032F |
3.7 Slovenia Catgut Sutures Market Revenues & Volume Share, By End User Channel, 2022 & 2032F |
4 Slovenia Catgut Sutures Market Dynamics |
4.1 Impact Analysis |
4.2 Market Drivers |
4.2.1 Increasing number of surgical procedures in Slovenia |
4.2.2 Growing demand for minimally invasive surgeries |
4.2.3 Rise in chronic diseases requiring surgical interventions |
4.3 Market Restraints |
4.3.1 Competition from alternative suture materials such as synthetic absorbable sutures |
4.3.2 Stringent regulatory requirements for medical devices in Slovenia |
5 Slovenia Catgut Sutures Market Trends |
6 Slovenia Catgut Sutures Market Segmentations |
6.1 Slovenia Catgut Sutures Market, By Type |
6.1.1 Overview and Analysis |
6.1.2 Slovenia Catgut Sutures Market Revenues & Volume, By Absorbable Sutures, 2022-2032F |
6.1.3 Slovenia Catgut Sutures Market Revenues & Volume, By Non-absorbable Sutures, 2022-2032F |
6.2 Slovenia Catgut Sutures Market, By Raw Material |
6.2.1 Overview and Analysis |
6.2.2 Slovenia Catgut Sutures Market Revenues & Volume, By Natural, 2022-2032F |
6.2.3 Slovenia Catgut Sutures Market Revenues & Volume, By Synthetic, 2022-2032F |
6.3 Slovenia Catgut Sutures Market, By End User Channel |
6.3.1 Overview and Analysis |
6.3.2 Slovenia Catgut Sutures Market Revenues & Volume, By Hospitals, 2022-2032F |
6.3.3 Slovenia Catgut Sutures Market Revenues & Volume, By Ambulatory Surgical Centers, 2022-2032F |
6.3.4 Slovenia Catgut Sutures Market Revenues & Volume, By Specialty Clinics, 2022-2032F |
7 Slovenia Catgut Sutures Market Import-Export Trade Statistics |
7.1 Slovenia Catgut Sutures Market Export to Major Countries |
7.2 Slovenia Catgut Sutures Market Imports from Major Countries |
8 Slovenia Catgut Sutures Market Key Performance Indicators |
8.1 Average selling price of catgut sutures in Slovenia |
8.2 Adoption rate of catgut sutures in different surgical specialties |
8.3 Number of hospitals and healthcare facilities using catgut sutures |
9 Slovenia Catgut Sutures Market - Opportunity Assessment |
9.1 Slovenia Catgut Sutures Market Opportunity Assessment, By Type, 2022 & 2032F |
9.2 Slovenia Catgut Sutures Market Opportunity Assessment, By Raw Material, 2022 & 2032F |
9.3 Slovenia Catgut Sutures Market Opportunity Assessment, By End User Channel, 2022 & 2032F |
10 Slovenia Catgut Sutures Market - Competitive Landscape |
10.1 Slovenia Catgut Sutures Market Revenue Share, By Companies, 2025 |
10.2 Slovenia Catgut Sutures Market Competitive Benchmarking, By Operating and Technical Parameters |
11 Company Profiles |
12 Recommendations | 13 Disclaimer |
Global Go To Market Strategy - 2030
Export potential enables firms to identify high-growth global markets with greater confidence by combining advanced trade intelligence with a structured quantitative methodology. The framework analyzes emerging demand trends and country-level import patterns while integrating macroeconomic and trade datasets such as GDP and population forecasts, bilateral import–export flows, tariff structures, elasticity differentials between developed and developing economies, geographic distance, and import demand projections. Using weighted trade values from 2020–2024 as the base period to project country-to-country export potential for 2030, these inputs are operationalized through calculated drivers such as gravity model parameters, tariff impact factors, and projected GDP per-capita growth. Through an analysis of hidden potentials, demand hotspots, and market conditions that are most favorable to success, this method enables firms to focus on target countries, maximize returns, and global expansion with data, backed by accuracy.
By factoring in the projected importer demand gap that is currently unmet and could be potential opportunity, it identifies the potential for the Exporter (Country) among 190 countries, against the general trade analysis, which identifies the biggest importer or exporter.
To discover high-growth global markets and optimize your business strategy:
Click Here
Pricing
- Single User License$ 1,995
- Department License$ 2,400
- Site License$ 3,120
- Global License$ 3,795

Leadership Perspectives from Industry Events
Search
Thought Leadership and Analyst Meet


Our Clients
6WResearch In News
- India Export Attractiveness Tracker 2026
- India Air Conditioner Market Set for Strong Rebound in 2026 After Weather-Led Correction and GST-Driven Recovery: 6Wresearch
- ADAS in India: How Automatic Emergency Braking, Blind Spot Detection & Driver Monitoring are Transforming Road Safety
- Doha a strategic location for EV manufacturing hub: IPA Qatar
- Demand for luxury TVs surging in the GCC, says Samsung
- Empowering Growth: The Thriving Journey of Bangladesh’s Cable Industry
Latest Reports
- Nicaragua RPG Gaming Market (2026-2032)
- New Zealand RPG Gaming Market (2026-2032)
- Netherlands RPG Gaming Market (2026-2032)
- Nauru RPG Gaming Market (2026-2032)
- Namibia RPG Gaming Market (2026-2032)
- Mozambique RPG Gaming Market (2026-2032)
- Montenegro RPG Gaming Market (2026-2032)
- Mongolia RPG Gaming Market (2026-2032)
- Monaco RPG Gaming Market (2026-2032)
- Micronesia RPG Gaming Market (2026-2032)
Industry Events and Analyst Meet

EV India Expo 2026

HIMTEX 2026

India Refining Summit 2026

India EV Show 2026

EV tech India Expo 2026
Whitepaper
- Middle East & Africa Commercial Security Market Click here to view more.
- Middle East & Africa Fire Safety Systems & Equipment Market Click here to view more.
- GCC Drone Market Click here to view more.
- Middle East Lighting Fixture Market Click here to view more.
- GCC Physical & Perimeter Security Market Click here to view more.