Slovenia Ceramic Frit Market (2026-2032) | Size, Analysis, Forecast, Value, Companies, Share, Industry, Growth, Revenue, Segmentation, Trends & Outlook
Market Forecast By Type (Alkaline-boron Frit, Strontium-barium Frit, Zinc Frit, Magnesium Frit, Lithium Frit, Zinc Free Calcium Frit, Boron Free Frit), By Application (Glass And Decorative Glass, Abrasives & Refractories, Pottery Wares, Solar Panels, Sanitary Ware, Automotive) And Competitive Landscape
| Product Code: ETC5256128 | Publication Date: Nov 2023 | Updated Date: Apr 2026 | Product Type: Market Research Report | |
| Publisher: 6Wresearch | Author: Ravi Bhandari | No. of Pages: 60 | No. of Figures: 30 | No. of Tables: 5 |
Slovenia Ceramic Frit Market Size (2020-2030)
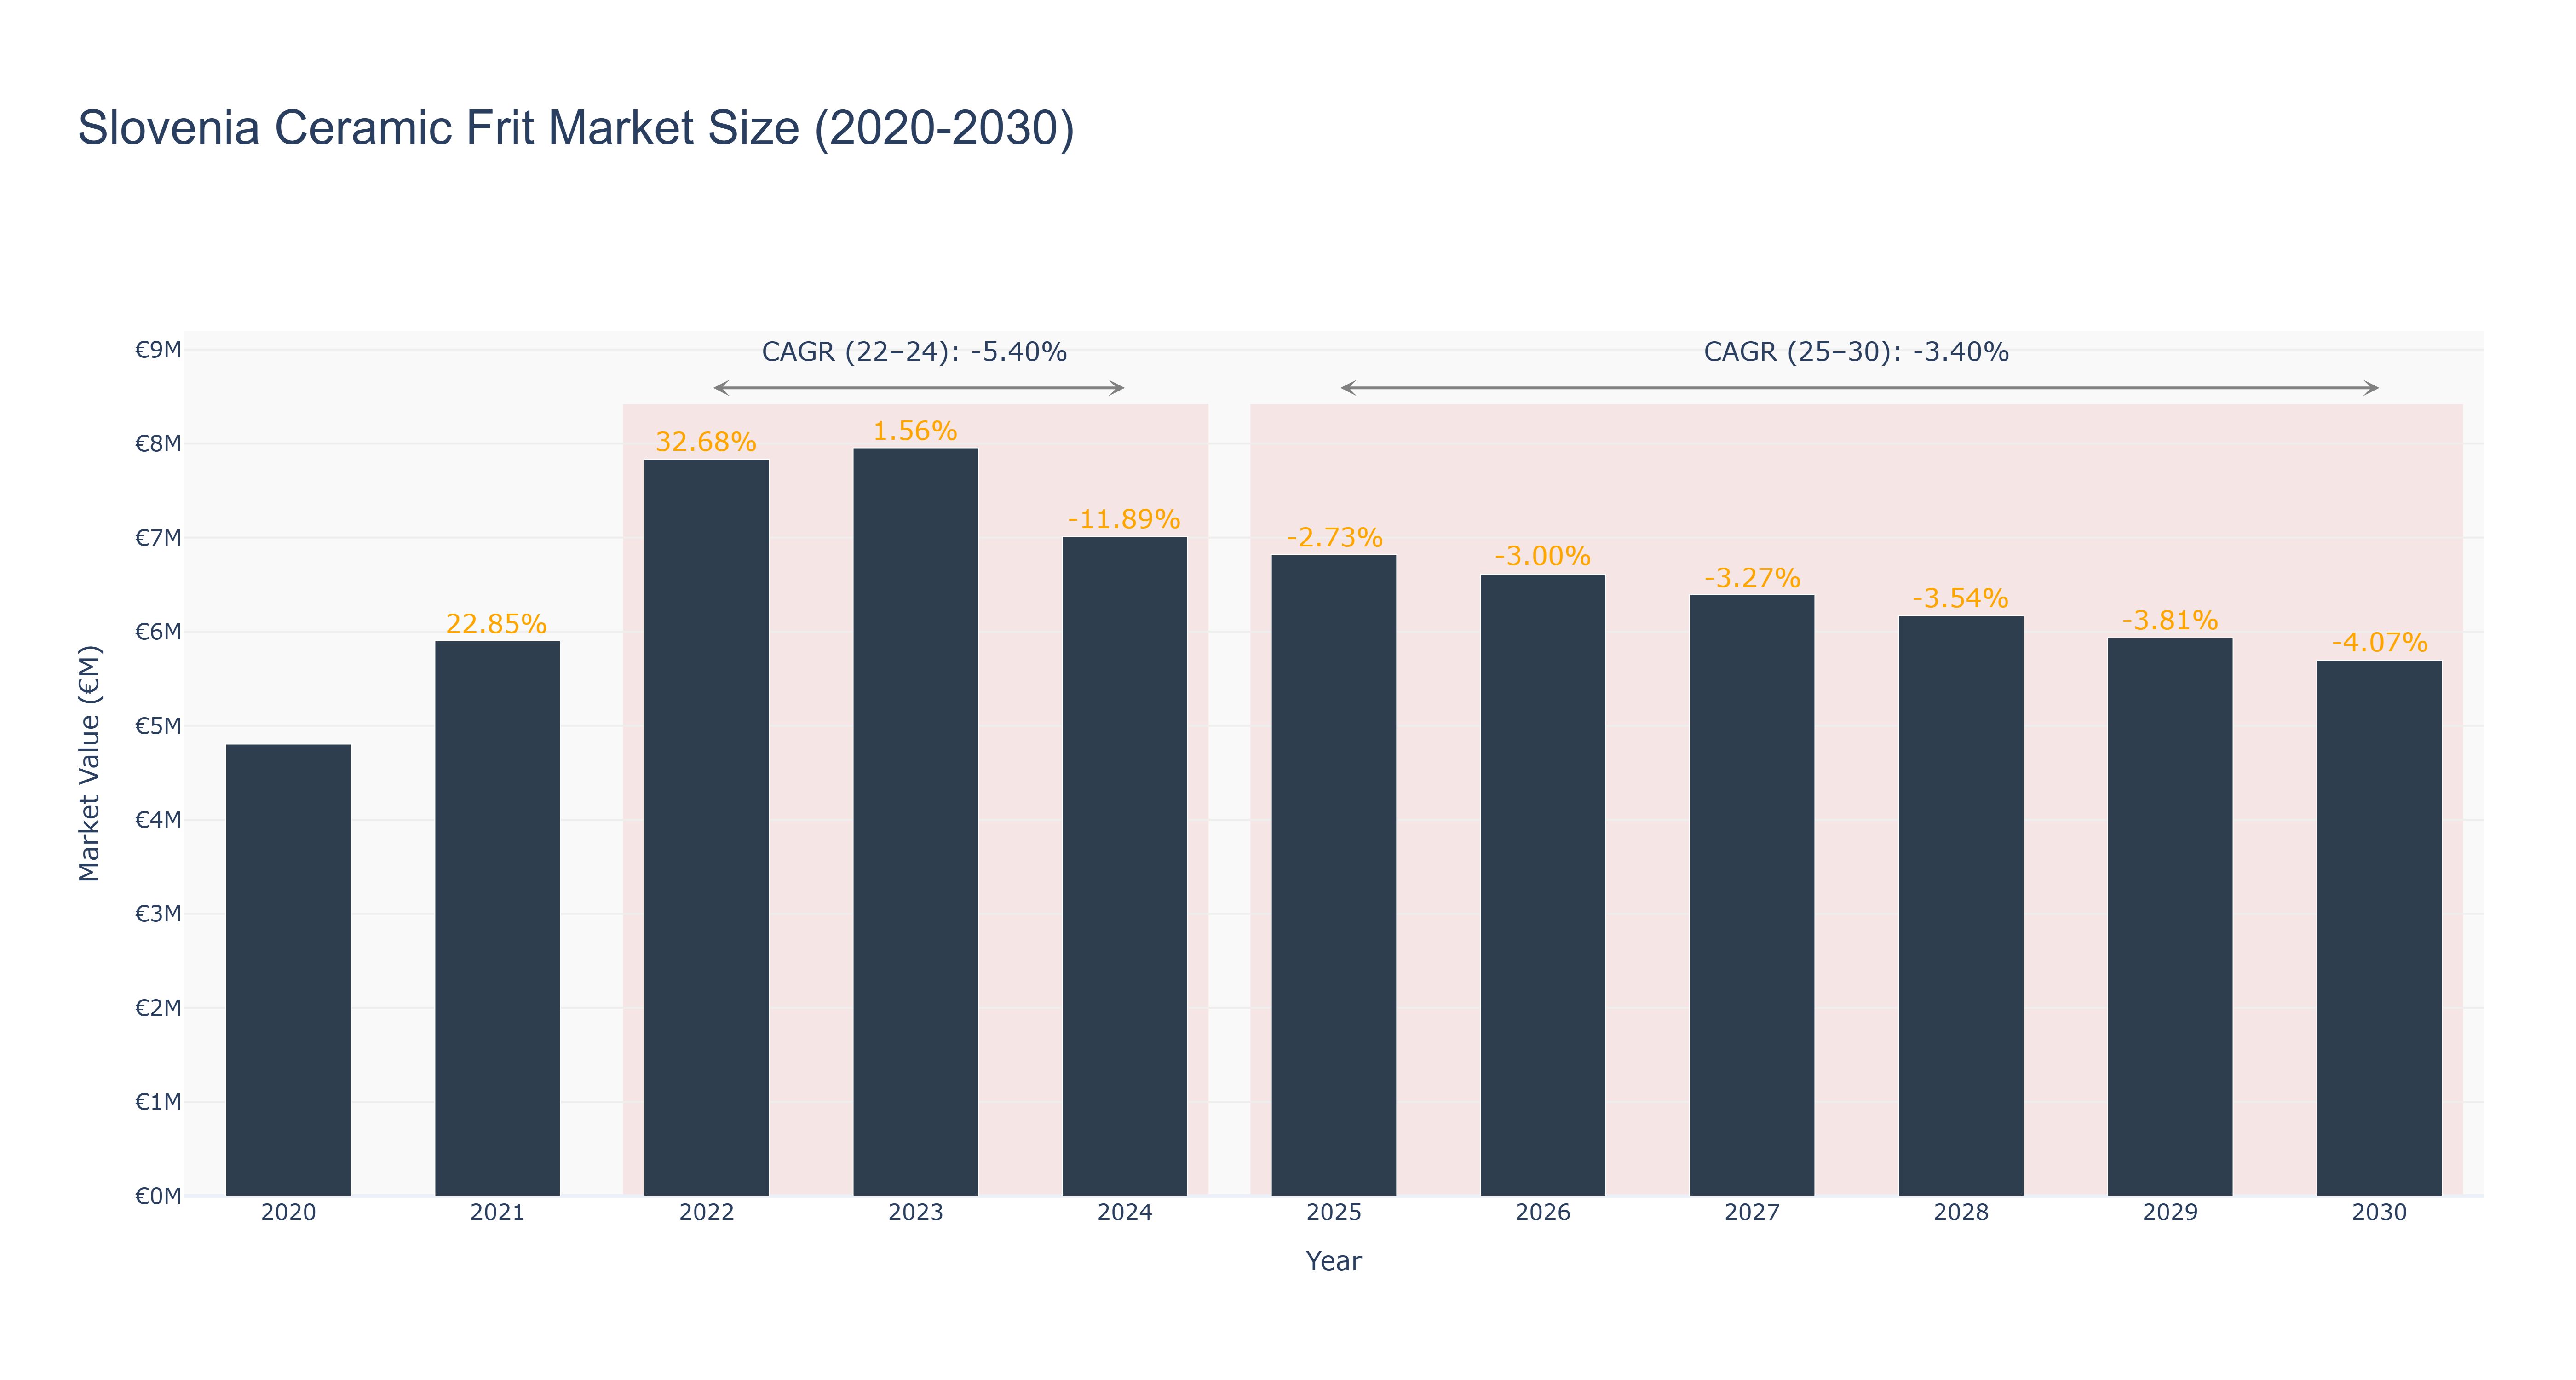
Slovenia Ceramic Frit Market has seen fluctuating trends in recent years. The peak market size was €7.96 million in 2023, followed by a decline to €7.01 million in 2024. The market is forecasted to continue shrinking, reaching €5.69 million in 2030, with a CAGR of -3.404% from 2025 to 2030. The market experienced a significant decline in 2024, attributed to external economic factors impacting consumer demand. The ongoing negative CAGR indicates challenges in market growth, potentially due to increased competition or changing consumer preferences. Despite these challenges, Slovenia is set to embark on a new sustainable ceramic frit production initiative in collaboration with local manufacturers, aiming to enhance product quality and environmental sustainability in the market. Industry drivers for the Slovenia Ceramic Frit Market include technological advancements in production processes, growing demand for eco-friendly materials, and increasing investments in infrastructure projects.
Slovenia Ceramic Frit Market: Production & Trade Performance (2019-2025)
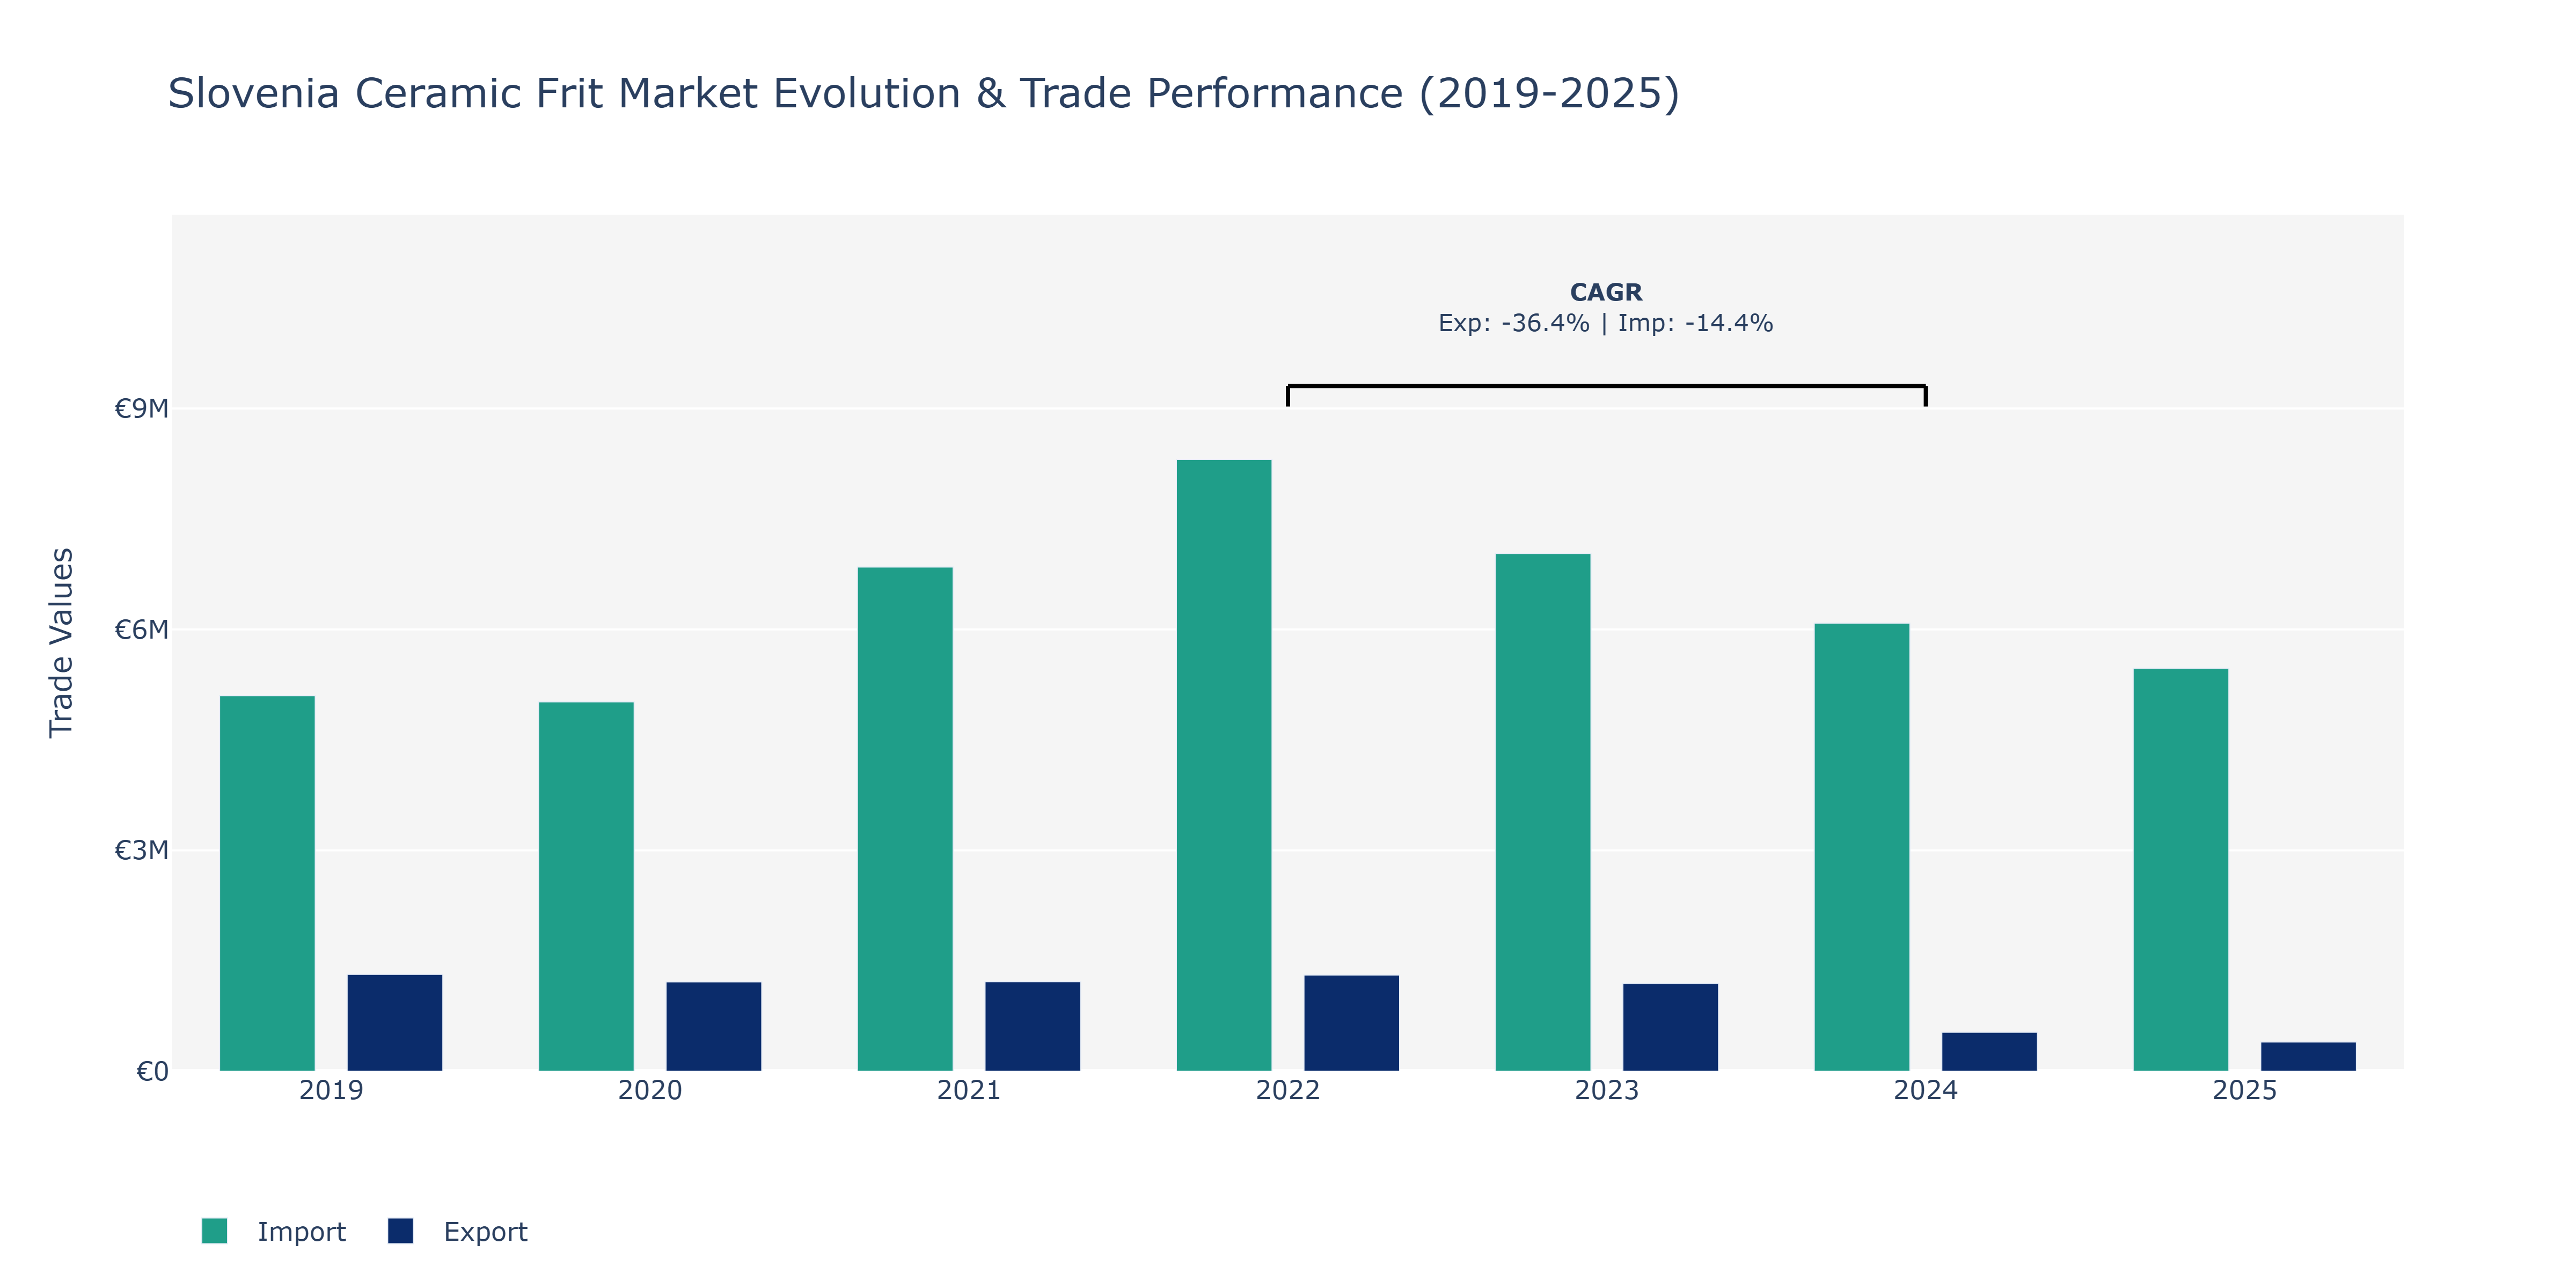
Between 2019 and 2025, Slovenia's Ceramic Frit Market witnessed varying trends in exports and imports. Exports declined from €1.31 million in 2019 to €528.09 thousand in 2024 before experiencing a slight recovery to €397.0 thousand in 2025. On the other hand, imports grew steadily from €5.1 million in 2019 to €6.08 million in 2024, with a slight decrease to €5.47 million in 2025. The peak point for exports was in 2019, while for imports, it was in 2022. The fluctuations in exports can be attributed to shifts in global demand for ceramic frit products, competitive pricing strategies, and market saturation. Meanwhile, the growth in imports reflects Slovenia's increasing reliance on foreign suppliers for raw materials, potentially influenced by changes in trade regulations, quality considerations, or cost efficiencies. The decline in exports in recent years may prompt local manufacturers to explore new markets or enhance product innovation to remain competitive in the global ceramic frit market.
Key Highlights of the Report:
- Slovenia Ceramic Frit Market Outlook
- Market Size of Slovenia Ceramic Frit Market, 2025
- Forecast of Slovenia Ceramic Frit Market, 2032
- Historical Data and Forecast of Slovenia Ceramic Frit Revenues & Volume for the Period 2022-2032F
- Slovenia Ceramic Frit Market Trend Evolution
- Slovenia Ceramic Frit Market Drivers and Challenges
- Slovenia Ceramic Frit Price Trends
- Slovenia Ceramic Frit Porter`s Five Forces
- Slovenia Ceramic Frit Industry Life Cycle
- Historical Data and Forecast of Slovenia Ceramic Frit Market Revenues & Volume By Type for the Period 2022-2032F
- Historical Data and Forecast of Slovenia Ceramic Frit Market Revenues & Volume By Alkaline-boron Frit for the Period 2022-2032F
- Historical Data and Forecast of Slovenia Ceramic Frit Market Revenues & Volume By Strontium-barium Frit for the Period 2022-2032F
- Historical Data and Forecast of Slovenia Ceramic Frit Market Revenues & Volume By Zinc Frit for the Period 2022-2032F
- Historical Data and Forecast of Slovenia Ceramic Frit Market Revenues & Volume By Magnesium Frit for the Period 2022-2032F
- Historical Data and Forecast of Slovenia Ceramic Frit Market Revenues & Volume By Lithium Frit for the Period 2022-2032F
- Historical Data and Forecast of Slovenia Ceramic Frit Market Revenues & Volume By Zinc Free Calcium Frit for the Period 2022-2032F
- Historical Data and Forecast of Slovenia Ceramic Frit Market Revenues & Volume By Boron Free Frit for the Period 2022-2032F
- Historical Data and Forecast of Slovenia Ceramic Frit Market Revenues & Volume By Application for the Period 2022-2032F
- Historical Data and Forecast of Slovenia Ceramic Frit Market Revenues & Volume By Glass And Decorative Glass for the Period 2022-2032F
- Historical Data and Forecast of Slovenia Ceramic Frit Market Revenues & Volume By Abrasives & Refractories for the Period 2022-2032F
- Historical Data and Forecast of Slovenia Ceramic Frit Market Revenues & Volume By Pottery Wares for the Period 2022-2032F
- Historical Data and Forecast of Slovenia Ceramic Frit Market Revenues & Volume By Solar Panels for the Period 2022-2032F
- Historical Data and Forecast of Slovenia Ceramic Frit Market Revenues & Volume By Sanitary Ware for the Period 2022-2032F
- Historical Data and Forecast of Slovenia Ceramic Frit Market Revenues & Volume By Automotive for the Period 2022-2032F
- Slovenia Ceramic Frit Import Export Trade Statistics
- Market Opportunity Assessment By Type
- Market Opportunity Assessment By Application
- Slovenia Ceramic Frit Top Companies Market Share
- Slovenia Ceramic Frit Competitive Benchmarking By Technical and Operational Parameters
- Slovenia Ceramic Frit Company Profiles
- Slovenia Ceramic Frit Key Strategic Recommendations
Frequently Asked Questions About the Market Study (FAQs):
6Wresearch actively monitors the Slovenia Ceramic Frit Market and publishes its comprehensive annual report, highlighting emerging trends, growth drivers, revenue analysis, and forecast outlook. Our insights help businesses to make data-backed strategic decisions with ongoing market dynamics. Our analysts track relevent industries related to the Slovenia Ceramic Frit Market, allowing our clients with actionable intelligence and reliable forecasts tailored to emerging regional needs.
Yes, we provide customisation as per your requirements. To learn more, feel free to contact us on sales@6wresearch.com
1 Executive Summary |
2 Introduction |
2.1 Key Highlights of the Report |
2.2 Report Description |
2.3 Market Scope & Segmentation |
2.4 Research Methodology |
2.5 Assumptions |
3 Slovenia Ceramic Frit Market Overview |
3.1 Slovenia Country Macro Economic Indicators |
3.2 Slovenia Ceramic Frit Market Revenues & Volume, 2022 & 2032F |
3.3 Slovenia Ceramic Frit Market - Industry Life Cycle |
3.4 Slovenia Ceramic Frit Market - Porter's Five Forces |
3.5 Slovenia Ceramic Frit Market Revenues & Volume Share, By Type, 2022 & 2032F |
3.6 Slovenia Ceramic Frit Market Revenues & Volume Share, By Application, 2022 & 2032F |
4 Slovenia Ceramic Frit Market Dynamics |
4.1 Impact Analysis |
4.2 Market Drivers |
4.2.1 Growing demand for ceramic frit in the construction industry in Slovenia |
4.2.2 Increasing adoption of digital printing technology in ceramic frit production |
4.2.3 Favorable government regulations supporting the ceramic industry in Slovenia |
4.3 Market Restraints |
4.3.1 Volatility in raw material prices impacting the production cost of ceramic frit |
4.3.2 Intense competition from international ceramic frit manufacturers |
4.3.3 Fluctuations in the construction industry affecting the demand for ceramic frit |
5 Slovenia Ceramic Frit Market Trends |
6 Slovenia Ceramic Frit Market Segmentations |
6.1 Slovenia Ceramic Frit Market, By Type |
6.1.1 Overview and Analysis |
6.1.2 Slovenia Ceramic Frit Market Revenues & Volume, By Alkaline-boron Frit, 2022-2032F |
6.1.3 Slovenia Ceramic Frit Market Revenues & Volume, By Strontium-barium Frit, 2022-2032F |
6.1.4 Slovenia Ceramic Frit Market Revenues & Volume, By Zinc Frit, 2022-2032F |
6.1.5 Slovenia Ceramic Frit Market Revenues & Volume, By Magnesium Frit, 2022-2032F |
6.1.6 Slovenia Ceramic Frit Market Revenues & Volume, By Lithium Frit, 2022-2032F |
6.1.7 Slovenia Ceramic Frit Market Revenues & Volume, By Zinc Free Calcium Frit, 2022-2032F |
6.2 Slovenia Ceramic Frit Market, By Application |
6.2.1 Overview and Analysis |
6.2.2 Slovenia Ceramic Frit Market Revenues & Volume, By Glass And Decorative Glass, 2022-2032F |
6.2.3 Slovenia Ceramic Frit Market Revenues & Volume, By Abrasives & Refractories, 2022-2032F |
6.2.4 Slovenia Ceramic Frit Market Revenues & Volume, By Pottery Wares, 2022-2032F |
6.2.5 Slovenia Ceramic Frit Market Revenues & Volume, By Solar Panels, 2022-2032F |
6.2.6 Slovenia Ceramic Frit Market Revenues & Volume, By Sanitary Ware, 2022-2032F |
6.2.7 Slovenia Ceramic Frit Market Revenues & Volume, By Automotive, 2022-2032F |
7 Slovenia Ceramic Frit Market Import-Export Trade Statistics |
7.1 Slovenia Ceramic Frit Market Export to Major Countries |
7.2 Slovenia Ceramic Frit Market Imports from Major Countries |
8 Slovenia Ceramic Frit Market Key Performance Indicators |
8.1 Research and development investment in new ceramic frit technologies |
8.2 Rate of adoption of digital printing technology in ceramic frit production |
8.3 Percentage of government incentives allocated to support the ceramic industry in Slovenia |
9 Slovenia Ceramic Frit Market - Opportunity Assessment |
9.1 Slovenia Ceramic Frit Market Opportunity Assessment, By Type, 2022 & 2032F |
9.2 Slovenia Ceramic Frit Market Opportunity Assessment, By Application, 2022 & 2032F |
10 Slovenia Ceramic Frit Market - Competitive Landscape |
10.1 Slovenia Ceramic Frit Market Revenue Share, By Companies, 2025 |
10.2 Slovenia Ceramic Frit Market Competitive Benchmarking, By Operating and Technical Parameters |
11 Company Profiles |
12 Recommendations | 13 Disclaimer |
Global Go To Market Strategy - 2030
Export potential enables firms to identify high-growth global markets with greater confidence by combining advanced trade intelligence with a structured quantitative methodology. The framework analyzes emerging demand trends and country-level import patterns while integrating macroeconomic and trade datasets such as GDP and population forecasts, bilateral import–export flows, tariff structures, elasticity differentials between developed and developing economies, geographic distance, and import demand projections. Using weighted trade values from 2020–2024 as the base period to project country-to-country export potential for 2030, these inputs are operationalized through calculated drivers such as gravity model parameters, tariff impact factors, and projected GDP per-capita growth. Through an analysis of hidden potentials, demand hotspots, and market conditions that are most favorable to success, this method enables firms to focus on target countries, maximize returns, and global expansion with data, backed by accuracy.
By factoring in the projected importer demand gap that is currently unmet and could be potential opportunity, it identifies the potential for the Exporter (Country) among 190 countries, against the general trade analysis, which identifies the biggest importer or exporter.
To discover high-growth global markets and optimize your business strategy:
Click Here
Pricing
- Single User License$ 1,995
- Department License$ 2,400
- Site License$ 3,120
- Global License$ 3,795

Leadership Perspectives from Industry Events
Search
Thought Leadership and Analyst Meet


Our Clients
6WResearch In News
- India Export Attractiveness Tracker 2026
- India Air Conditioner Market Set for Strong Rebound in 2026 After Weather-Led Correction and GST-Driven Recovery: 6Wresearch
- ADAS in India: How Automatic Emergency Braking, Blind Spot Detection & Driver Monitoring are Transforming Road Safety
- Doha a strategic location for EV manufacturing hub: IPA Qatar
- Demand for luxury TVs surging in the GCC, says Samsung
- Empowering Growth: The Thriving Journey of Bangladesh’s Cable Industry
Latest Reports
- Nicaragua RPG Gaming Market (2026-2032)
- New Zealand RPG Gaming Market (2026-2032)
- Netherlands RPG Gaming Market (2026-2032)
- Nauru RPG Gaming Market (2026-2032)
- Namibia RPG Gaming Market (2026-2032)
- Mozambique RPG Gaming Market (2026-2032)
- Montenegro RPG Gaming Market (2026-2032)
- Mongolia RPG Gaming Market (2026-2032)
- Monaco RPG Gaming Market (2026-2032)
- Micronesia RPG Gaming Market (2026-2032)
Industry Events and Analyst Meet

EV India Expo 2026

HIMTEX 2026

India Refining Summit 2026

India EV Show 2026

EV tech India Expo 2026
Whitepaper
- Middle East & Africa Commercial Security Market Click here to view more.
- Middle East & Africa Fire Safety Systems & Equipment Market Click here to view more.
- GCC Drone Market Click here to view more.
- Middle East Lighting Fixture Market Click here to view more.
- GCC Physical & Perimeter Security Market Click here to view more.