Slovenia Ceramic Wash Basin Market (2026-2032) | Outlook, Value, Segmentation, Revenue, Forecast, Analysis, Companies, Share, Growth, Industry, Size & Trends
Market Forecast By Type (Full-pedestal Wash Basin, Table-top Wash Basin, Wall-mounted Wash Basin, Wall-hung Wash Basin), By End-use (Residential, Commercial), By Distribution Channel (Online Channel, Offline Channel) And Competitive Landscape
| Product Code: ETC4972040 | Publication Date: Nov 2023 | Updated Date: Apr 2026 | Product Type: Market Research Report | |
| Publisher: 6Wresearch | Author: Shubham Padhi | No. of Pages: 60 | No. of Figures: 30 | No. of Tables: 5 |
Slovenia Ceramic Wash Basin Market Size (2020-2030)
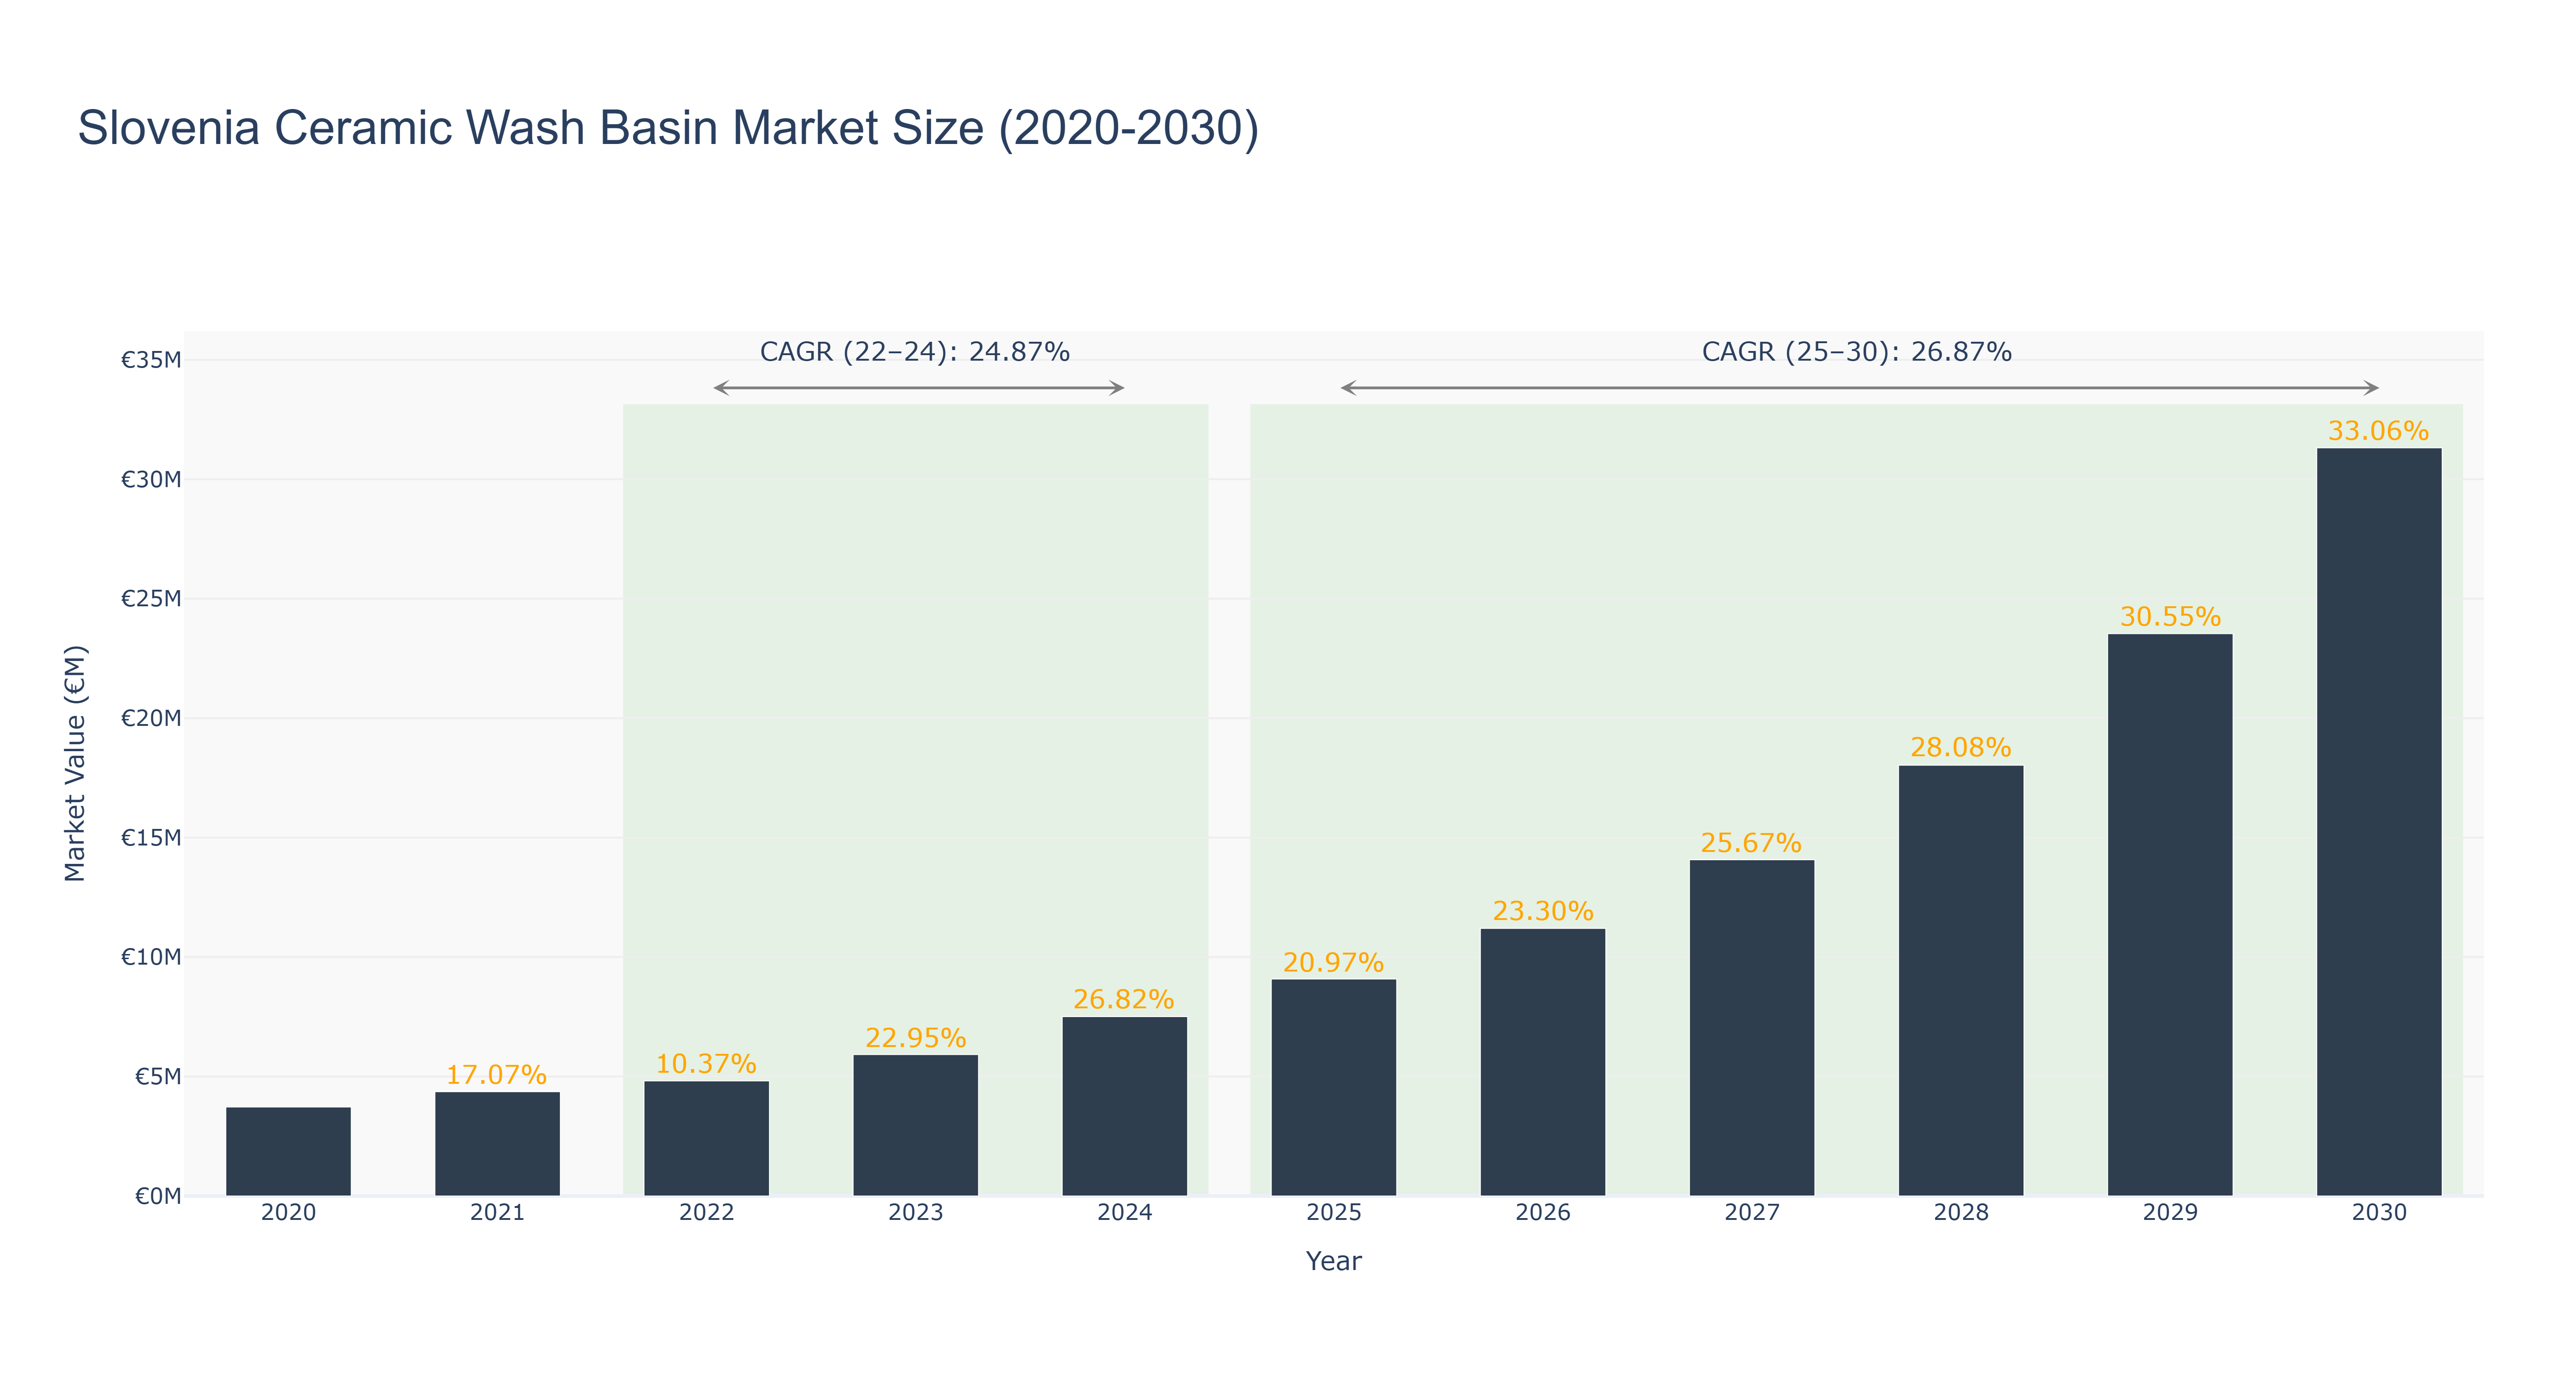
The Slovenia Ceramic Wash Basin Market has demonstrated robust growth, with the market size reaching €5.92 million in 2023, reflecting a notable increase of 22.95% from the previous year. Over the actual period from 2022 to 2024, the market is projected to grow at a compound annual growth rate (CAGR) of 24.87%, driven by rising urbanization, increased consumer spending on home improvement, and a growing preference for aesthetically pleasing bathroom fixtures. Looking ahead, the forecasted period from 2025 to 2030 anticipates a continued upward trajectory, with the market size expected to expand to €31.32 million by 2030, achieving a CAGR of 26.87%. This growth will likely be supported by ongoing infrastructure developments and an increasing focus on sustainable and innovative design in the ceramic wash basin segment. Overall, the Slovenia market is poised for significant expansion, reflecting broader trends in consumer behavior and construction activities.
Slovenia Ceramic Wash Basin Market: Production & Trade Performance (2019-2025)
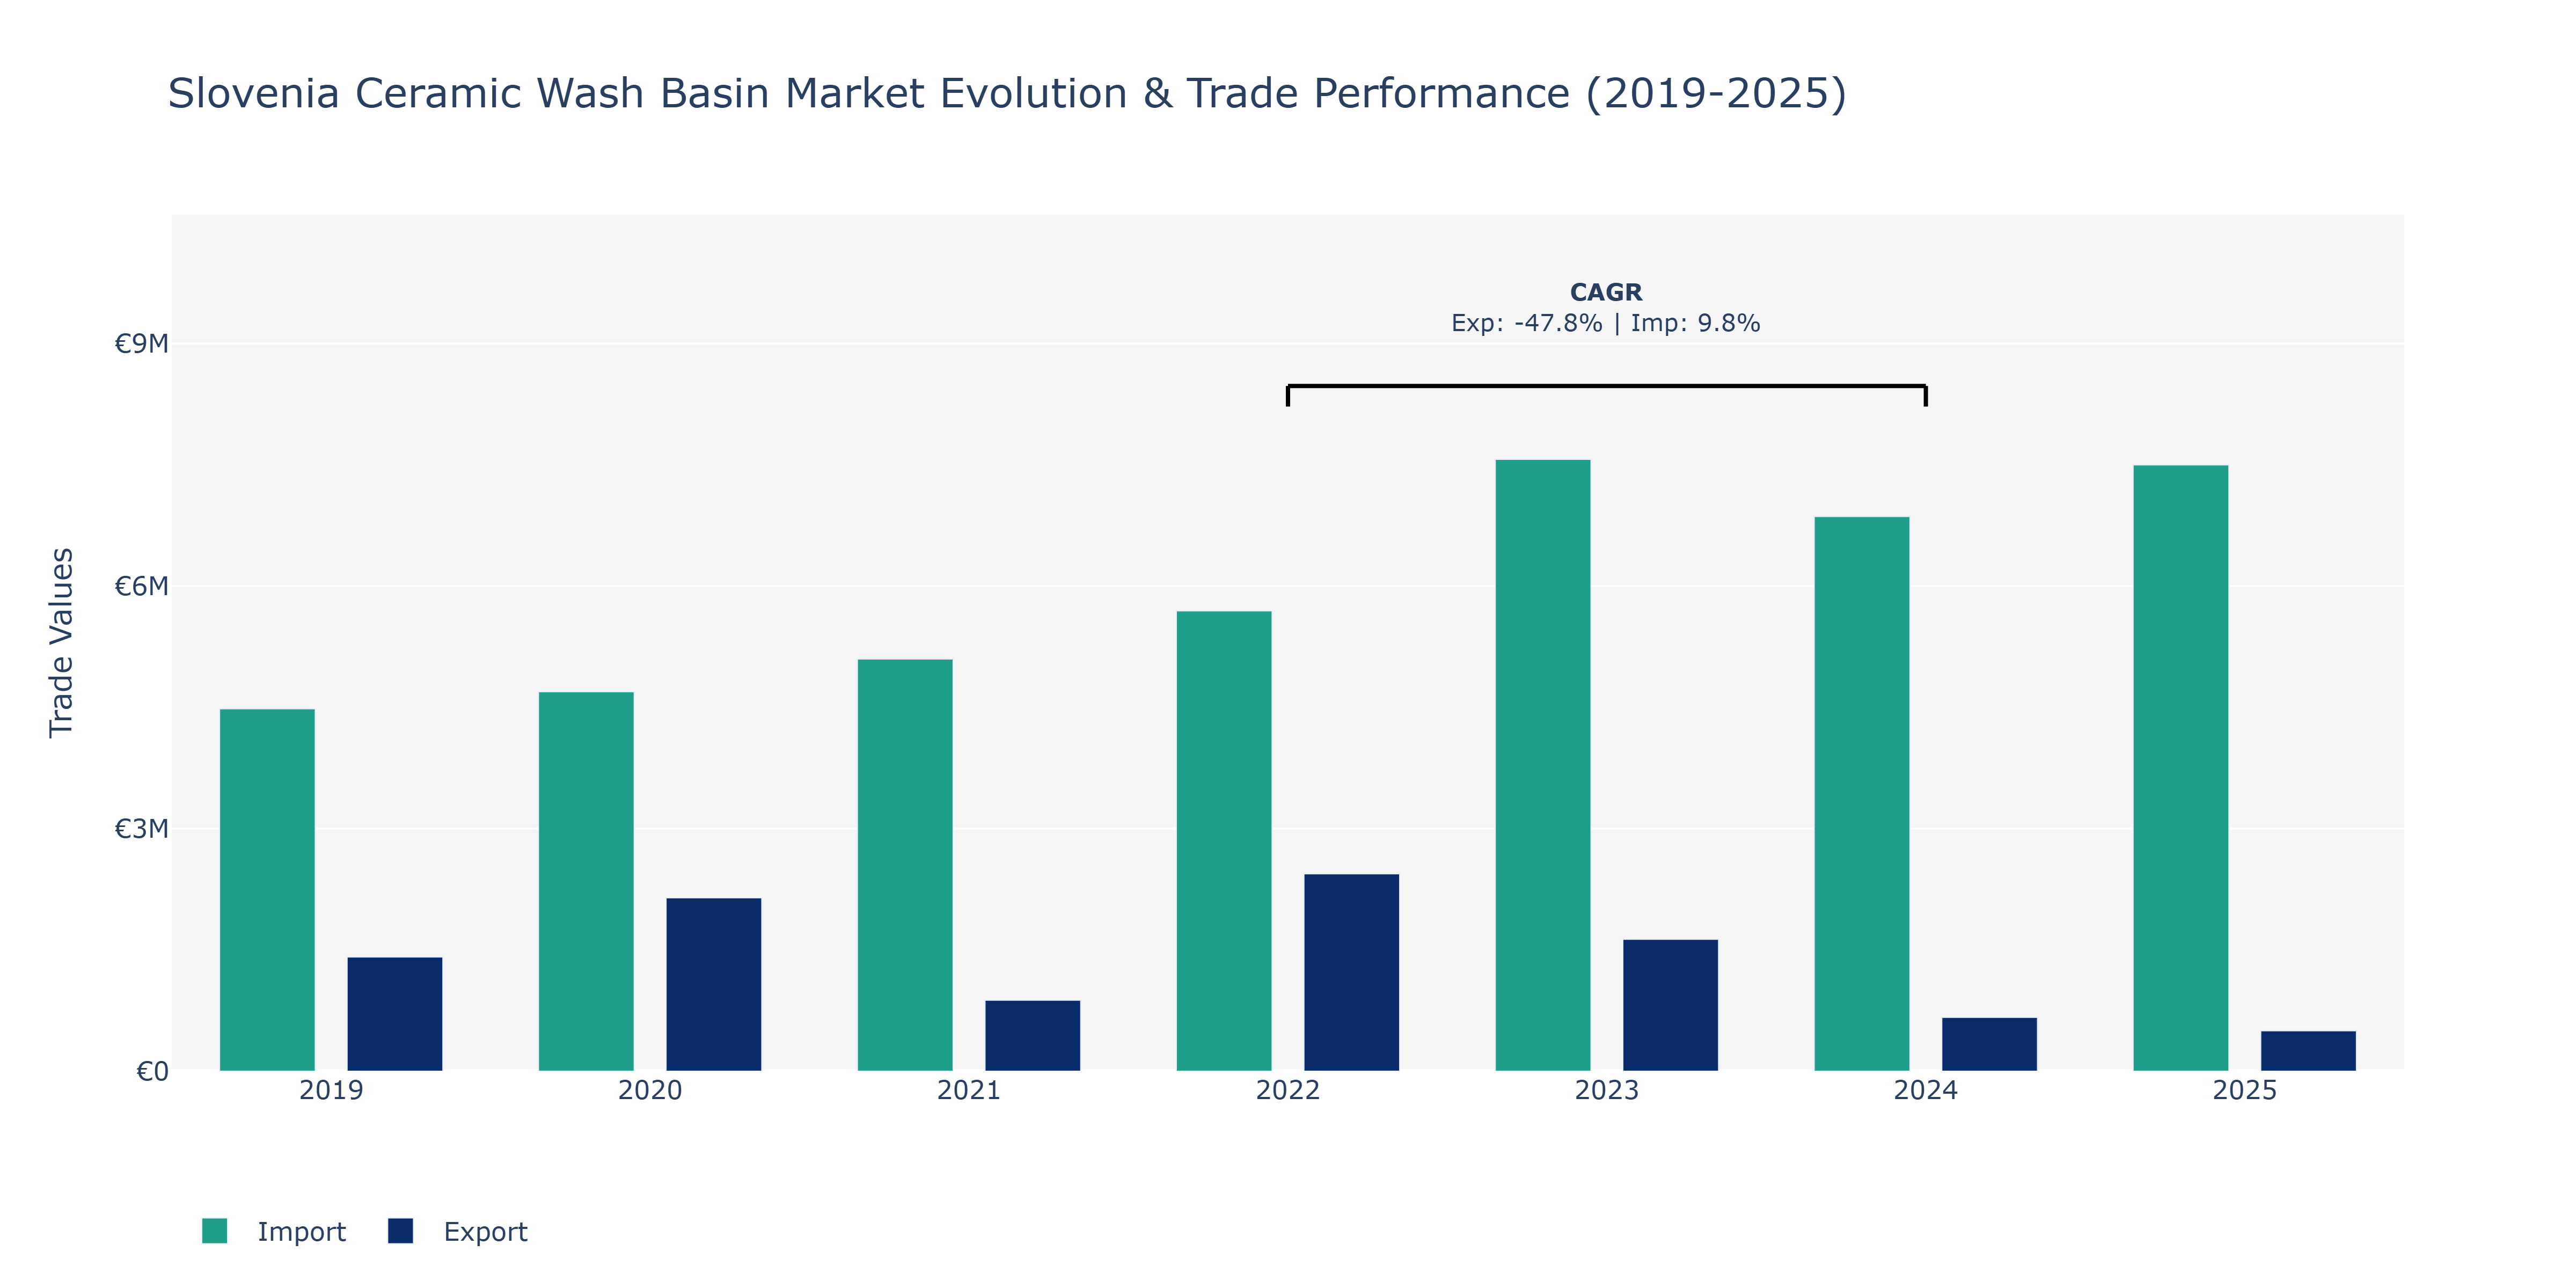
Between 2019 and 2025, Slovenia's Ceramic Wash Basin Market witnessed noteworthy fluctuations in exports and imports. Despite a peak in 2022, exports experienced a noticeable decline in subsequent years, reaching €500.14 thousand in 2025. Conversely, imports consistently increased, culminating in €7.5 million in 2025. The surge in imports can be attributed to the growing demand for ceramic wash basins in Slovenia, potentially driven by factors such as urbanization, rising disposable incomes, and evolving consumer preferences favoring modern bathroom fixtures. On the other hand, the drop in exports could be influenced by intensified competition from international ceramic basin manufacturers offering competitive pricing and innovative designs, prompting local exporters to recalibrate their strategies to remain competitive in the global market landscape. Such shifts highlight the need for domestic manufacturers to focus on product differentiation, quality enhancement, and international marketing efforts to sustain and expand their market share amidst increasing import volumes.
Key Highlights of the Report:
- Slovenia Ceramic Wash Basin Market Outlook
- Market Size of Slovenia Ceramic Wash Basin Market, 2025
- Forecast of Slovenia Ceramic Wash Basin Market, 2032
- Historical Data and Forecast of Slovenia Ceramic Wash Basin Revenues & Volume for the Period 2022-2032F
- Slovenia Ceramic Wash Basin Market Trend Evolution
- Slovenia Ceramic Wash Basin Market Drivers and Challenges
- Slovenia Ceramic Wash Basin Price Trends
- Slovenia Ceramic Wash Basin Porter`s Five Forces
- Slovenia Ceramic Wash Basin Industry Life Cycle
- Historical Data and Forecast of Slovenia Ceramic Wash Basin Market Revenues & Volume By Type for the Period 2022-2032F
- Historical Data and Forecast of Slovenia Ceramic Wash Basin Market Revenues & Volume By Full-pedestal Wash Basin for the Period 2022-2032F
- Historical Data and Forecast of Slovenia Ceramic Wash Basin Market Revenues & Volume By Table-top Wash Basin for the Period 2022-2032F
- Historical Data and Forecast of Slovenia Ceramic Wash Basin Market Revenues & Volume By Wall-mounted Wash Basin for the Period 2022-2032F
- Historical Data and Forecast of Slovenia Ceramic Wash Basin Market Revenues & Volume By Wall-hung Wash Basin for the Period 2022-2032F
- Historical Data and Forecast of Slovenia Ceramic Wash Basin Market Revenues & Volume By End-use for the Period 2022-2032F
- Historical Data and Forecast of Slovenia Ceramic Wash Basin Market Revenues & Volume By Residential for the Period 2022-2032F
- Historical Data and Forecast of Slovenia Ceramic Wash Basin Market Revenues & Volume By Commercial for the Period 2022-2032F
- Historical Data and Forecast of Slovenia Ceramic Wash Basin Market Revenues & Volume By Distribution Channel for the Period 2022-2032F
- Historical Data and Forecast of Slovenia Ceramic Wash Basin Market Revenues & Volume By Online Channel for the Period 2022-2032F
- Historical Data and Forecast of Slovenia Ceramic Wash Basin Market Revenues & Volume By Offline Channel for the Period 2022-2032F
- Slovenia Ceramic Wash Basin Import Export Trade Statistics
- Market Opportunity Assessment By Type
- Market Opportunity Assessment By End-use
- Market Opportunity Assessment By Distribution Channel
- Slovenia Ceramic Wash Basin Top Companies Market Share
- Slovenia Ceramic Wash Basin Competitive Benchmarking By Technical and Operational Parameters
- Slovenia Ceramic Wash Basin Company Profiles
- Slovenia Ceramic Wash Basin Key Strategic Recommendations
Frequently Asked Questions About the Market Study (FAQs):
6Wresearch actively monitors the Slovenia Ceramic Wash Basin Market and publishes its comprehensive annual report, highlighting emerging trends, growth drivers, revenue analysis, and forecast outlook. Our insights help businesses to make data-backed strategic decisions with ongoing market dynamics. Our analysts track relevent industries related to the Slovenia Ceramic Wash Basin Market, allowing our clients with actionable intelligence and reliable forecasts tailored to emerging regional needs.
Yes, we provide customisation as per your requirements. To learn more, feel free to contact us on sales@6wresearch.com
1 Executive Summary |
2 Introduction |
2.1 Key Highlights of the Report |
2.2 Report Description |
2.3 Market Scope & Segmentation |
2.4 Research Methodology |
2.5 Assumptions |
3 Slovenia Ceramic Wash Basin Market Overview |
3.1 Slovenia Country Macro Economic Indicators |
3.2 Slovenia Ceramic Wash Basin Market Revenues & Volume, 2022 & 2032F |
3.3 Slovenia Ceramic Wash Basin Market - Industry Life Cycle |
3.4 Slovenia Ceramic Wash Basin Market - Porter's Five Forces |
3.5 Slovenia Ceramic Wash Basin Market Revenues & Volume Share, By Type, 2022 & 2032F |
3.6 Slovenia Ceramic Wash Basin Market Revenues & Volume Share, By End-use, 2022 & 2032F |
3.7 Slovenia Ceramic Wash Basin Market Revenues & Volume Share, By Distribution Channel, 2022 & 2032F |
4 Slovenia Ceramic Wash Basin Market Dynamics |
4.1 Impact Analysis |
4.2 Market Drivers |
4.2.1 Growing demand for modern and stylish bathroom fixtures |
4.2.2 Increasing focus on home renovations and interior decoration |
4.2.3 Rising disposable income leading to higher spending on premium bathroom products |
4.3 Market Restraints |
4.3.1 Intense competition from alternative materials like stainless steel and glass |
4.3.2 Price volatility of raw materials impacting production costs |
4.3.3 Economic uncertainty affecting consumer purchasing power |
5 Slovenia Ceramic Wash Basin Market Trends |
6 Slovenia Ceramic Wash Basin Market Segmentations |
6.1 Slovenia Ceramic Wash Basin Market, By Type |
6.1.1 Overview and Analysis |
6.1.2 Slovenia Ceramic Wash Basin Market Revenues & Volume, By Full-pedestal Wash Basin, 2022-2032F |
6.1.3 Slovenia Ceramic Wash Basin Market Revenues & Volume, By Table-top Wash Basin, 2022-2032F |
6.1.4 Slovenia Ceramic Wash Basin Market Revenues & Volume, By Wall-mounted Wash Basin, 2022-2032F |
6.1.5 Slovenia Ceramic Wash Basin Market Revenues & Volume, By Wall-hung Wash Basin, 2022-2032F |
6.2 Slovenia Ceramic Wash Basin Market, By End-use |
6.2.1 Overview and Analysis |
6.2.2 Slovenia Ceramic Wash Basin Market Revenues & Volume, By Residential, 2022-2032F |
6.2.3 Slovenia Ceramic Wash Basin Market Revenues & Volume, By Commercial, 2022-2032F |
6.3 Slovenia Ceramic Wash Basin Market, By Distribution Channel |
6.3.1 Overview and Analysis |
6.3.2 Slovenia Ceramic Wash Basin Market Revenues & Volume, By Online Channel, 2022-2032F |
6.3.3 Slovenia Ceramic Wash Basin Market Revenues & Volume, By Offline Channel, 2022-2032F |
7 Slovenia Ceramic Wash Basin Market Import-Export Trade Statistics |
7.1 Slovenia Ceramic Wash Basin Market Export to Major Countries |
7.2 Slovenia Ceramic Wash Basin Market Imports from Major Countries |
8 Slovenia Ceramic Wash Basin Market Key Performance Indicators |
8.1 Number of new residential construction projects |
8.2 Consumer sentiment index towards home improvement |
8.3 Number of interior design exhibitions and events attended by industry players |
9 Slovenia Ceramic Wash Basin Market - Opportunity Assessment |
9.1 Slovenia Ceramic Wash Basin Market Opportunity Assessment, By Type, 2022 & 2032F |
9.2 Slovenia Ceramic Wash Basin Market Opportunity Assessment, By End-use, 2022 & 2032F |
9.3 Slovenia Ceramic Wash Basin Market Opportunity Assessment, By Distribution Channel, 2022 & 2032F |
10 Slovenia Ceramic Wash Basin Market - Competitive Landscape |
10.1 Slovenia Ceramic Wash Basin Market Revenue Share, By Companies, 2025 |
10.2 Slovenia Ceramic Wash Basin Market Competitive Benchmarking, By Operating and Technical Parameters |
11 Company Profiles |
12 Recommendations | 13 Disclaimer |
Global Go To Market Strategy - 2030
Export potential enables firms to identify high-growth global markets with greater confidence by combining advanced trade intelligence with a structured quantitative methodology. The framework analyzes emerging demand trends and country-level import patterns while integrating macroeconomic and trade datasets such as GDP and population forecasts, bilateral import–export flows, tariff structures, elasticity differentials between developed and developing economies, geographic distance, and import demand projections. Using weighted trade values from 2020–2024 as the base period to project country-to-country export potential for 2030, these inputs are operationalized through calculated drivers such as gravity model parameters, tariff impact factors, and projected GDP per-capita growth. Through an analysis of hidden potentials, demand hotspots, and market conditions that are most favorable to success, this method enables firms to focus on target countries, maximize returns, and global expansion with data, backed by accuracy.
By factoring in the projected importer demand gap that is currently unmet and could be potential opportunity, it identifies the potential for the Exporter (Country) among 190 countries, against the general trade analysis, which identifies the biggest importer or exporter.
To discover high-growth global markets and optimize your business strategy:
Click Here
Pricing
- Single User License$ 1,995
- Department License$ 2,400
- Site License$ 3,120
- Global License$ 3,795

Leadership Perspectives from Industry Events
Search
Thought Leadership and Analyst Meet


Our Clients
6WResearch In News
- India Export Attractiveness Tracker 2026
- India Air Conditioner Market Set for Strong Rebound in 2026 After Weather-Led Correction and GST-Driven Recovery: 6Wresearch
- ADAS in India: How Automatic Emergency Braking, Blind Spot Detection & Driver Monitoring are Transforming Road Safety
- Doha a strategic location for EV manufacturing hub: IPA Qatar
- Demand for luxury TVs surging in the GCC, says Samsung
- Empowering Growth: The Thriving Journey of Bangladesh’s Cable Industry
Latest Reports
- Nicaragua RPG Gaming Market (2026-2032)
- New Zealand RPG Gaming Market (2026-2032)
- Netherlands RPG Gaming Market (2026-2032)
- Nauru RPG Gaming Market (2026-2032)
- Namibia RPG Gaming Market (2026-2032)
- Mozambique RPG Gaming Market (2026-2032)
- Montenegro RPG Gaming Market (2026-2032)
- Mongolia RPG Gaming Market (2026-2032)
- Monaco RPG Gaming Market (2026-2032)
- Micronesia RPG Gaming Market (2026-2032)
Industry Events and Analyst Meet

EV India Expo 2026

HIMTEX 2026

India Refining Summit 2026

India EV Show 2026

EV tech India Expo 2026
Whitepaper
- Middle East & Africa Commercial Security Market Click here to view more.
- Middle East & Africa Fire Safety Systems & Equipment Market Click here to view more.
- GCC Drone Market Click here to view more.
- Middle East Lighting Fixture Market Click here to view more.
- GCC Physical & Perimeter Security Market Click here to view more.