Slovenia DDGS Feed Market (2026-2032) | Revenue, Growth, Forecast, Value, Analysis, Outlook, Size, Trends, Share, Companies, Industry & Segmentation
Market Forecast By Type (Corn, Wheat, Rice, Amino Acids, Blended Grains, Other Type), By Animal Type (Dairy Cattle, Beef Cattle, Swine, Poultry, Other Animal Type) And Competitive Landscape
| Product Code: ETC5347898 | Publication Date: Nov 2023 | Updated Date: Apr 2026 | Product Type: Market Research Report | |
| Publisher: 6Wresearch | Author: Ravi Bhandari | No. of Pages: 60 | No. of Figures: 30 | No. of Tables: 5 |
Slovenia Ddgs Feed Market Size (2020-2030)
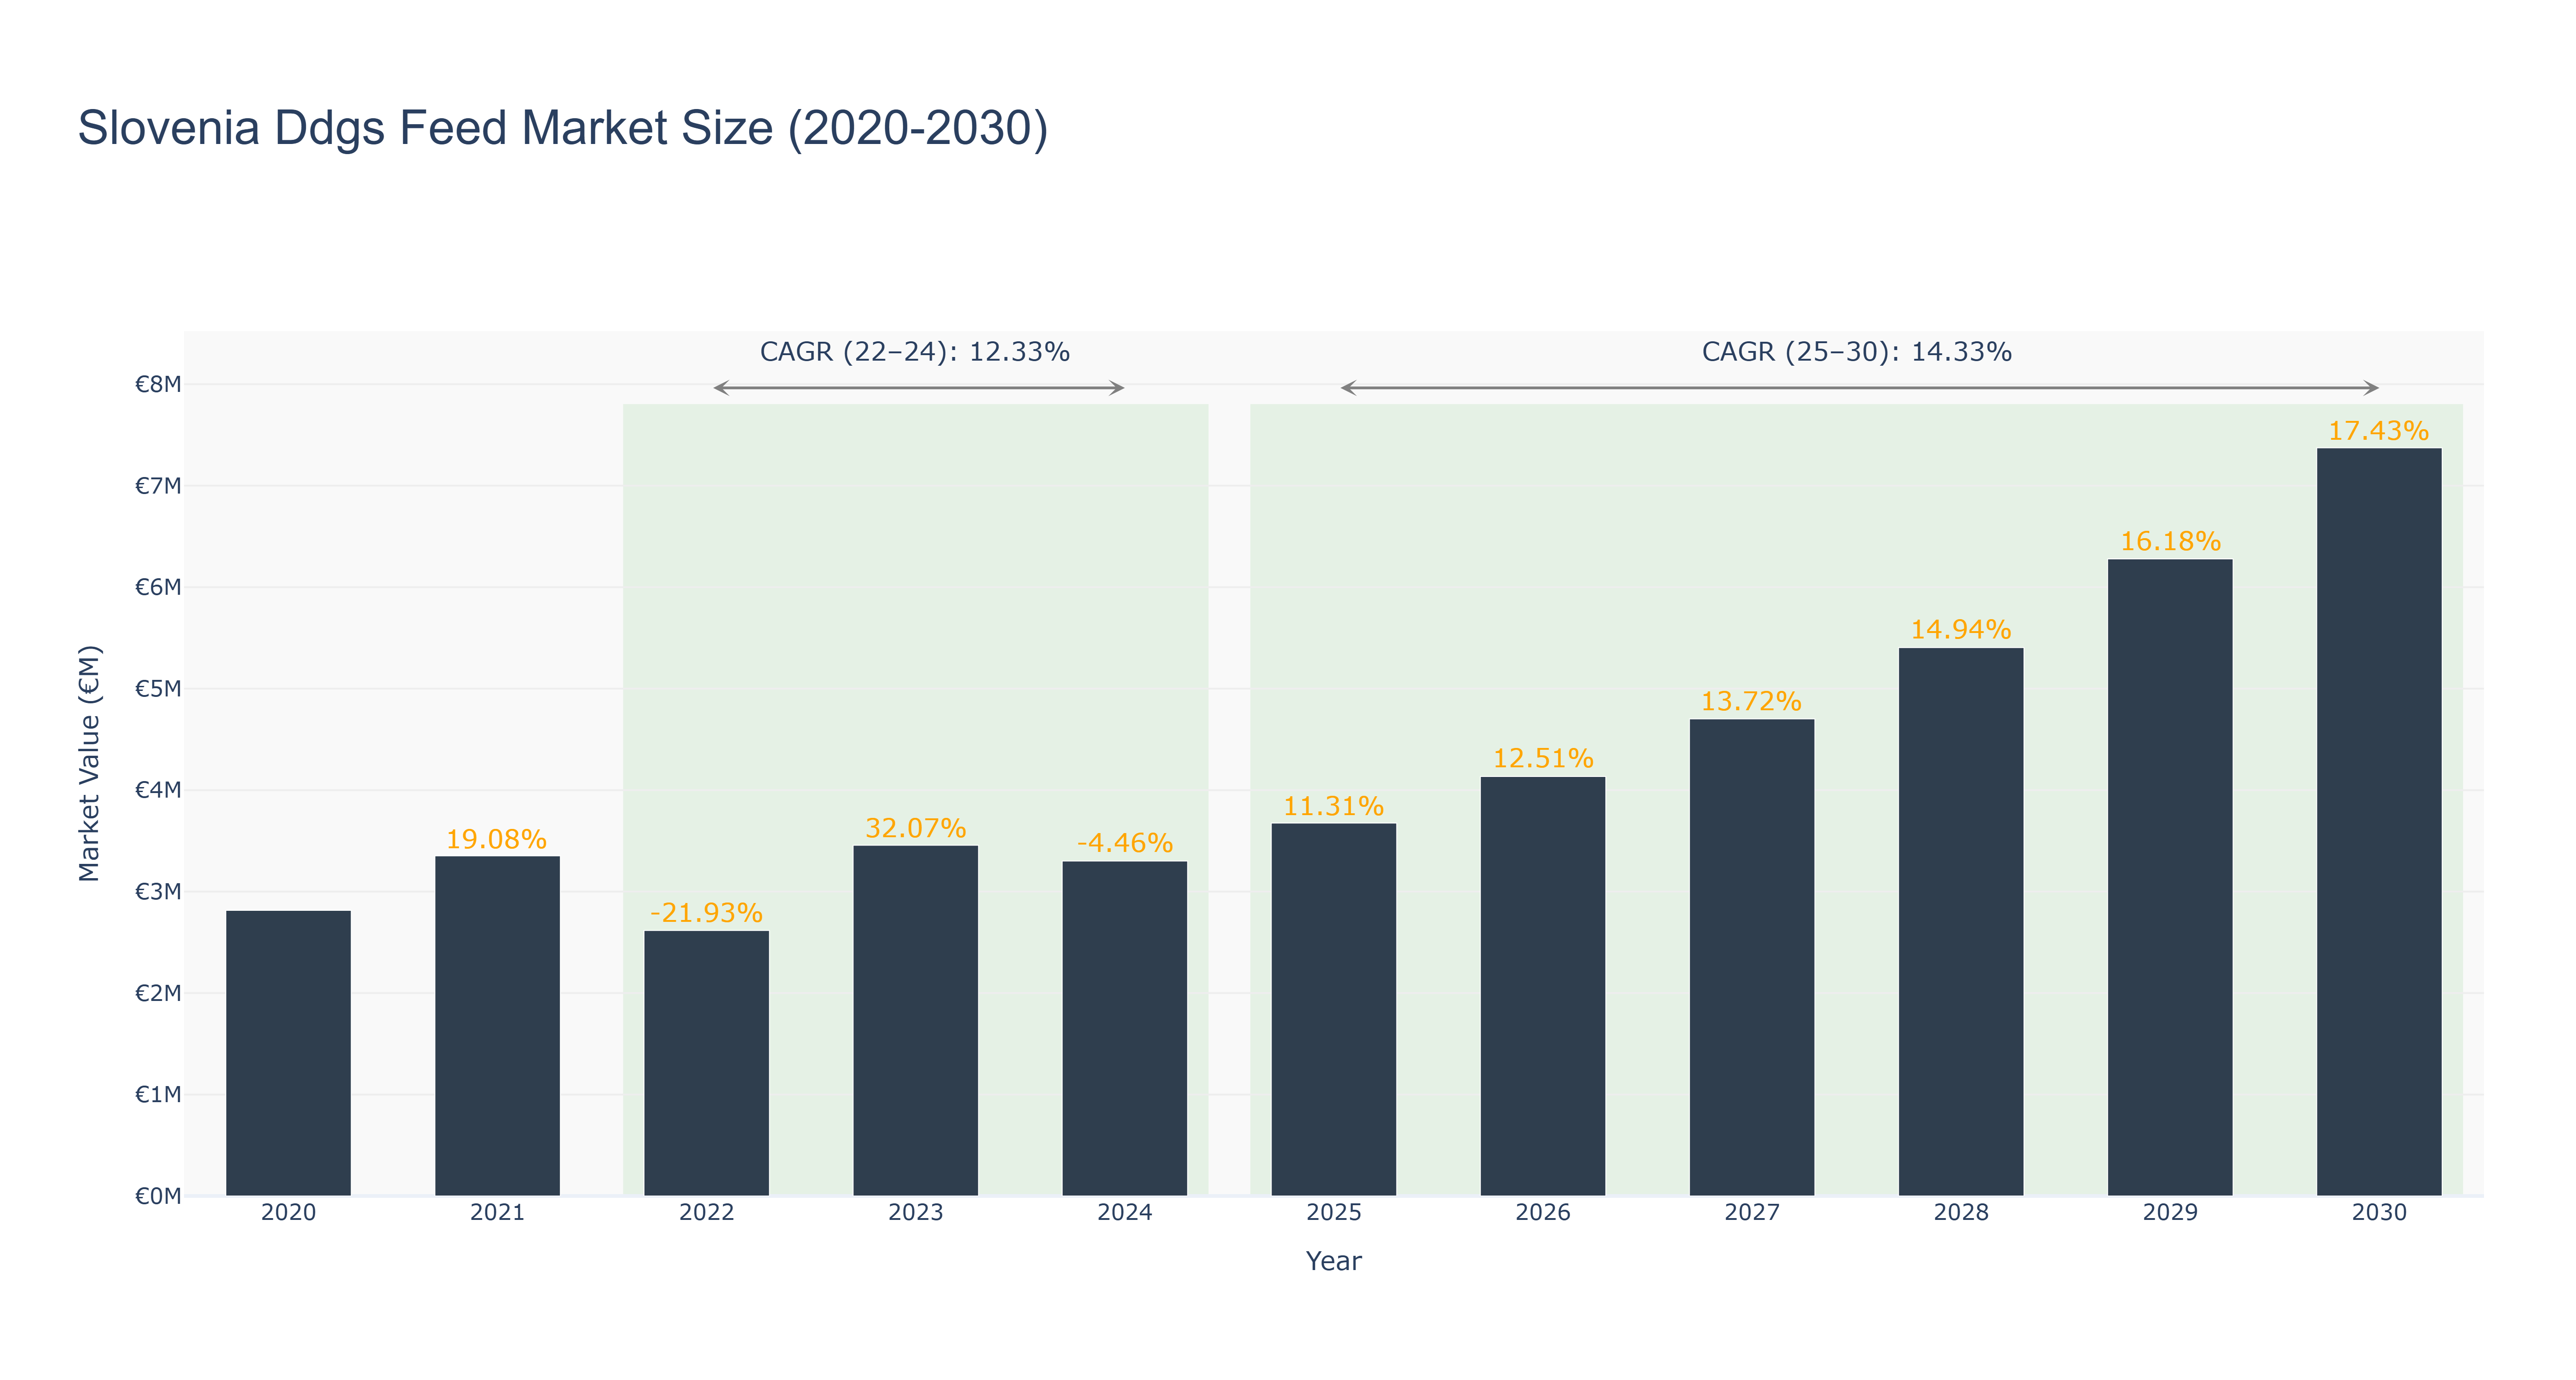
Slovenia Ddgs Feed Market has shown a fluctuating trend over the years. The peak market size of €7.37 million is forecasted for 2030, with steady growth observed from 2020 to 2029. The actual market size declined from €2.81 million in 2020 to €3.30 million in 2024, attributed to a negative growth rate in 2022 and 2024. However, a significant recovery and growth are projected from 2025 to 2030, with a Compound Annual Growth Rate (CAGR) of 14.33% expected during this period. The market's growth can be attributed to increasing demand for Ddgs feed products in the livestock industry, driven by the focus on sustainable and cost-effective animal feed solutions. Looking ahead, Slovenia is set to introduce new regulations promoting eco-friendly feed production practices, further boosting market growth in the coming years.
Slovenia Ddgs Feed Market: Production & Trade Performance (2019-2025)
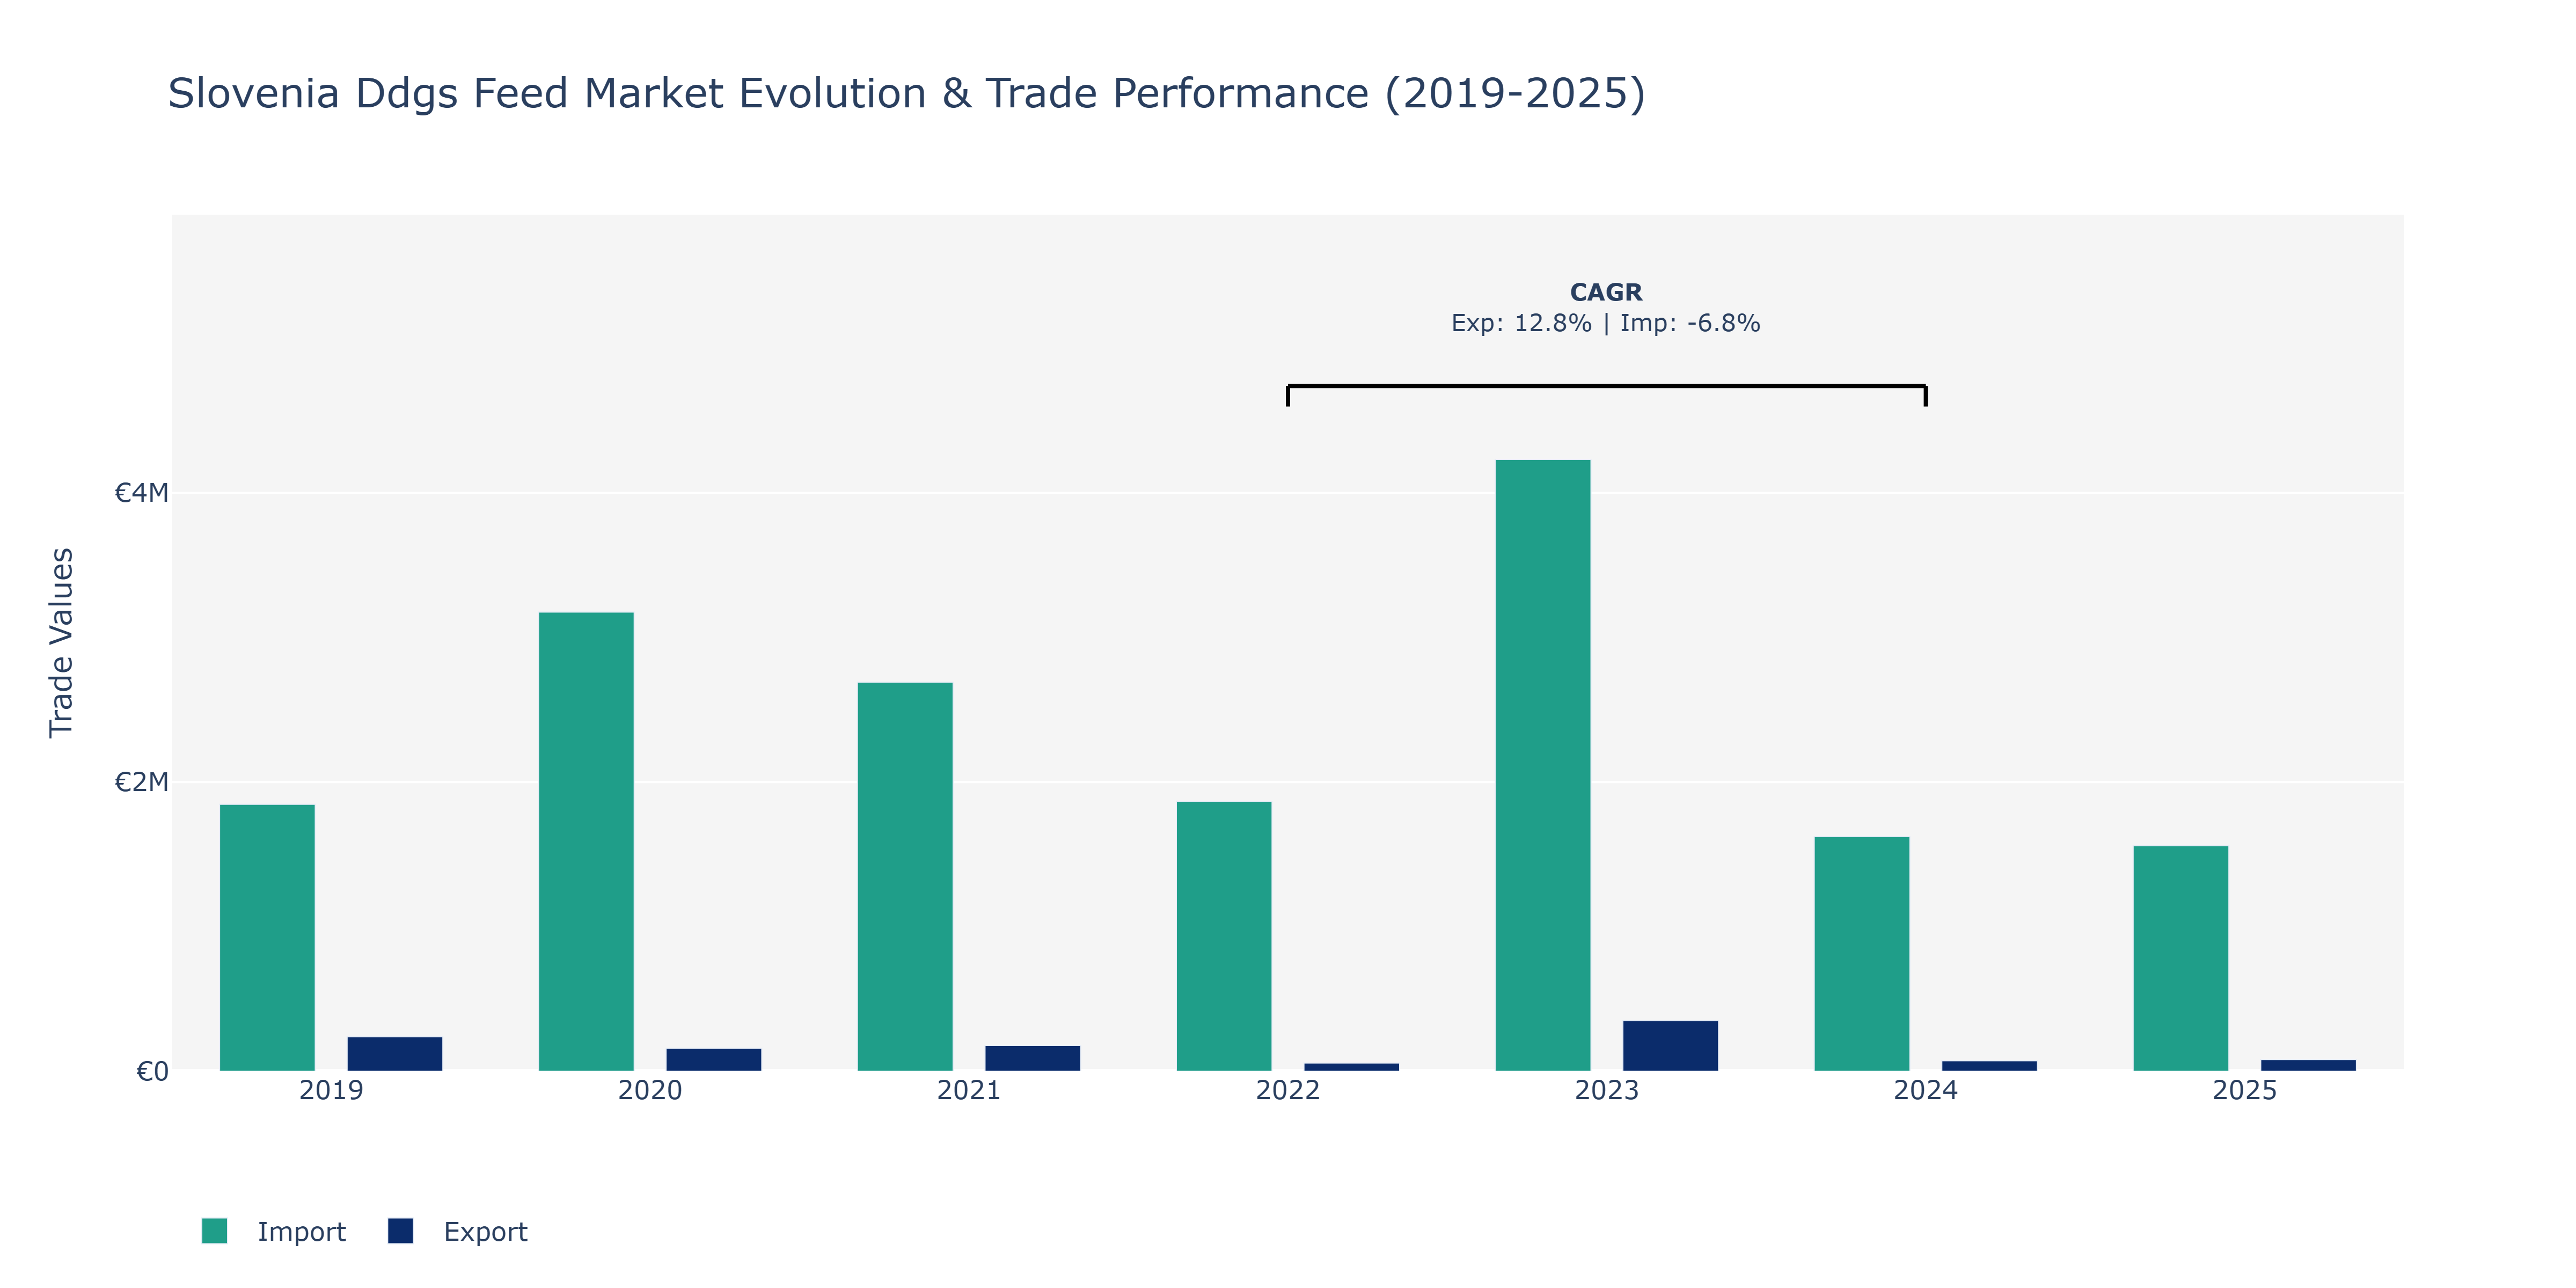
In the Slovenia Ddgs Feed Market, exports experienced fluctuations over the years, with a noticeable peak in 2023 at €350.27 thousand, following a decline in 2024 to €72.56 thousand, and a slight increase to €81.05 thousand in 2025. On the other hand, imports showed a consistent upward trend from €1.85 million in 2019 to €4.23 million in 2023, with a slight decrease to €1.56 million in 2025. The market may have seen these variations due to factors such as changes in domestic demand, global commodity prices, and trade policies affecting the flow of goods. For instance, a rise in exports in 2023 could be attributed to increased demand for Slovenia's products in international markets, while the drop in imports in 2025 might be influenced by shifts in sourcing strategies or regulatory changes impacting imports of feed ingredients. Such dynamics highlight the market's sensitivity to various economic and regulatory factors, necessitating a strategic approach to navigating trade conditions and maintaining competitiveness.
Key Highlights of the Report:
- Slovenia DDGS Feed Market Outlook
- Market Size of Slovenia DDGS Feed Market, 2025
- Forecast of Slovenia DDGS Feed Market, 2032
- Historical Data and Forecast of Slovenia DDGS Feed Revenues & Volume for the Period 2022-2032F
- Slovenia DDGS Feed Market Trend Evolution
- Slovenia DDGS Feed Market Drivers and Challenges
- Slovenia DDGS Feed Price Trends
- Slovenia DDGS Feed Porter`s Five Forces
- Slovenia DDGS Feed Industry Life Cycle
- Historical Data and Forecast of Slovenia DDGS Feed Market Revenues & Volume By Type for the Period 2022-2032F
- Historical Data and Forecast of Slovenia DDGS Feed Market Revenues & Volume By Corn for the Period 2022-2032F
- Historical Data and Forecast of Slovenia DDGS Feed Market Revenues & Volume By Wheat for the Period 2022-2032F
- Historical Data and Forecast of Slovenia DDGS Feed Market Revenues & Volume By Rice for the Period 2022-2032F
- Historical Data and Forecast of Slovenia DDGS Feed Market Revenues & Volume By Amino Acids for the Period 2022-2032F
- Historical Data and Forecast of Slovenia DDGS Feed Market Revenues & Volume By Blended Grains for the Period 2022-2032F
- Historical Data and Forecast of Slovenia DDGS Feed Market Revenues & Volume By Other Type for the Period 2022-2032F
- Historical Data and Forecast of Slovenia DDGS Feed Market Revenues & Volume By Animal Type for the Period 2022-2032F
- Historical Data and Forecast of Slovenia DDGS Feed Market Revenues & Volume By Dairy Cattle for the Period 2022-2032F
- Historical Data and Forecast of Slovenia DDGS Feed Market Revenues & Volume By Beef Cattle for the Period 2022-2032F
- Historical Data and Forecast of Slovenia DDGS Feed Market Revenues & Volume By Swine for the Period 2022-2032F
- Historical Data and Forecast of Slovenia DDGS Feed Market Revenues & Volume By Poultry for the Period 2022-2032F
- Historical Data and Forecast of Slovenia DDGS Feed Market Revenues & Volume By Other Animal Type for the Period 2022-2032F
- Slovenia DDGS Feed Import Export Trade Statistics
- Market Opportunity Assessment By Type
- Market Opportunity Assessment By Animal Type
- Slovenia DDGS Feed Top Companies Market Share
- Slovenia DDGS Feed Competitive Benchmarking By Technical and Operational Parameters
- Slovenia DDGS Feed Company Profiles
- Slovenia DDGS Feed Key Strategic Recommendations
Frequently Asked Questions About the Market Study (FAQs):
6Wresearch actively monitors the Slovenia DDGS Feed Market and publishes its comprehensive annual report, highlighting emerging trends, growth drivers, revenue analysis, and forecast outlook. Our insights help businesses to make data-backed strategic decisions with ongoing market dynamics. Our analysts track relevent industries related to the Slovenia DDGS Feed Market, allowing our clients with actionable intelligence and reliable forecasts tailored to emerging regional needs.
Yes, we provide customisation as per your requirements. To learn more, feel free to contact us on sales@6wresearch.com
1 Executive Summary |
2 Introduction |
2.1 Key Highlights of the Report |
2.2 Report Description |
2.3 Market Scope & Segmentation |
2.4 Research Methodology |
2.5 Assumptions |
3 Slovenia DDGS Feed Market Overview |
3.1 Slovenia Country Macro Economic Indicators |
3.2 Slovenia DDGS Feed Market Revenues & Volume, 2022 & 2032F |
3.3 Slovenia DDGS Feed Market - Industry Life Cycle |
3.4 Slovenia DDGS Feed Market - Porter's Five Forces |
3.5 Slovenia DDGS Feed Market Revenues & Volume Share, By Type, 2022 & 2032F |
3.6 Slovenia DDGS Feed Market Revenues & Volume Share, By Animal Type, 2022 & 2032F |
4 Slovenia DDGS Feed Market Dynamics |
4.1 Impact Analysis |
4.2 Market Drivers |
4.2.1 Increasing adoption of DDGS (Distiller's Dried Grains with Solubles) as a cost-effective feed ingredient in Slovenia. |
4.2.2 Growing awareness about the nutritional benefits and sustainability aspect of using DDGS in animal feed. |
4.2.3 Rise in livestock production and demand for high-quality animal feed in the country. |
4.3 Market Restraints |
4.3.1 Fluctuations in raw material prices impacting the cost-effectiveness of DDGS production and pricing. |
4.3.2 Regulatory challenges related to feed safety standards and import/export regulations. |
4.3.3 Competition from alternative feed ingredients affecting the market penetration of DDGS. |
5 Slovenia DDGS Feed Market Trends |
6 Slovenia DDGS Feed Market Segmentations |
6.1 Slovenia DDGS Feed Market, By Type |
6.1.1 Overview and Analysis |
6.1.2 Slovenia DDGS Feed Market Revenues & Volume, By Corn, 2022-2032F |
6.1.3 Slovenia DDGS Feed Market Revenues & Volume, By Wheat, 2022-2032F |
6.1.4 Slovenia DDGS Feed Market Revenues & Volume, By Rice, 2022-2032F |
6.1.5 Slovenia DDGS Feed Market Revenues & Volume, By Amino Acids, 2022-2032F |
6.1.6 Slovenia DDGS Feed Market Revenues & Volume, By Blended Grains, 2022-2032F |
6.1.7 Slovenia DDGS Feed Market Revenues & Volume, By Other Type, 2022-2032F |
6.2 Slovenia DDGS Feed Market, By Animal Type |
6.2.1 Overview and Analysis |
6.2.2 Slovenia DDGS Feed Market Revenues & Volume, By Dairy Cattle, 2022-2032F |
6.2.3 Slovenia DDGS Feed Market Revenues & Volume, By Beef Cattle, 2022-2032F |
6.2.4 Slovenia DDGS Feed Market Revenues & Volume, By Swine, 2022-2032F |
6.2.5 Slovenia DDGS Feed Market Revenues & Volume, By Poultry, 2022-2032F |
6.2.6 Slovenia DDGS Feed Market Revenues & Volume, By Other Animal Type, 2022-2032F |
7 Slovenia DDGS Feed Market Import-Export Trade Statistics |
7.1 Slovenia DDGS Feed Market Export to Major Countries |
7.2 Slovenia DDGS Feed Market Imports from Major Countries |
8 Slovenia DDGS Feed Market Key Performance Indicators |
8.1 Average selling price of DDGS in the Slovenian market. |
8.2 Adoption rate of DDGS by livestock farmers in different regions of Slovenia. |
8.3 Percentage of total feed formulations in Slovenia incorporating DDGS as an ingredient. |
8.4 Environmental impact assessment of DDGS production and consumption in Slovenia. |
8.5 Number of research studies or publications highlighting the benefits of using DDGS in animal feed. |
9 Slovenia DDGS Feed Market - Opportunity Assessment |
9.1 Slovenia DDGS Feed Market Opportunity Assessment, By Type, 2022 & 2032F |
9.2 Slovenia DDGS Feed Market Opportunity Assessment, By Animal Type, 2022 & 2032F |
10 Slovenia DDGS Feed Market - Competitive Landscape |
10.1 Slovenia DDGS Feed Market Revenue Share, By Companies, 2025 |
10.2 Slovenia DDGS Feed Market Competitive Benchmarking, By Operating and Technical Parameters |
11 Company Profiles |
12 Recommendations | 13 Disclaimer |
Global Go To Market Strategy - 2030
Export potential enables firms to identify high-growth global markets with greater confidence by combining advanced trade intelligence with a structured quantitative methodology. The framework analyzes emerging demand trends and country-level import patterns while integrating macroeconomic and trade datasets such as GDP and population forecasts, bilateral import–export flows, tariff structures, elasticity differentials between developed and developing economies, geographic distance, and import demand projections. Using weighted trade values from 2020–2024 as the base period to project country-to-country export potential for 2030, these inputs are operationalized through calculated drivers such as gravity model parameters, tariff impact factors, and projected GDP per-capita growth. Through an analysis of hidden potentials, demand hotspots, and market conditions that are most favorable to success, this method enables firms to focus on target countries, maximize returns, and global expansion with data, backed by accuracy.
By factoring in the projected importer demand gap that is currently unmet and could be potential opportunity, it identifies the potential for the Exporter (Country) among 190 countries, against the general trade analysis, which identifies the biggest importer or exporter.
To discover high-growth global markets and optimize your business strategy:
Click Here
Pricing
- Single User License$ 1,995
- Department License$ 2,400
- Site License$ 3,120
- Global License$ 3,795

Leadership Perspectives from Industry Events
Search
Thought Leadership and Analyst Meet


Our Clients
6WResearch In News
- India Export Attractiveness Tracker 2026
- India Air Conditioner Market Set for Strong Rebound in 2026 After Weather-Led Correction and GST-Driven Recovery: 6Wresearch
- ADAS in India: How Automatic Emergency Braking, Blind Spot Detection & Driver Monitoring are Transforming Road Safety
- Doha a strategic location for EV manufacturing hub: IPA Qatar
- Demand for luxury TVs surging in the GCC, says Samsung
- Empowering Growth: The Thriving Journey of Bangladesh’s Cable Industry
Latest Reports
- Nicaragua RPG Gaming Market (2026-2032)
- New Zealand RPG Gaming Market (2026-2032)
- Netherlands RPG Gaming Market (2026-2032)
- Nauru RPG Gaming Market (2026-2032)
- Namibia RPG Gaming Market (2026-2032)
- Mozambique RPG Gaming Market (2026-2032)
- Montenegro RPG Gaming Market (2026-2032)
- Mongolia RPG Gaming Market (2026-2032)
- Monaco RPG Gaming Market (2026-2032)
- Micronesia RPG Gaming Market (2026-2032)
Industry Events and Analyst Meet

EV India Expo 2026

HIMTEX 2026

India Refining Summit 2026

India EV Show 2026

EV tech India Expo 2026
Whitepaper
- Middle East & Africa Commercial Security Market Click here to view more.
- Middle East & Africa Fire Safety Systems & Equipment Market Click here to view more.
- GCC Drone Market Click here to view more.
- Middle East Lighting Fixture Market Click here to view more.
- GCC Physical & Perimeter Security Market Click here to view more.