Slovenia Dry Cleaning Machine Market (2026-2032) | Trends, Forecast, Revenue, Growth, Segmentation, Value, Size, Industry, Companies, Share, Outlook & Analysis
Market Forecast By Types (Single Solvent Dry Cleaning Machines, Multi Solvent Dry Cleaning Machines), By Applications (Dry Cleaners, Hotel and Hospitality, Healthcare Institutions, Other) And Competitive Landscape
| Product Code: ETC5181382 | Publication Date: Nov 2023 | Updated Date: Apr 2026 | Product Type: Market Research Report | |
| Publisher: 6Wresearch | Author: Shubham Padhi | No. of Pages: 60 | No. of Figures: 30 | No. of Tables: 5 |
Slovenia Dry Cleaning Machine Market Size (2020-2030)
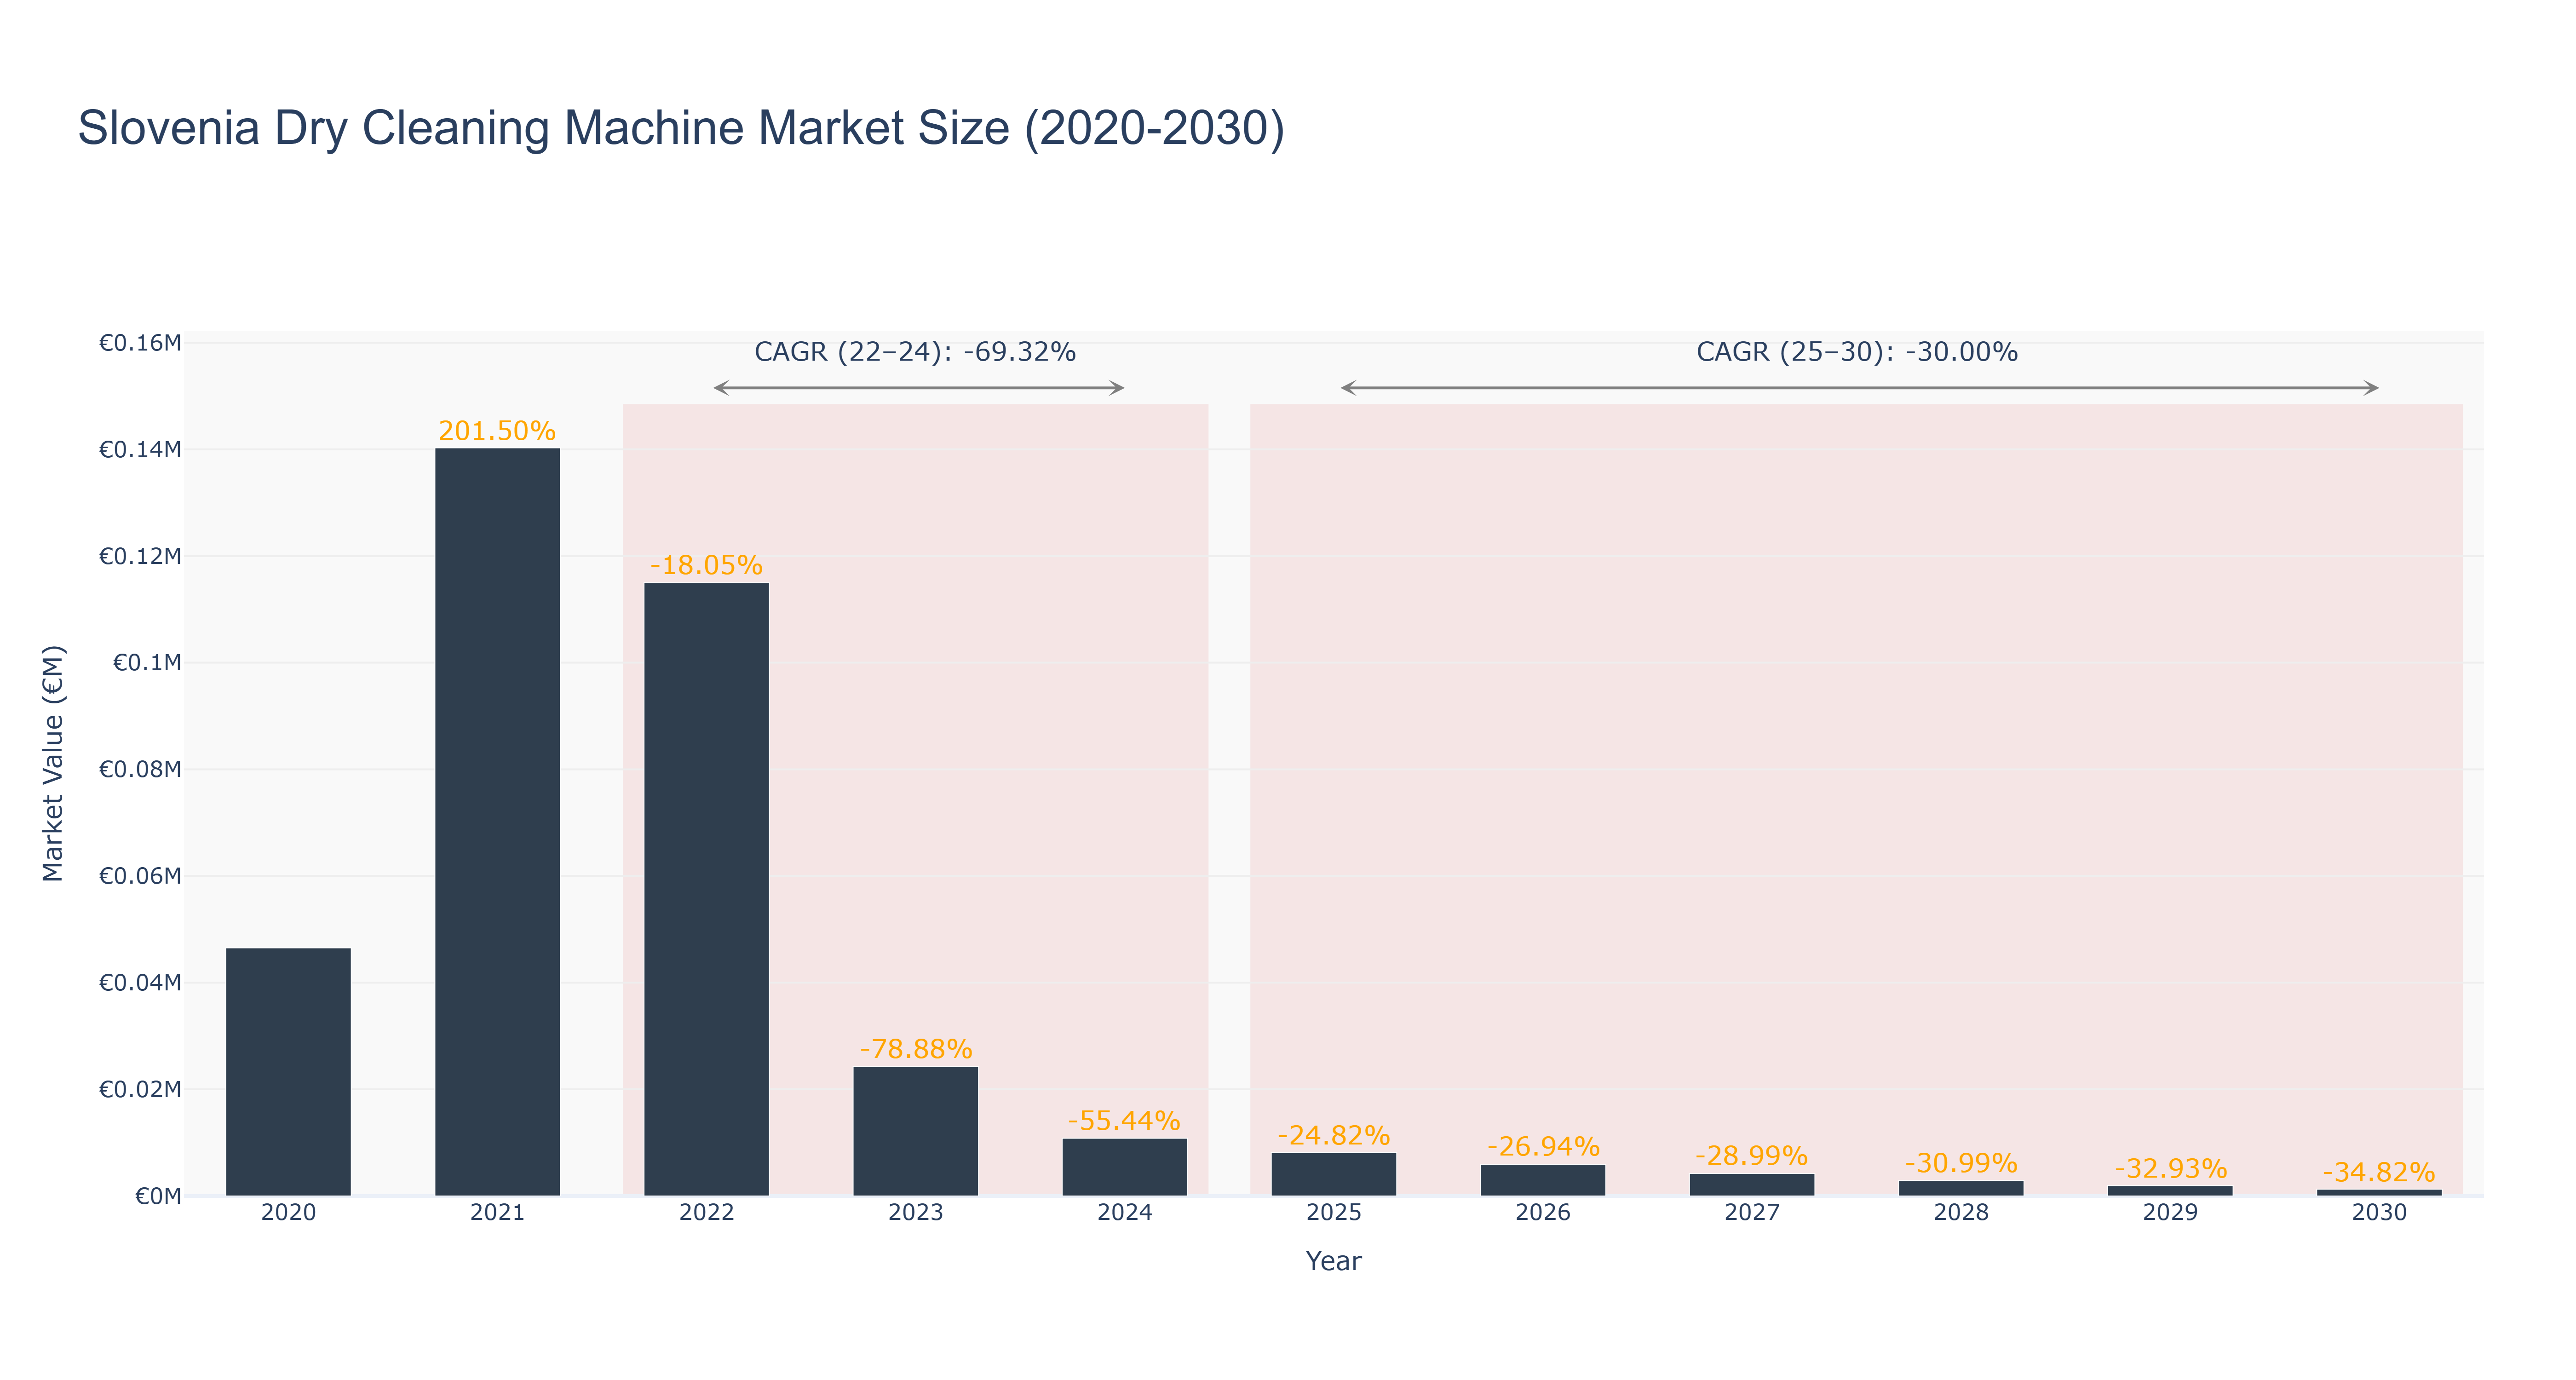
The Slovenia Dry Cleaning Machine Market peaked in 2021 with a market size of €0.14 million. However, the market experienced a significant decline thereafter, reaching €0.01 million in 2024. The forecasted market size from 2025 to 2030 remains stagnant at €0.01 million, with a CAGR of -30.0%. The sharp decline in market size from 2021 can be attributed to changing consumer preferences towards more sustainable and cost-effective dry cleaning alternatives. Looking ahead, the market is expected to focus on innovation in eco-friendly dry cleaning technologies to regain consumer interest. One of the key upcoming developments in the market includes the introduction of smart dry cleaning machines that offer enhanced efficiency and reduced environmental impact, aligning with the industry's sustainability goals. Industry drivers for the Slovenia Dry Cleaning Machine Market include increasing awareness about environmental sustainability, stringent regulations promoting eco-friendly practices, and the growing demand for energy-efficient appliances.
Slovenia Dry Cleaning Machine Market: Production & Trade Performance (2019-2025)
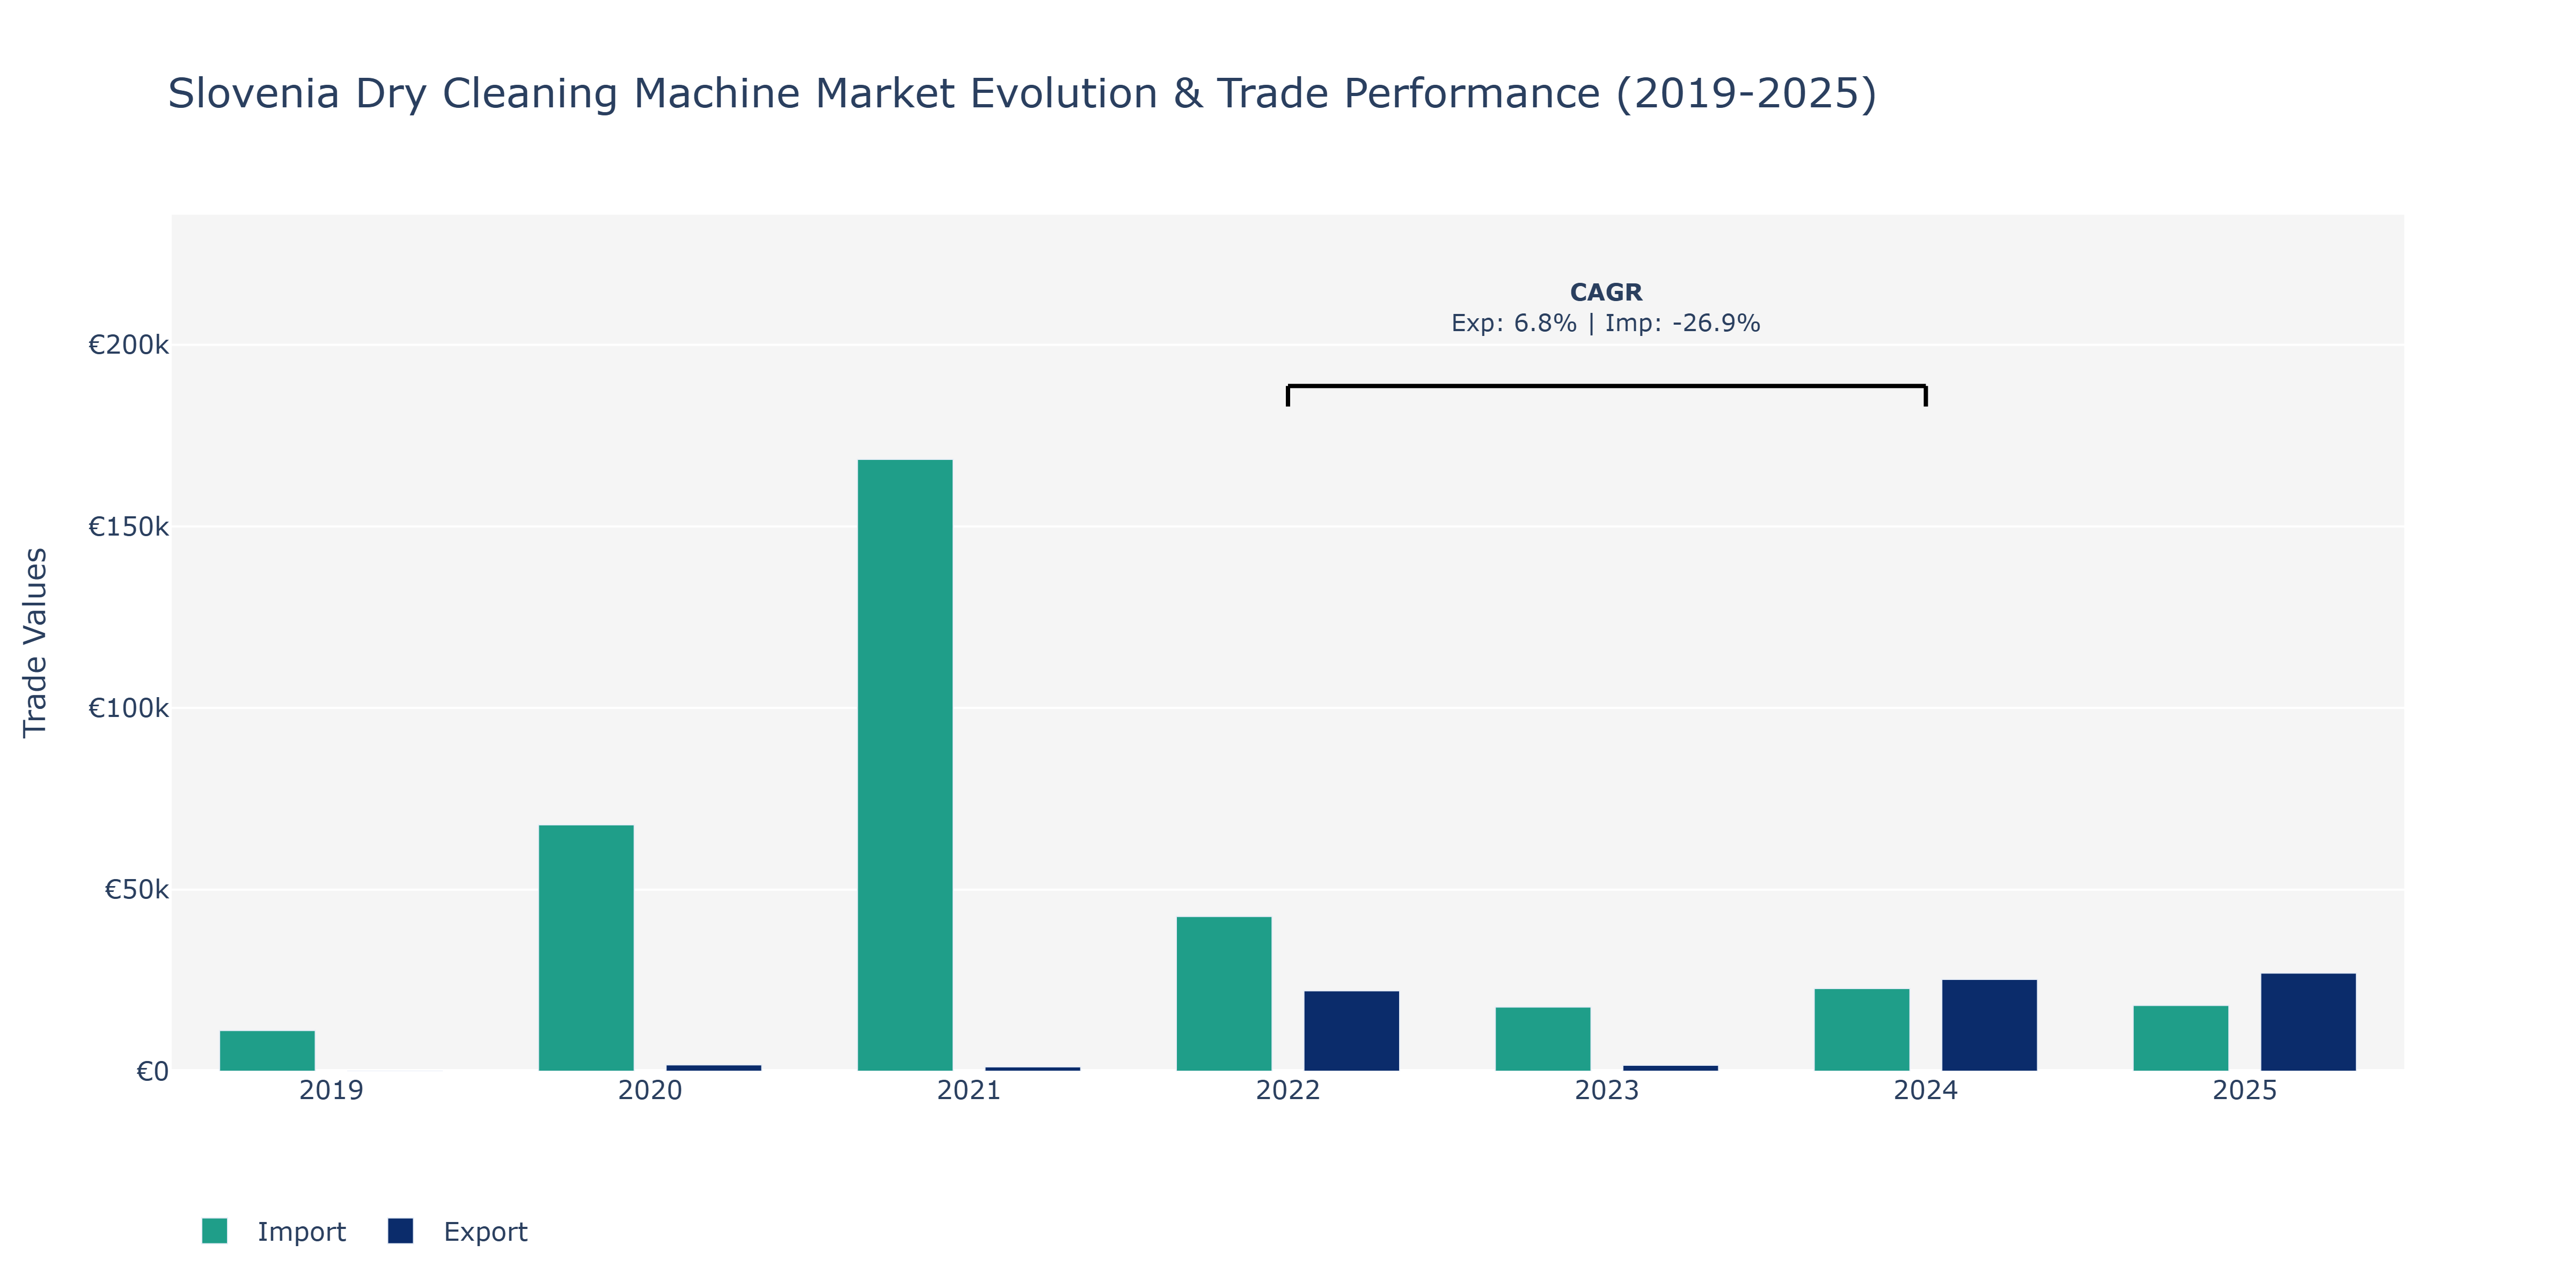
In the Slovenia Dry Cleaning Machine Market, exports exhibited fluctuations over the years, with a notable peak in 2025 reaching €27.02 thousand, showcasing a positive growth trajectory since 2022. This growth could be attributed to advancements in dry cleaning technology, increasing demand for eco-friendly solutions, and the market's responsiveness to evolving consumer preferences. Conversely, imports experienced a sharp decline from €67.82 thousand in 2020 to €18.11 thousand in 2025. This significant downturn could be linked to strategic shifts in the supply chain, government policies affecting international trade dynamics, and possibly a shift towards domestic production or sourcing from alternative markets. The contrasting trends between exports and imports emphasize the market's adaptability to both internal and external factors, highlighting the need for market players to remain agile and responsive to changing market conditions.
Key Highlights of the Report:
- Slovenia Dry Cleaning Machine Market Outlook
- Market Size of Slovenia Dry Cleaning Machine Market, 2025
- Forecast of Slovenia Dry Cleaning Machine Market, 2032
- Historical Data and Forecast of Slovenia Dry Cleaning Machine Revenues & Volume for the Period 2022-2032F
- Slovenia Dry Cleaning Machine Market Trend Evolution
- Slovenia Dry Cleaning Machine Market Drivers and Challenges
- Slovenia Dry Cleaning Machine Price Trends
- Slovenia Dry Cleaning Machine Porter`s Five Forces
- Slovenia Dry Cleaning Machine Industry Life Cycle
- Historical Data and Forecast of Slovenia Dry Cleaning Machine Market Revenues & Volume By Types for the Period 2022-2032F
- Historical Data and Forecast of Slovenia Dry Cleaning Machine Market Revenues & Volume By Single Solvent Dry Cleaning Machines for the Period 2022-2032F
- Historical Data and Forecast of Slovenia Dry Cleaning Machine Market Revenues & Volume By Multi Solvent Dry Cleaning Machines for the Period 2022-2032F
- Historical Data and Forecast of Slovenia Dry Cleaning Machine Market Revenues & Volume By Applications for the Period 2022-2032F
- Historical Data and Forecast of Slovenia Dry Cleaning Machine Market Revenues & Volume By Dry Cleaners for the Period 2022-2032F
- Historical Data and Forecast of Slovenia Dry Cleaning Machine Market Revenues & Volume By Hotel and Hospitality for the Period 2022-2032F
- Historical Data and Forecast of Slovenia Dry Cleaning Machine Market Revenues & Volume By Healthcare Institutions for the Period 2022-2032F
- Historical Data and Forecast of Slovenia Dry Cleaning Machine Market Revenues & Volume By Other for the Period 2022-2032F
- Slovenia Dry Cleaning Machine Import Export Trade Statistics
- Market Opportunity Assessment By Types
- Market Opportunity Assessment By Applications
- Slovenia Dry Cleaning Machine Top Companies Market Share
- Slovenia Dry Cleaning Machine Competitive Benchmarking By Technical and Operational Parameters
- Slovenia Dry Cleaning Machine Company Profiles
- Slovenia Dry Cleaning Machine Key Strategic Recommendations
Frequently Asked Questions About the Market Study (FAQs):
6Wresearch actively monitors the Slovenia Dry Cleaning Machine Market and publishes its comprehensive annual report, highlighting emerging trends, growth drivers, revenue analysis, and forecast outlook. Our insights help businesses to make data-backed strategic decisions with ongoing market dynamics. Our analysts track relevent industries related to the Slovenia Dry Cleaning Machine Market, allowing our clients with actionable intelligence and reliable forecasts tailored to emerging regional needs.
Yes, we provide customisation as per your requirements. To learn more, feel free to contact us on sales@6wresearch.com
1 Executive Summary |
2 Introduction |
2.1 Key Highlights of the Report |
2.2 Report Description |
2.3 Market Scope & Segmentation |
2.4 Research Methodology |
2.5 Assumptions |
3 Slovenia Dry Cleaning Machine Market Overview |
3.1 Slovenia Country Macro Economic Indicators |
3.2 Slovenia Dry Cleaning Machine Market Revenues & Volume, 2022 & 2032F |
3.3 Slovenia Dry Cleaning Machine Market - Industry Life Cycle |
3.4 Slovenia Dry Cleaning Machine Market - Porter's Five Forces |
3.5 Slovenia Dry Cleaning Machine Market Revenues & Volume Share Segmentations, 2022 & 2032F |
3.6 Slovenia Dry Cleaning Machine Market Revenues & Volume Share, By Applications, 2022 & 2032F |
4 Slovenia Dry Cleaning Machine Market Dynamics |
4.1 Impact Analysis |
4.2 Market Drivers |
4.2.1 Growing demand for efficient and eco-friendly cleaning solutions |
4.2.2 Increasing adoption of technology-driven dry cleaning machines |
4.2.3 Rise in disposable income leading to higher spending on laundry services |
4.3 Market Restraints |
4.3.1 High initial investment costs for setting up dry cleaning businesses |
4.3.2 Lack of skilled labor for operating advanced dry cleaning machines |
4.3.3 Regulatory challenges related to environmental impact and waste disposal |
5 Slovenia Dry Cleaning Machine Market Trends |
6 Slovenia Dry Cleaning Machine Market Segmentations |
6.1 Slovenia Dry Cleaning Machine Market Segmentations |
6.1.1 Overview and Analysis |
6.1.2 Slovenia Dry Cleaning Machine Market Revenues & Volume, By Single Solvent Dry Cleaning Machines, 2022-2032F |
6.1.3 Slovenia Dry Cleaning Machine Market Revenues & Volume, By Multi Solvent Dry Cleaning Machines, 2022-2032F |
6.2 Slovenia Dry Cleaning Machine Market, By Applications |
6.2.1 Overview and Analysis |
6.2.2 Slovenia Dry Cleaning Machine Market Revenues & Volume, By Dry Cleaners, 2022-2032F |
6.2.3 Slovenia Dry Cleaning Machine Market Revenues & Volume, By Hotel and Hospitality, 2022-2032F |
6.2.4 Slovenia Dry Cleaning Machine Market Revenues & Volume, By Healthcare Institutions, 2022-2032F |
6.2.5 Slovenia Dry Cleaning Machine Market Revenues & Volume, By Other, 2022-2032F |
7 Slovenia Dry Cleaning Machine Market Import-Export Trade Statistics |
7.1 Slovenia Dry Cleaning Machine Market Export to Major Countries |
7.2 Slovenia Dry Cleaning Machine Market Imports from Major Countries |
8 Slovenia Dry Cleaning Machine Market Key Performance Indicators |
8.1 Energy efficiency rating of dry cleaning machines |
8.2 Adoption rate of automated dry cleaning technologies |
8.3 Customer satisfaction scores for dry cleaning services |
8.4 Maintenance costs of dry cleaning machines |
8.5 Percentage of businesses adopting sustainable practices in dry cleaning operations |
9 Slovenia Dry Cleaning Machine Market - Opportunity Assessment |
9.1 Slovenia Dry Cleaning Machine Market Opportunity Assessment Segmentations, 2022 & 2032F |
9.2 Slovenia Dry Cleaning Machine Market Opportunity Assessment, By Applications, 2022 & 2032F |
10 Slovenia Dry Cleaning Machine Market - Competitive Landscape |
10.1 Slovenia Dry Cleaning Machine Market Revenue Share, By Companies, 2025 |
10.2 Slovenia Dry Cleaning Machine Market Competitive Benchmarking, By Operating and Technical Parameters |
11 Company Profiles |
12 Recommendations | 13 Disclaimer |
Global Go To Market Strategy - 2030
Export potential enables firms to identify high-growth global markets with greater confidence by combining advanced trade intelligence with a structured quantitative methodology. The framework analyzes emerging demand trends and country-level import patterns while integrating macroeconomic and trade datasets such as GDP and population forecasts, bilateral import–export flows, tariff structures, elasticity differentials between developed and developing economies, geographic distance, and import demand projections. Using weighted trade values from 2020–2024 as the base period to project country-to-country export potential for 2030, these inputs are operationalized through calculated drivers such as gravity model parameters, tariff impact factors, and projected GDP per-capita growth. Through an analysis of hidden potentials, demand hotspots, and market conditions that are most favorable to success, this method enables firms to focus on target countries, maximize returns, and global expansion with data, backed by accuracy.
By factoring in the projected importer demand gap that is currently unmet and could be potential opportunity, it identifies the potential for the Exporter (Country) among 190 countries, against the general trade analysis, which identifies the biggest importer or exporter.
To discover high-growth global markets and optimize your business strategy:
Click Here
Pricing
- Single User License$ 1,995
- Department License$ 2,400
- Site License$ 3,120
- Global License$ 3,795

Leadership Perspectives from Industry Events
Search
Thought Leadership and Analyst Meet


Our Clients
6WResearch In News
- India Export Attractiveness Tracker 2026
- India Air Conditioner Market Set for Strong Rebound in 2026 After Weather-Led Correction and GST-Driven Recovery: 6Wresearch
- ADAS in India: How Automatic Emergency Braking, Blind Spot Detection & Driver Monitoring are Transforming Road Safety
- Doha a strategic location for EV manufacturing hub: IPA Qatar
- Demand for luxury TVs surging in the GCC, says Samsung
- Empowering Growth: The Thriving Journey of Bangladesh’s Cable Industry
Latest Reports
- Nicaragua RPG Gaming Market (2026-2032)
- New Zealand RPG Gaming Market (2026-2032)
- Netherlands RPG Gaming Market (2026-2032)
- Nauru RPG Gaming Market (2026-2032)
- Namibia RPG Gaming Market (2026-2032)
- Mozambique RPG Gaming Market (2026-2032)
- Montenegro RPG Gaming Market (2026-2032)
- Mongolia RPG Gaming Market (2026-2032)
- Monaco RPG Gaming Market (2026-2032)
- Micronesia RPG Gaming Market (2026-2032)
Industry Events and Analyst Meet

EV India Expo 2026

HIMTEX 2026

India Refining Summit 2026

India EV Show 2026

EV tech India Expo 2026
Whitepaper
- Middle East & Africa Commercial Security Market Click here to view more.
- Middle East & Africa Fire Safety Systems & Equipment Market Click here to view more.
- GCC Drone Market Click here to view more.
- Middle East Lighting Fixture Market Click here to view more.
- GCC Physical & Perimeter Security Market Click here to view more.