Slovenia Industrial Burner Market (2026-2032) | Outlook, Companies, Analysis, Share, Growth, Forecast, Industry, Size, Segmentation, Revenue, Value & Trends
Market Forecast By Type (Cold Chamber Die Casting Machine, Hot Chamber Die Casting Machine, Gravity Die Casting Machine), By Material (Aluminum, Zinc, Magnesium), By End User (Transportation, Mechanical & Manufacturing Equipment, Building & Construction) And Competitive Landscape
| Product Code: ETC5190426 | Publication Date: Nov 2023 | Updated Date: Apr 2026 | Product Type: Market Research Report | |
| Publisher: 6Wresearch | Author: Shubham Padhi | No. of Pages: 60 | No. of Figures: 30 | No. of Tables: 5 |
Slovenia Industrial Burner Market Size (2020-2030)
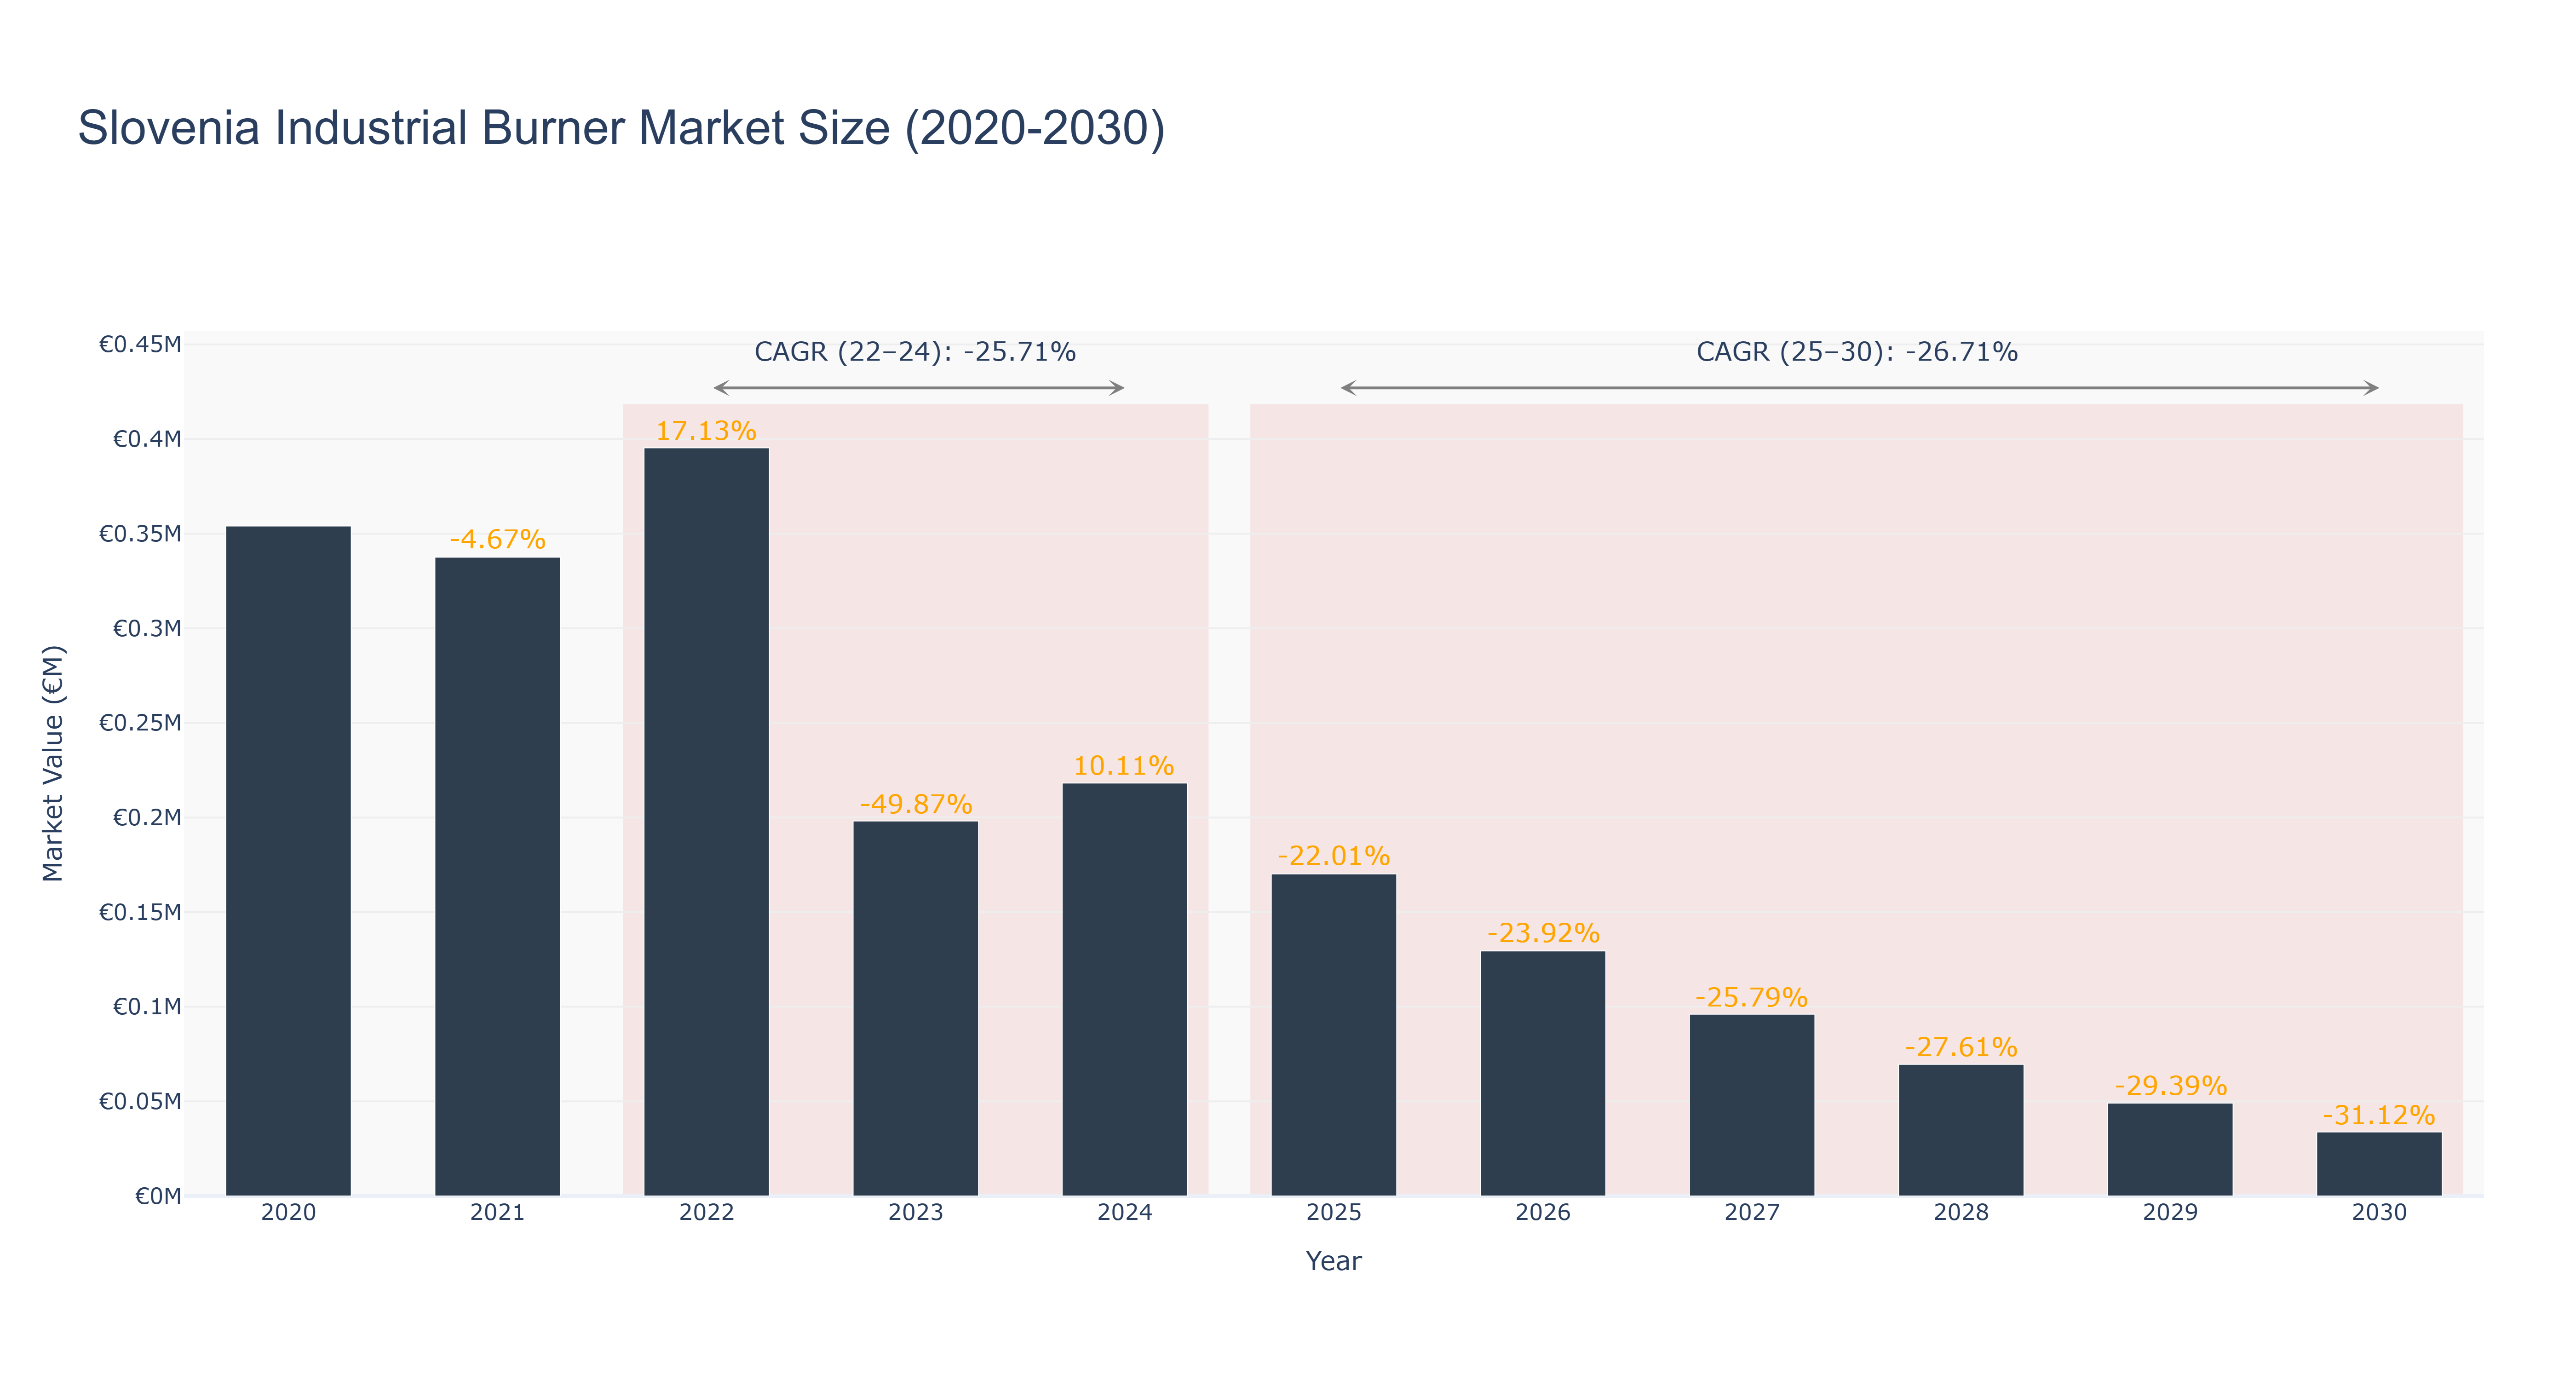
The Slovenia Industrial Burner Market witnessed a peak market size of €0.40 million in 2022. The actual market size declined steadily from 2020 to 2024, reaching €0.22 million in 2024. Forecasted market size from 2025 to 2030 shows a continued downward trend with a CAGR of -26.71%. The significant drop in market size can be attributed to various factors such as economic downturns, technological advancements leading to efficiency improvements, and evolving customer preferences towards alternative energy sources. Looking ahead, the market is expected to focus on sustainability initiatives and innovation in burner technology to regain growth momentum. Recent developments indicate a shift towards eco-friendly burner solutions and partnerships with renewable energy providers to meet environmental regulations and customer demands. Industry drivers include the push for energy efficiency, stringent environmental regulations, and the need for cost-effective industrial heating solutions. Future developments may include collaborations with research institutions for advanced burner designs and the integration of IoT technology for smart burner systems.
Slovenia Industrial Burner Market: Production & Trade Performance (2019-2025)
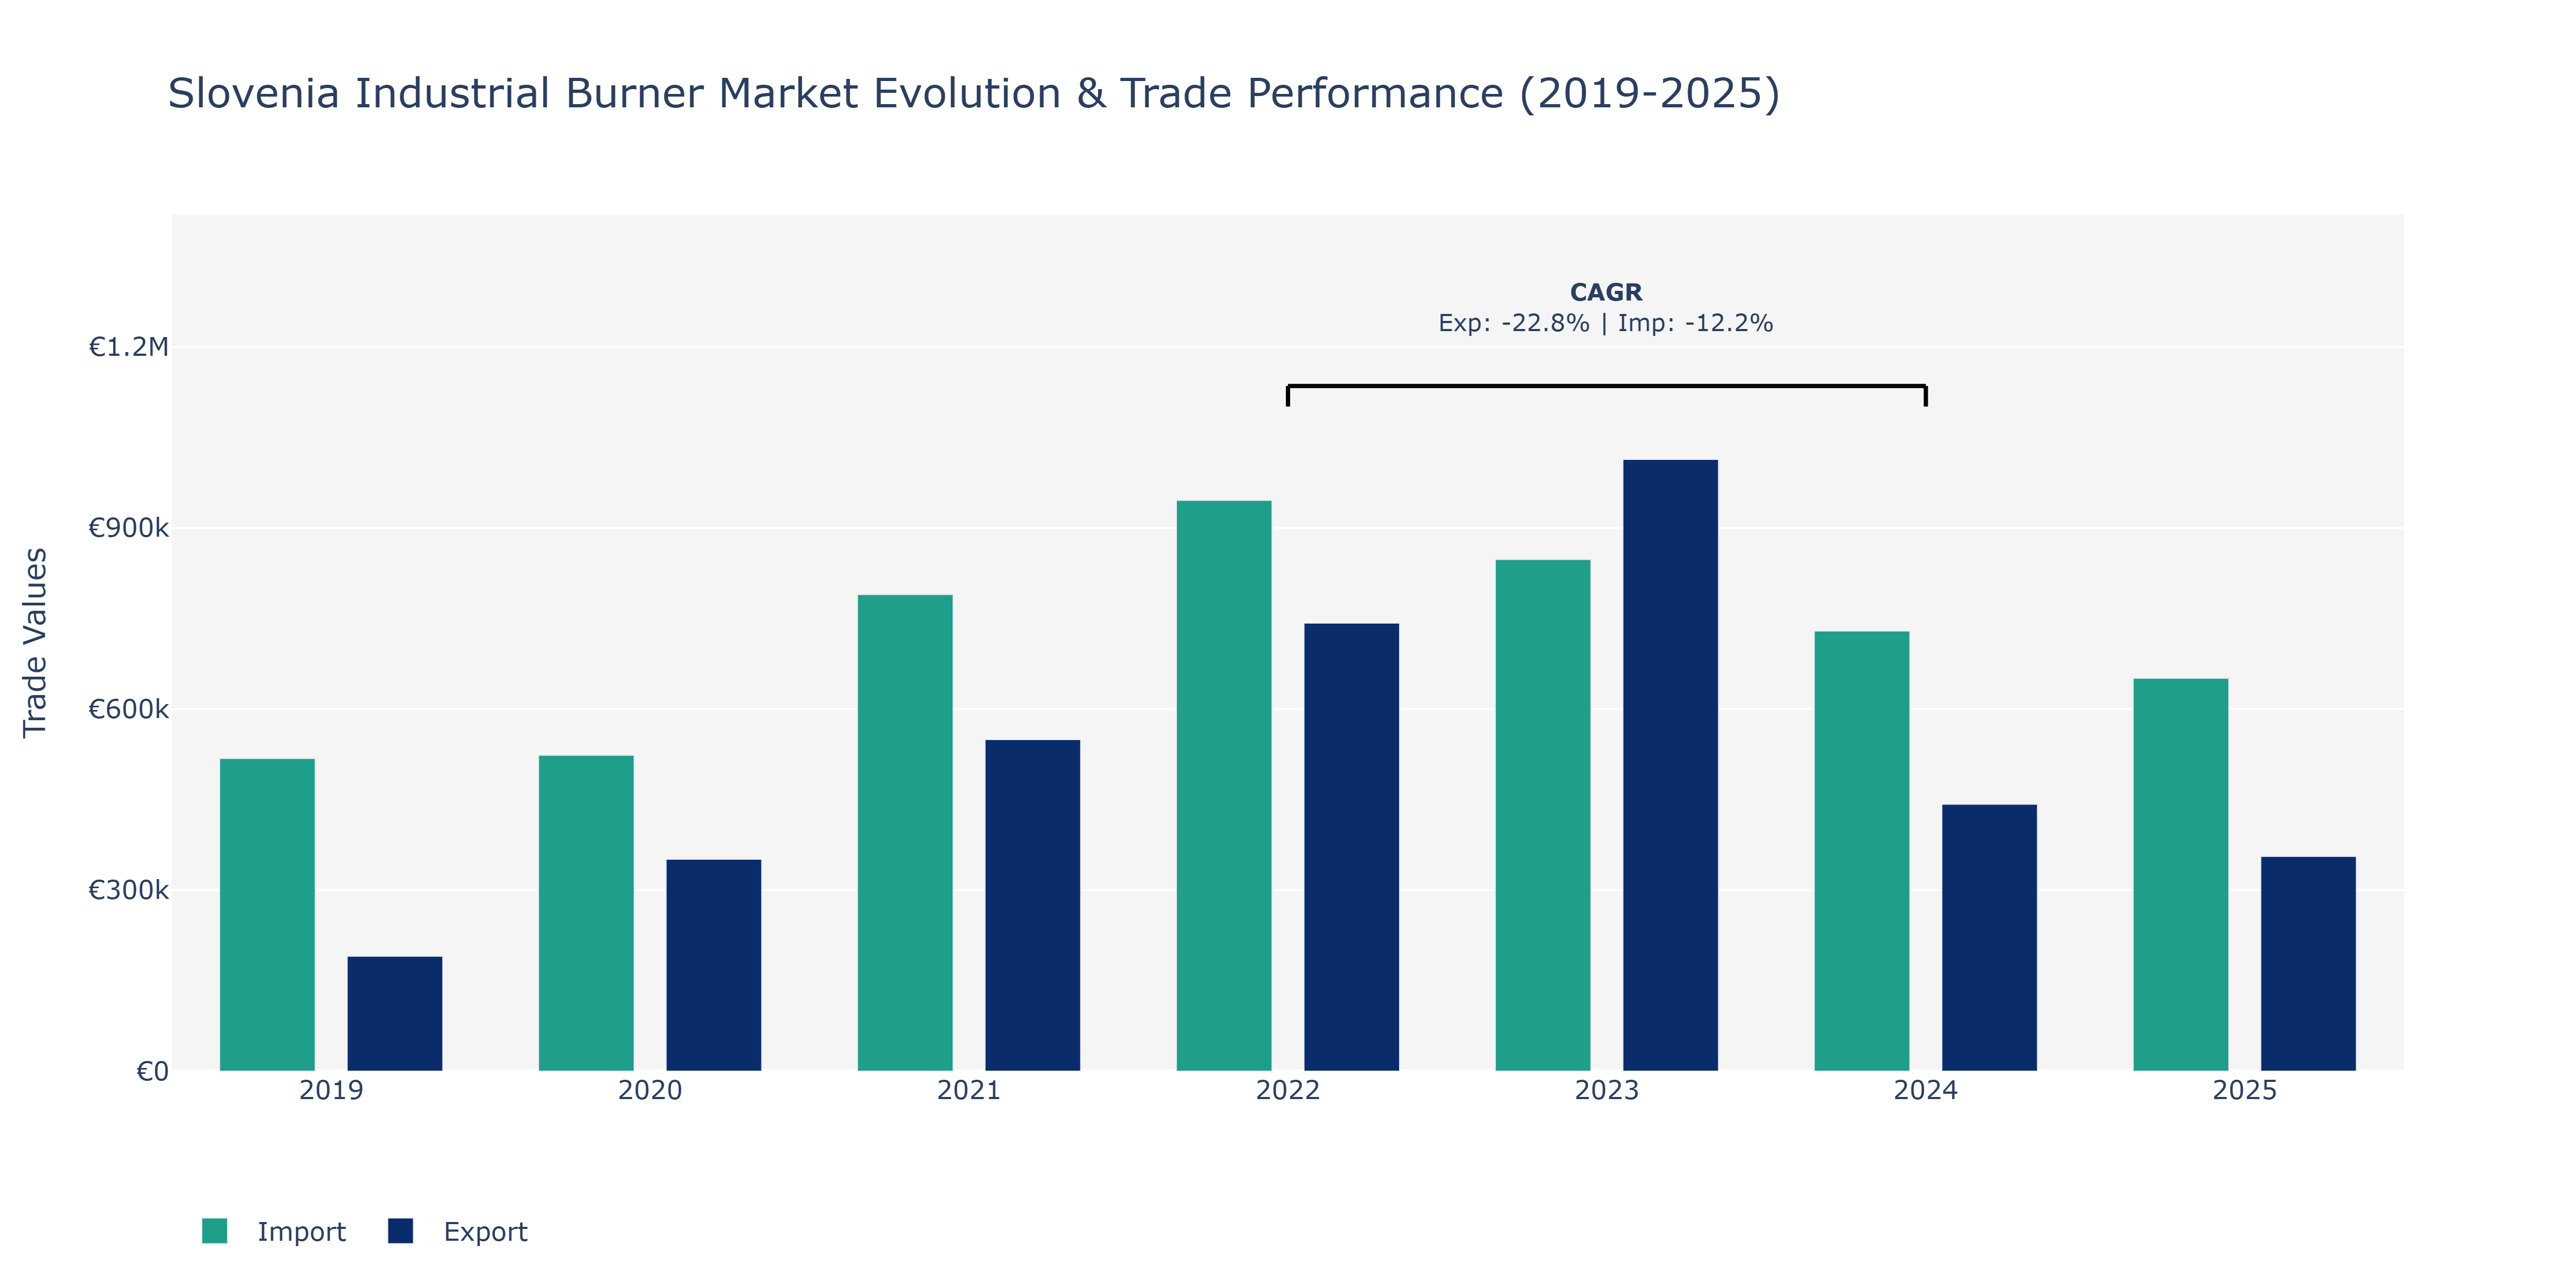
Between 2019 and 2025, Slovenia's Industrial Burner Market saw fluctuations in both exports and imports. Exports increased steadily from €190.39 thousand in 2019 to a peak of €1.01 million in 2023 before declining to €355.84 thousand in 2025. Conversely, imports peaked at €789.7 thousand in 2021 and then experienced a slight decrease by 2025 to €651.08 thousand. The drop in exports after 2023 could be attributed to changing global demand for industrial burners, possibly influenced by energy transition policies in the EU. In contrast, the decline in imports post-2021 may reflect shifts in domestic production capabilities or changes in international trade dynamics. Slovenia's industrial burner sector may need to adapt to evolving market conditions and emerging energy technologies to maintain its competitiveness in the future.
Key Highlights of the Report:
- Slovenia Industrial Burner Market Outlook
- Market Size of Slovenia Industrial Burner Market, 2025
- Forecast of Slovenia Industrial Burner Market, 2032
- Historical Data and Forecast of Slovenia Industrial Burner Revenues & Volume for the Period 2022-2032F
- Slovenia Industrial Burner Market Trend Evolution
- Slovenia Industrial Burner Market Drivers and Challenges
- Slovenia Industrial Burner Price Trends
- Slovenia Industrial Burner Porter`s Five Forces
- Slovenia Industrial Burner Industry Life Cycle
- Historical Data and Forecast of Slovenia Industrial Burner Market Revenues & Volume By Type for the Period 2022-2032F
- Historical Data and Forecast of Slovenia Industrial Burner Market Revenues & Volume By Cold Chamber Die Casting Machine for the Period 2022-2032F
- Historical Data and Forecast of Slovenia Industrial Burner Market Revenues & Volume By Hot Chamber Die Casting Machine for the Period 2022-2032F
- Historical Data and Forecast of Slovenia Industrial Burner Market Revenues & Volume By Gravity Die Casting Machine for the Period 2022-2032F
- Historical Data and Forecast of Slovenia Industrial Burner Market Revenues & Volume By Material for the Period 2022-2032F
- Historical Data and Forecast of Slovenia Industrial Burner Market Revenues & Volume By Aluminum for the Period 2022-2032F
- Historical Data and Forecast of Slovenia Industrial Burner Market Revenues & Volume By Zinc for the Period 2022-2032F
- Historical Data and Forecast of Slovenia Industrial Burner Market Revenues & Volume By Magnesium for the Period 2022-2032F
- Historical Data and Forecast of Slovenia Industrial Burner Market Revenues & Volume By End User for the Period 2022-2032F
- Historical Data and Forecast of Slovenia Industrial Burner Market Revenues & Volume By Transportation for the Period 2022-2032F
- Historical Data and Forecast of Slovenia Industrial Burner Market Revenues & Volume By Mechanical & Manufacturing Equipment for the Period 2022-2032F
- Historical Data and Forecast of Slovenia Industrial Burner Market Revenues & Volume By Building & Construction for the Period 2022-2032F
- Slovenia Industrial Burner Import Export Trade Statistics
- Market Opportunity Assessment By Type
- Market Opportunity Assessment By Material
- Market Opportunity Assessment By End User
- Slovenia Industrial Burner Top Companies Market Share
- Slovenia Industrial Burner Competitive Benchmarking By Technical and Operational Parameters
- Slovenia Industrial Burner Company Profiles
- Slovenia Industrial Burner Key Strategic Recommendations
Frequently Asked Questions About the Market Study (FAQs):
6Wresearch actively monitors the Slovenia Industrial Burner Market and publishes its comprehensive annual report, highlighting emerging trends, growth drivers, revenue analysis, and forecast outlook. Our insights help businesses to make data-backed strategic decisions with ongoing market dynamics. Our analysts track relevent industries related to the Slovenia Industrial Burner Market, allowing our clients with actionable intelligence and reliable forecasts tailored to emerging regional needs.
Yes, we provide customisation as per your requirements. To learn more, feel free to contact us on sales@6wresearch.com
1 Executive Summary |
2 Introduction |
2.1 Key Highlights of the Report |
2.2 Report Description |
2.3 Market Scope & Segmentation |
2.4 Research Methodology |
2.5 Assumptions |
3 Slovenia Industrial Burner Market Overview |
3.1 Slovenia Country Macro Economic Indicators |
3.2 Slovenia Industrial Burner Market Revenues & Volume, 2022 & 2032F |
3.3 Slovenia Industrial Burner Market - Industry Life Cycle |
3.4 Slovenia Industrial Burner Market - Porter's Five Forces |
3.5 Slovenia Industrial Burner Market Revenues & Volume Share, By Type, 2022 & 2032F |
3.6 Slovenia Industrial Burner Market Revenues & Volume Share, By Material, 2022 & 2032F |
3.7 Slovenia Industrial Burner Market Revenues & Volume Share, By End User, 2022 & 2032F |
4 Slovenia Industrial Burner Market Dynamics |
4.1 Impact Analysis |
4.2 Market Drivers |
4.2.1 Increasing focus on energy efficiency and sustainability in industrial operations |
4.2.2 Growing industrialization and expansion of manufacturing sectors in Slovenia |
4.2.3 Technological advancements in industrial burner systems improving efficiency and performance |
4.3 Market Restraints |
4.3.1 Fluctuating prices of raw materials impacting manufacturing costs |
4.3.2 Stringent regulations and emission norms for industrial operations |
4.3.3 Economic uncertainties affecting investment decisions in industrial burner systems |
5 Slovenia Industrial Burner Market Trends |
6 Slovenia Industrial Burner Market Segmentations |
6.1 Slovenia Industrial Burner Market, By Type |
6.1.1 Overview and Analysis |
6.1.2 Slovenia Industrial Burner Market Revenues & Volume, By Cold Chamber Die Casting Machine, 2022-2032F |
6.1.3 Slovenia Industrial Burner Market Revenues & Volume, By Hot Chamber Die Casting Machine, 2022-2032F |
6.1.4 Slovenia Industrial Burner Market Revenues & Volume, By Gravity Die Casting Machine, 2022-2032F |
6.2 Slovenia Industrial Burner Market, By Material |
6.2.1 Overview and Analysis |
6.2.2 Slovenia Industrial Burner Market Revenues & Volume, By Aluminum, 2022-2032F |
6.2.3 Slovenia Industrial Burner Market Revenues & Volume, By Zinc, 2022-2032F |
6.2.4 Slovenia Industrial Burner Market Revenues & Volume, By Magnesium, 2022-2032F |
6.3 Slovenia Industrial Burner Market, By End User |
6.3.1 Overview and Analysis |
6.3.2 Slovenia Industrial Burner Market Revenues & Volume, By Transportation, 2022-2032F |
6.3.3 Slovenia Industrial Burner Market Revenues & Volume, By Mechanical & Manufacturing Equipment, 2022-2032F |
6.3.4 Slovenia Industrial Burner Market Revenues & Volume, By Building & Construction, 2022-2032F |
7 Slovenia Industrial Burner Market Import-Export Trade Statistics |
7.1 Slovenia Industrial Burner Market Export to Major Countries |
7.2 Slovenia Industrial Burner Market Imports from Major Countries |
8 Slovenia Industrial Burner Market Key Performance Indicators |
8.1 Energy efficiency improvements in industrial processes |
8.2 Adoption rate of advanced industrial burner technologies |
8.3 Number of new industrial projects or expansions in key sectors using industrial burner systems |
9 Slovenia Industrial Burner Market - Opportunity Assessment |
9.1 Slovenia Industrial Burner Market Opportunity Assessment, By Type, 2022 & 2032F |
9.2 Slovenia Industrial Burner Market Opportunity Assessment, By Material, 2022 & 2032F |
9.3 Slovenia Industrial Burner Market Opportunity Assessment, By End User, 2022 & 2032F |
10 Slovenia Industrial Burner Market - Competitive Landscape |
10.1 Slovenia Industrial Burner Market Revenue Share, By Companies, 2025 |
10.2 Slovenia Industrial Burner Market Competitive Benchmarking, By Operating and Technical Parameters |
11 Company Profiles |
12 Recommendations | 13 Disclaimer |
Global Go To Market Strategy - 2030
Export potential enables firms to identify high-growth global markets with greater confidence by combining advanced trade intelligence with a structured quantitative methodology. The framework analyzes emerging demand trends and country-level import patterns while integrating macroeconomic and trade datasets such as GDP and population forecasts, bilateral import–export flows, tariff structures, elasticity differentials between developed and developing economies, geographic distance, and import demand projections. Using weighted trade values from 2020–2024 as the base period to project country-to-country export potential for 2030, these inputs are operationalized through calculated drivers such as gravity model parameters, tariff impact factors, and projected GDP per-capita growth. Through an analysis of hidden potentials, demand hotspots, and market conditions that are most favorable to success, this method enables firms to focus on target countries, maximize returns, and global expansion with data, backed by accuracy.
By factoring in the projected importer demand gap that is currently unmet and could be potential opportunity, it identifies the potential for the Exporter (Country) among 190 countries, against the general trade analysis, which identifies the biggest importer or exporter.
To discover high-growth global markets and optimize your business strategy:
Click Here
Pricing
- Single User License$ 1,995
- Department License$ 2,400
- Site License$ 3,120
- Global License$ 3,795

Leadership Perspectives from Industry Events
Search
Thought Leadership and Analyst Meet


Our Clients
6WResearch In News
- India Export Attractiveness Tracker 2026
- India Air Conditioner Market Set for Strong Rebound in 2026 After Weather-Led Correction and GST-Driven Recovery: 6Wresearch
- ADAS in India: How Automatic Emergency Braking, Blind Spot Detection & Driver Monitoring are Transforming Road Safety
- Doha a strategic location for EV manufacturing hub: IPA Qatar
- Demand for luxury TVs surging in the GCC, says Samsung
- Empowering Growth: The Thriving Journey of Bangladesh’s Cable Industry
Latest Reports
- Nicaragua RPG Gaming Market (2026-2032)
- New Zealand RPG Gaming Market (2026-2032)
- Netherlands RPG Gaming Market (2026-2032)
- Nauru RPG Gaming Market (2026-2032)
- Namibia RPG Gaming Market (2026-2032)
- Mozambique RPG Gaming Market (2026-2032)
- Montenegro RPG Gaming Market (2026-2032)
- Mongolia RPG Gaming Market (2026-2032)
- Monaco RPG Gaming Market (2026-2032)
- Micronesia RPG Gaming Market (2026-2032)
Industry Events and Analyst Meet

EV India Expo 2026

HIMTEX 2026

India Refining Summit 2026

India EV Show 2026

EV tech India Expo 2026
Whitepaper
- Middle East & Africa Commercial Security Market Click here to view more.
- Middle East & Africa Fire Safety Systems & Equipment Market Click here to view more.
- GCC Drone Market Click here to view more.
- Middle East Lighting Fixture Market Click here to view more.
- GCC Physical & Perimeter Security Market Click here to view more.