Slovenia Linen Yarn Market (2026-2032) | Segmentation, Share, Revenue, Size, Industry, Analysis, Companies, Outlook, Value, Trends, Forecast & Growth
Market Forecast By Products (Dry spun yarn, Wet spun yarn, Blended yarn), By Applications (Clothings, Beddings, Others) And Competitive Landscape
| Product Code: ETC5052106 | Publication Date: Nov 2023 | Updated Date: Apr 2026 | Product Type: Market Research Report | |
| Publisher: 6Wresearch | Author: Shubham Padhi | No. of Pages: 60 | No. of Figures: 30 | No. of Tables: 5 |
Slovenia Linen Yarn Market Size (2020-2030)
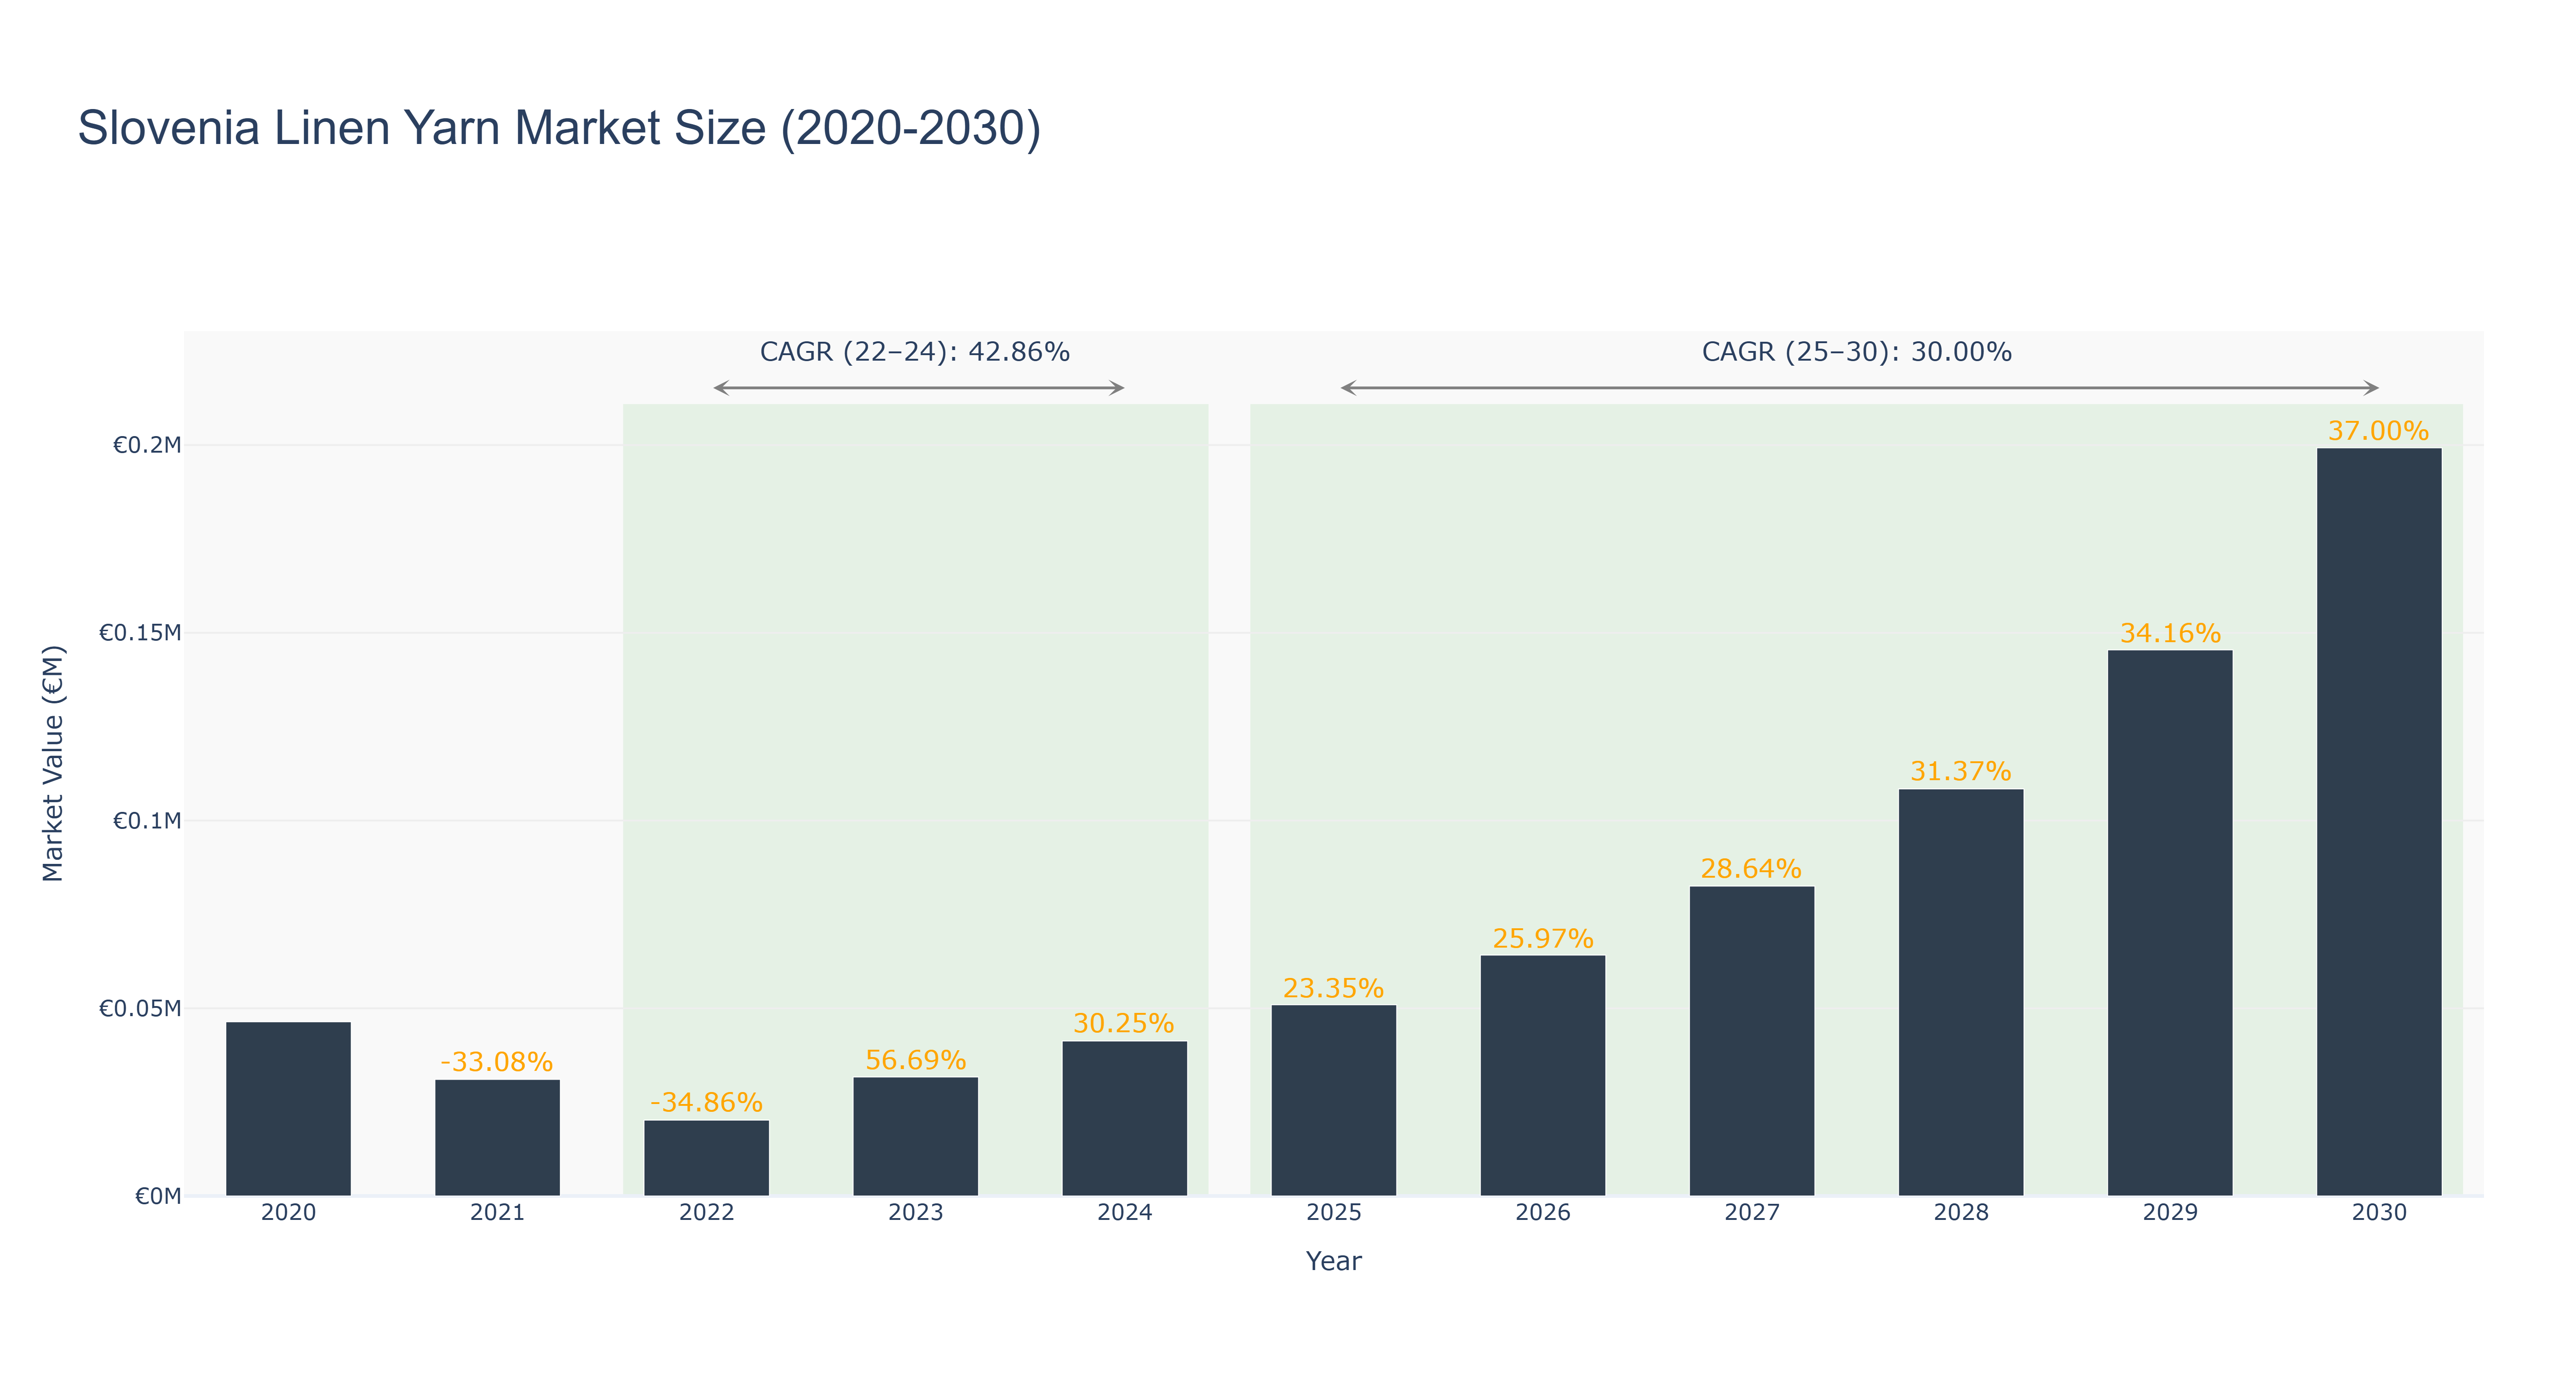
The Slovenia Linen Yarn Market experienced a peak market size of €0.20 million in 2030, showcasing a steady growth trajectory. The actual market size declined from €0.05 million in 2020 to €0.04 million in 2024, followed by a significant uptrend to reach €0.20 million by 2030. The CAGR for the period 2022-24 was 42.86%, indicating a rapid expansion phase, while the CAGR for 2025-30 is projected at 30.0%, suggesting sustained growth in the coming years. The market's growth can be attributed to increasing demand for sustainable and eco-friendly textile materials, driving the linen yarn market forward. Looking ahead, Slovenia is set to invest in modernizing linen yarn production facilities to enhance efficiency and meet growing global demand for premium linen products.
Slovenia Linen Yarn Market: Production & Trade Performance (2019-2025)
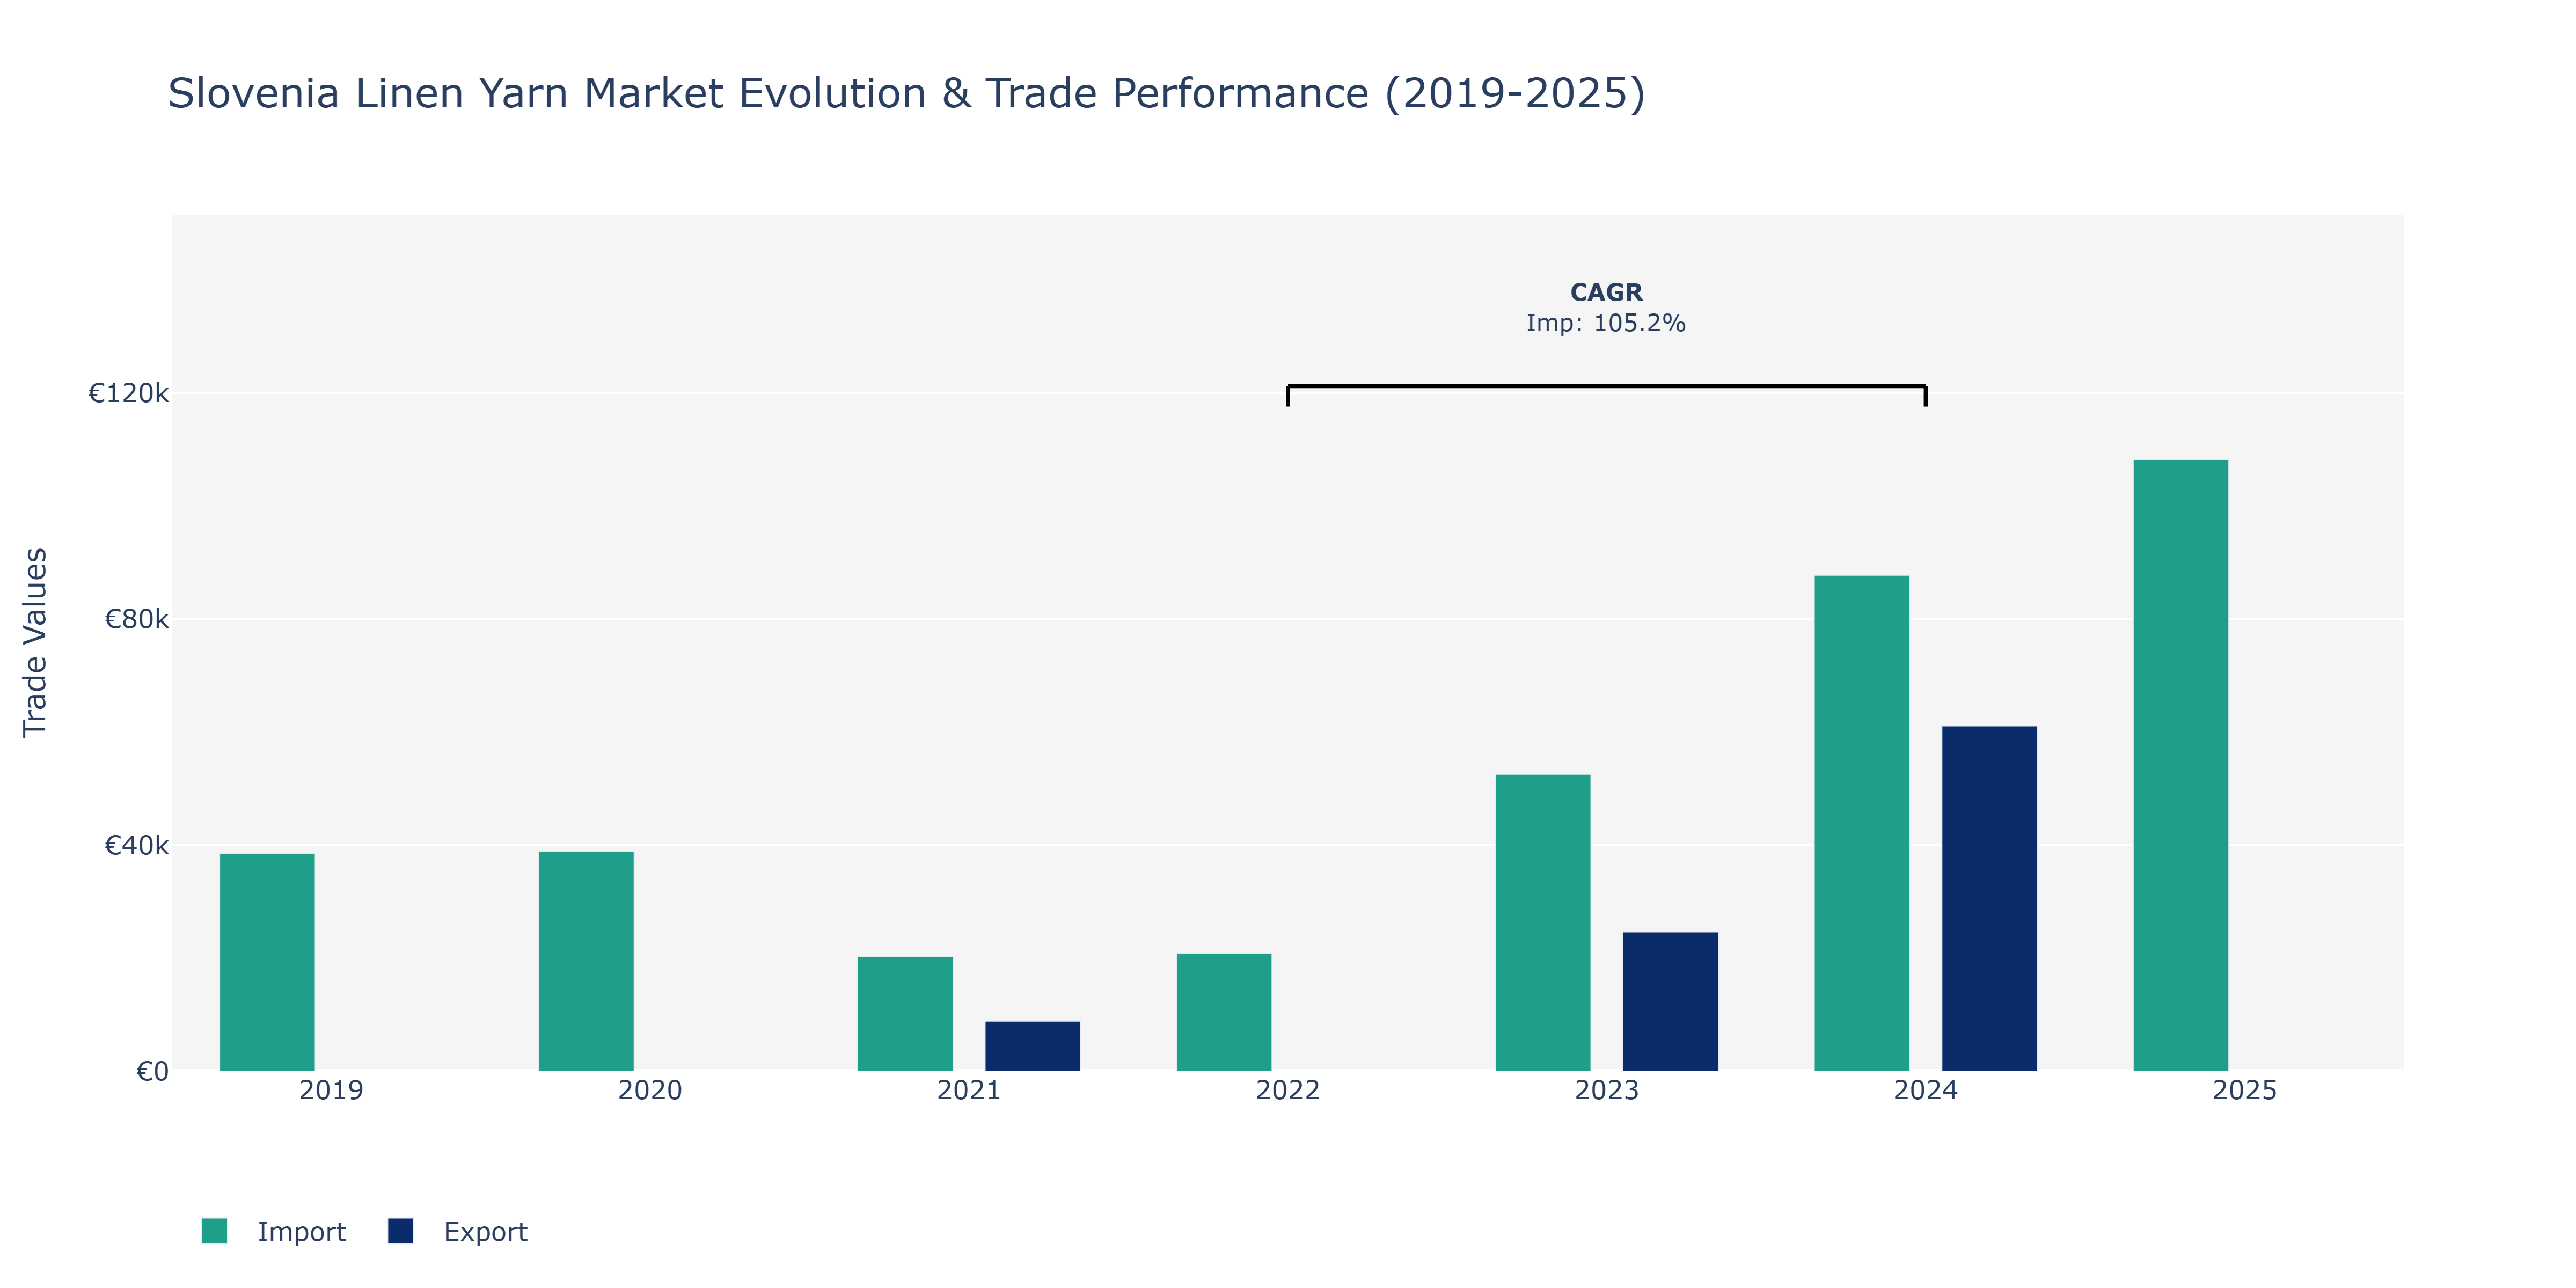
The Slovenia Linen Yarn Market showcased varied dynamics in Exports and Imports from 2019 to 2025. In 2019, Imports stood at €38.46 thousand, gradually increasing to €38.89 thousand in 2020. The market saw a notable shift in 2021 with Exports at €8.86 thousand and Imports at €20.25 thousand, indicating a strategic focus on global outreach. Subsequently, in 2022, Imports rose to €20.84 thousand, setting the stage for a remarkable surge in 2023 when Exports spiked to €24.65 thousand and Imports surged to €52.52 thousand. The peak performance emerged in 2024 with Exports soaring to €61.1 thousand and Imports reaching €87.75 thousand, highlighting robust market demand. However, in 2025, Imports further escalated to €108.24 thousand, reflecting sustained market growth. These fluctuations can be attributed to increasing demand for linen yarn in the textile industry, coupled with Slovenia's competitiveness in the global linen market segment, emphasizing the country's position as a key player in the industry.
Key Highlights of the Report:
- Slovenia Linen Yarn Market Outlook
- Market Size of Slovenia Linen Yarn Market, 2025
- Forecast of Slovenia Linen Yarn Market, 2032
- Historical Data and Forecast of Slovenia Linen Yarn Revenues & Volume for the Period 2022-2032F
- Slovenia Linen Yarn Market Trend Evolution
- Slovenia Linen Yarn Market Drivers and Challenges
- Slovenia Linen Yarn Price Trends
- Slovenia Linen Yarn Porter`s Five Forces
- Slovenia Linen Yarn Industry Life Cycle
- Historical Data and Forecast of Slovenia Linen Yarn Market Revenues & Volume By Products for the Period 2022-2032F
- Historical Data and Forecast of Slovenia Linen Yarn Market Revenues & Volume By Dry spun yarn for the Period 2022-2032F
- Historical Data and Forecast of Slovenia Linen Yarn Market Revenues & Volume By Wet spun yarn for the Period 2022-2032F
- Historical Data and Forecast of Slovenia Linen Yarn Market Revenues & Volume By Blended yarn for the Period 2022-2032F
- Historical Data and Forecast of Slovenia Linen Yarn Market Revenues & Volume By Applications for the Period 2022-2032F
- Historical Data and Forecast of Slovenia Linen Yarn Market Revenues & Volume By Clothings for the Period 2022-2032F
- Historical Data and Forecast of Slovenia Linen Yarn Market Revenues & Volume By Beddings for the Period 2022-2032F
- Historical Data and Forecast of Slovenia Linen Yarn Market Revenues & Volume By Others for the Period 2022-2032F
- Slovenia Linen Yarn Import Export Trade Statistics
- Market Opportunity Assessment By Products
- Market Opportunity Assessment By Applications
- Slovenia Linen Yarn Top Companies Market Share
- Slovenia Linen Yarn Competitive Benchmarking By Technical and Operational Parameters
- Slovenia Linen Yarn Company Profiles
- Slovenia Linen Yarn Key Strategic Recommendations
Frequently Asked Questions About the Market Study (FAQs):
6Wresearch actively monitors the Slovenia Linen Yarn Market and publishes its comprehensive annual report, highlighting emerging trends, growth drivers, revenue analysis, and forecast outlook. Our insights help businesses to make data-backed strategic decisions with ongoing market dynamics. Our analysts track relevent industries related to the Slovenia Linen Yarn Market, allowing our clients with actionable intelligence and reliable forecasts tailored to emerging regional needs.
Yes, we provide customisation as per your requirements. To learn more, feel free to contact us on sales@6wresearch.com
1 Executive Summary |
2 Introduction |
2.1 Key Highlights of the Report |
2.2 Report Description |
2.3 Market Scope & Segmentation |
2.4 Research Methodology |
2.5 Assumptions |
3 Slovenia Linen Yarn Market Overview |
3.1 Slovenia Country Macro Economic Indicators |
3.2 Slovenia Linen Yarn Market Revenues & Volume, 2022 & 2032F |
3.3 Slovenia Linen Yarn Market - Industry Life Cycle |
3.4 Slovenia Linen Yarn Market - Porter's Five Forces |
3.5 Slovenia Linen Yarn Market Revenues & Volume Share, By Products, 2022 & 2032F |
3.6 Slovenia Linen Yarn Market Revenues & Volume Share, By Applications, 2022 & 2032F |
4 Slovenia Linen Yarn Market Dynamics |
4.1 Impact Analysis |
4.2 Market Drivers |
4.2.1 Growing demand for sustainable and eco-friendly products |
4.2.2 Increasing awareness about the benefits of linen as a material |
4.2.3 Rising popularity of handmade and artisanal products |
4.3 Market Restraints |
4.3.1 Fluctuations in raw material prices |
4.3.2 Competition from synthetic fibers and other natural fibers |
4.3.3 Limited availability of skilled labor for linen yarn production |
5 Slovenia Linen Yarn Market Trends |
6 Slovenia Linen Yarn Market Segmentations |
6.1 Slovenia Linen Yarn Market, By Products |
6.1.1 Overview and Analysis |
6.1.2 Slovenia Linen Yarn Market Revenues & Volume, By Dry spun yarn, 2022-2032F |
6.1.3 Slovenia Linen Yarn Market Revenues & Volume, By Wet spun yarn, 2022-2032F |
6.1.4 Slovenia Linen Yarn Market Revenues & Volume, By Blended yarn, 2022-2032F |
6.2 Slovenia Linen Yarn Market, By Applications |
6.2.1 Overview and Analysis |
6.2.2 Slovenia Linen Yarn Market Revenues & Volume, By Clothings, 2022-2032F |
6.2.3 Slovenia Linen Yarn Market Revenues & Volume, By Beddings, 2022-2032F |
6.2.4 Slovenia Linen Yarn Market Revenues & Volume, By Others, 2022-2032F |
7 Slovenia Linen Yarn Market Import-Export Trade Statistics |
7.1 Slovenia Linen Yarn Market Export to Major Countries |
7.2 Slovenia Linen Yarn Market Imports from Major Countries |
8 Slovenia Linen Yarn Market Key Performance Indicators |
8.1 Percentage of organic and sustainable linen yarn production |
8.2 Number of new product launches using linen yarn |
8.3 Average selling price of linen yarn compared to other fibers |
9 Slovenia Linen Yarn Market - Opportunity Assessment |
9.1 Slovenia Linen Yarn Market Opportunity Assessment, By Products, 2022 & 2032F |
9.2 Slovenia Linen Yarn Market Opportunity Assessment, By Applications, 2022 & 2032F |
10 Slovenia Linen Yarn Market - Competitive Landscape |
10.1 Slovenia Linen Yarn Market Revenue Share, By Companies, 2025 |
10.2 Slovenia Linen Yarn Market Competitive Benchmarking, By Operating and Technical Parameters |
11 Company Profiles |
12 Recommendations | 13 Disclaimer |
Global Go To Market Strategy - 2030
Export potential enables firms to identify high-growth global markets with greater confidence by combining advanced trade intelligence with a structured quantitative methodology. The framework analyzes emerging demand trends and country-level import patterns while integrating macroeconomic and trade datasets such as GDP and population forecasts, bilateral import–export flows, tariff structures, elasticity differentials between developed and developing economies, geographic distance, and import demand projections. Using weighted trade values from 2020–2024 as the base period to project country-to-country export potential for 2030, these inputs are operationalized through calculated drivers such as gravity model parameters, tariff impact factors, and projected GDP per-capita growth. Through an analysis of hidden potentials, demand hotspots, and market conditions that are most favorable to success, this method enables firms to focus on target countries, maximize returns, and global expansion with data, backed by accuracy.
By factoring in the projected importer demand gap that is currently unmet and could be potential opportunity, it identifies the potential for the Exporter (Country) among 190 countries, against the general trade analysis, which identifies the biggest importer or exporter.
To discover high-growth global markets and optimize your business strategy:
Click Here
Pricing
- Single User License$ 1,995
- Department License$ 2,400
- Site License$ 3,120
- Global License$ 3,795

Leadership Perspectives from Industry Events
Search
Thought Leadership and Analyst Meet


Our Clients
6WResearch In News
- India Export Attractiveness Tracker 2026
- India Air Conditioner Market Set for Strong Rebound in 2026 After Weather-Led Correction and GST-Driven Recovery: 6Wresearch
- ADAS in India: How Automatic Emergency Braking, Blind Spot Detection & Driver Monitoring are Transforming Road Safety
- Doha a strategic location for EV manufacturing hub: IPA Qatar
- Demand for luxury TVs surging in the GCC, says Samsung
- Empowering Growth: The Thriving Journey of Bangladesh’s Cable Industry
Latest Reports
- Rwanda Transmission Electron Microscope Market (2026-2032)
- Republic of Moldova Transmission Electron Microscope Market (2026-2032)
- Republic of Macedonia Transmission Electron Microscope Market (2026-2032)
- Portugal Transmission Electron Microscope Market (2026-2032)
- Paraguay Transmission Electron Microscope Market (2026-2032)
- Papua New Guinea Transmission Electron Microscope Market (2026-2032)
- Panama Transmission Electron Microscope Market (2026-2032)
- Palau Transmission Electron Microscope Market (2026-2032)
- Norway Transmission Electron Microscope Market (2026-2032)
- North Korea Transmission Electron Microscope Market (2026-2032)
Industry Events and Analyst Meet

EV India Expo 2026

HIMTEX 2026

India Refining Summit 2026

India EV Show 2026

EV tech India Expo 2026
Whitepaper
- Middle East & Africa Commercial Security Market Click here to view more.
- Middle East & Africa Fire Safety Systems & Equipment Market Click here to view more.
- GCC Drone Market Click here to view more.
- Middle East Lighting Fixture Market Click here to view more.
- GCC Physical & Perimeter Security Market Click here to view more.