Slovenia Potassium Alum Market (2026-2032) | Analysis, Value, Outlook, Share, Forecast, Segmentation, Revenue, Companies, Trends, Industry, Growth & Size
Market Forecast By Source (Natural, Synthetic), By Form (Crystal Foam, Powder Foam), By Application (Cosmetics, Pharmaceutical, Dyeing, Leather Tanning, Water Purification, Food Process, Others) And Competitive Landscape
| Product Code: ETC4878541 | Publication Date: Nov 2023 | Updated Date: Apr 2026 | Product Type: Market Research Report | |
| Publisher: 6Wresearch | Author: Shubham Padhi | No. of Pages: 60 | No. of Figures: 30 | No. of Tables: 5 |
Slovenia Potassium Alum Market Size (2020-2030)
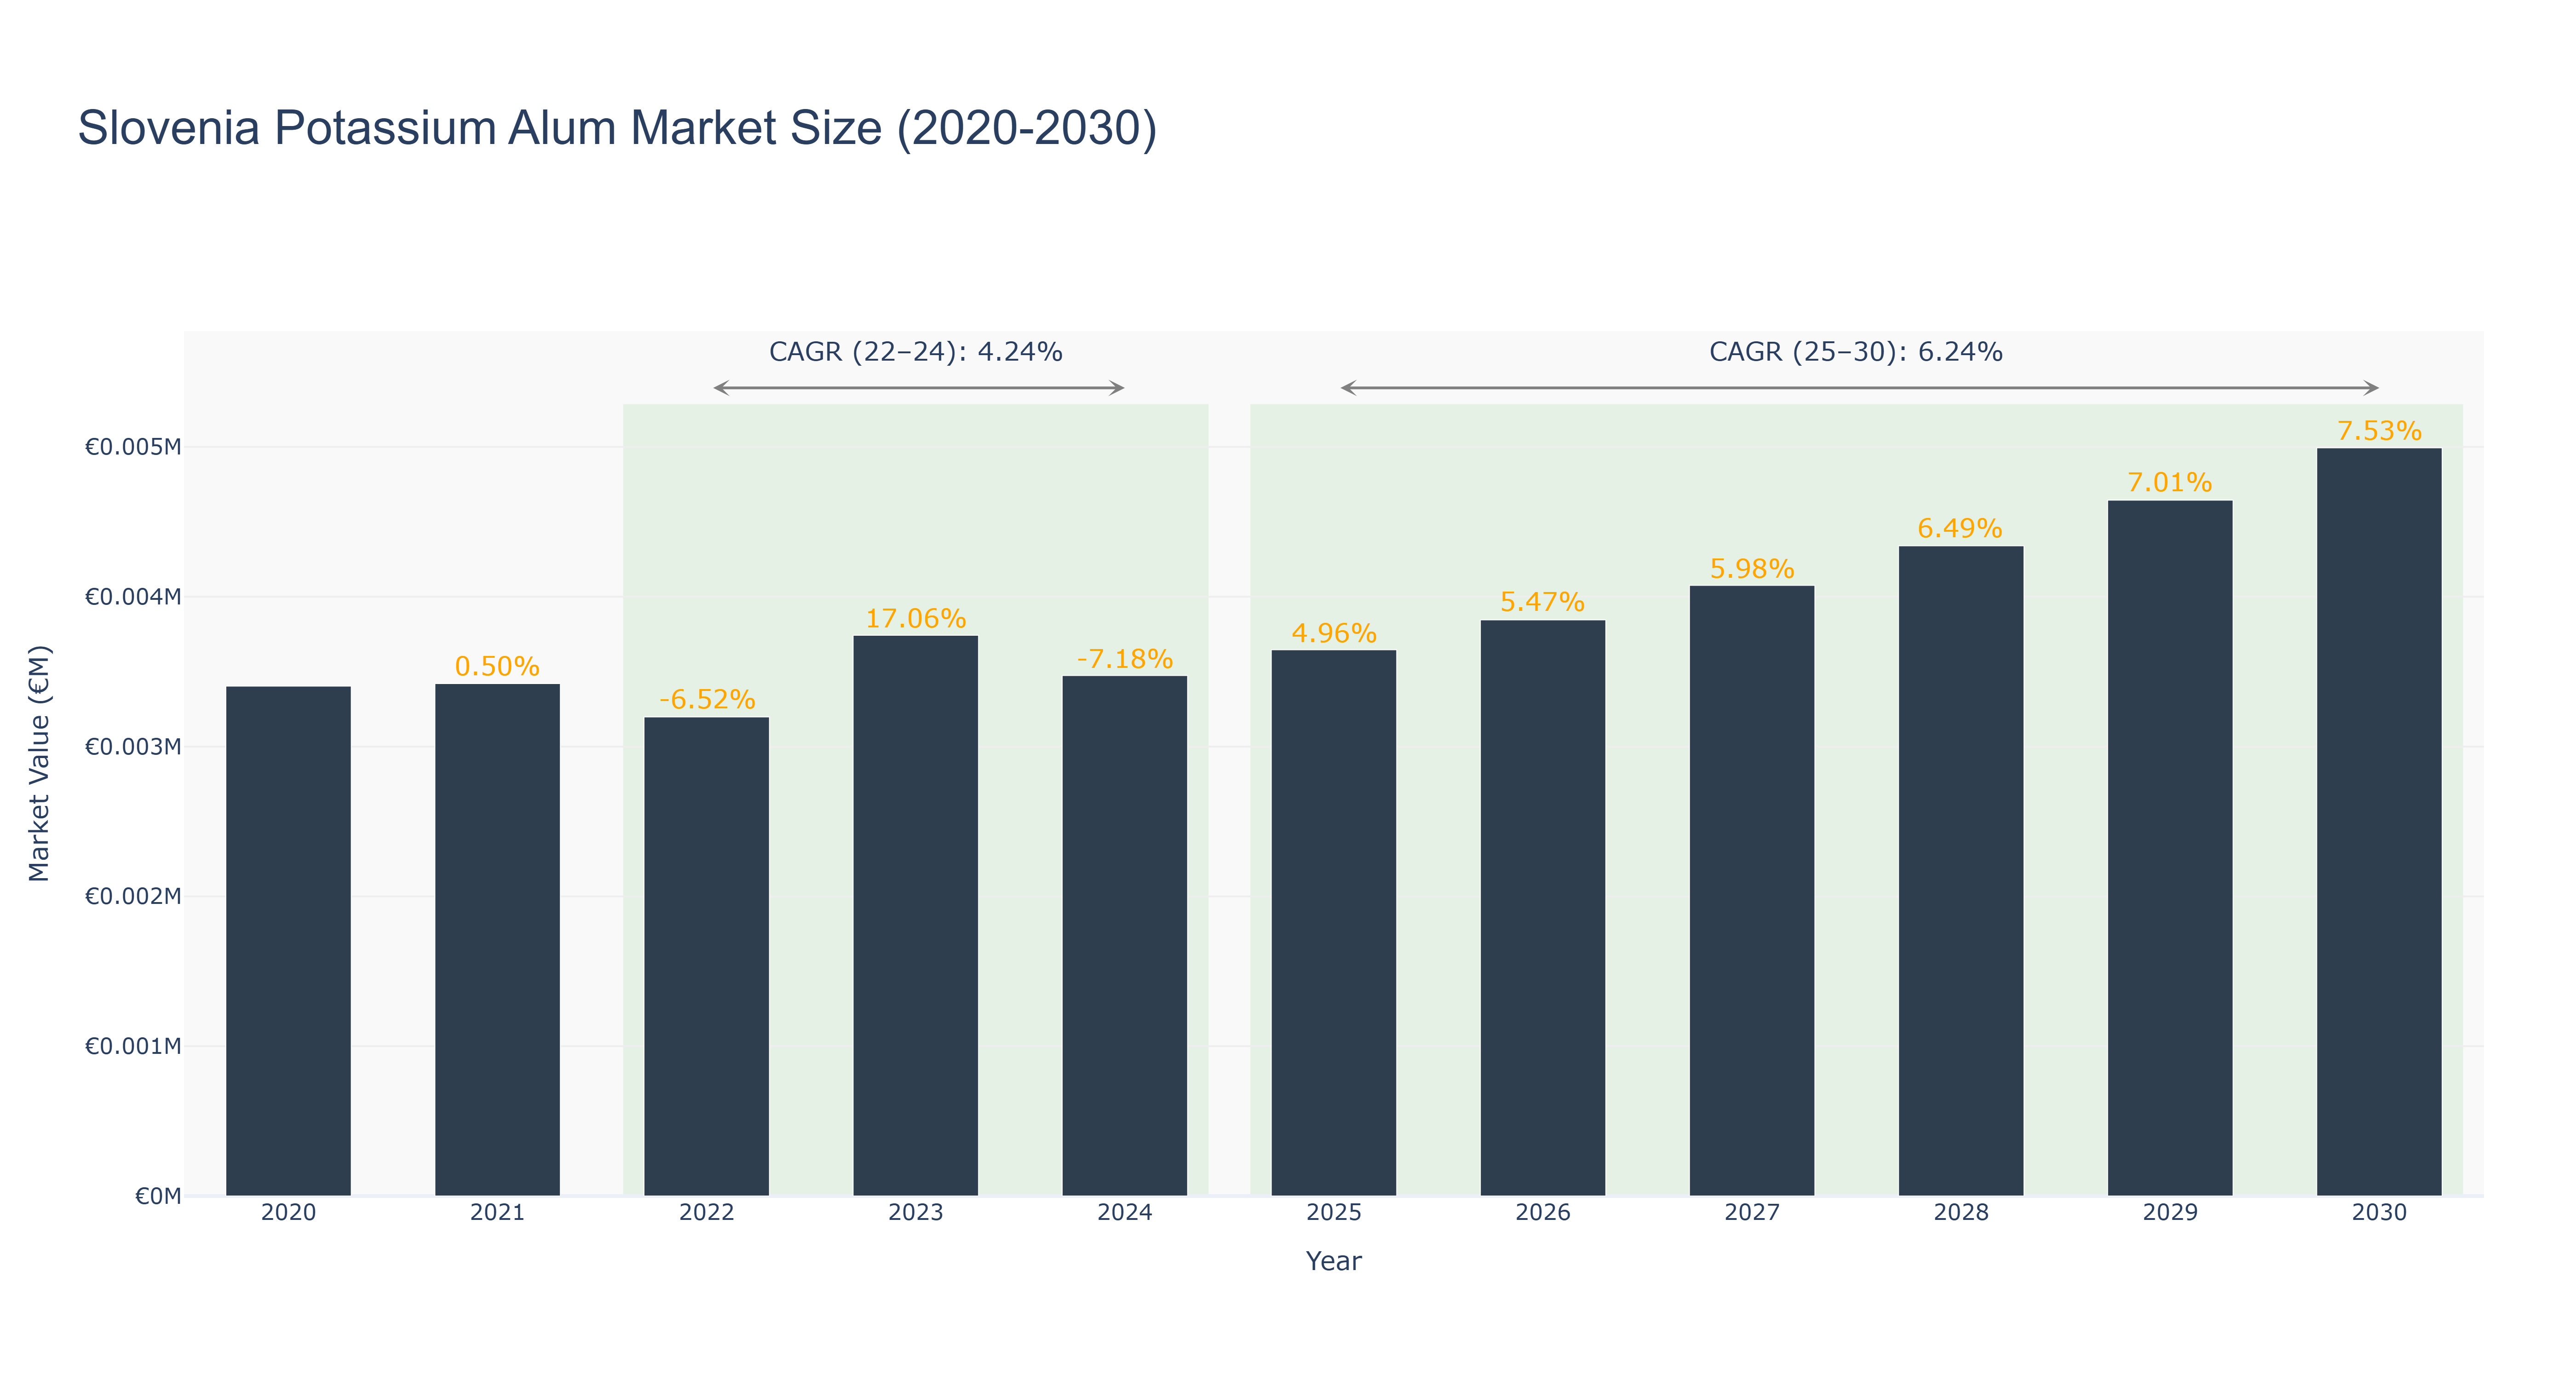
The Slovenia Potassium Alum Market has demonstrated a fluctuating trajectory in recent years, with a notable peak market size of €3.74 thousand in 2023. Actual data from 2022 to 2024 reveals a decline in market size from €3.20 thousand in 2022 to €3.47 thousand in 2024, resulting in a modest CAGR of 4.24%. This period experienced volatility, influenced by factors such as supply chain disruptions and changing demand dynamics. Transitioning to the forecasted period from 2025 to 2030, the market is expected to grow steadily, with projected sizes increasing from €3.65 thousand in 2025 to €4.99 thousand by 2030, reflecting a CAGR of 6.24%. This growth is likely driven by rising applications in water treatment and food processing. As Slovenia continues to invest in sustainable practices, the potassium alum market is poised for further expansion, supported by increasing regulatory focus on environmental standards.
Slovenia Potassium Alum Market: Production & Trade Performance (2019-2025)
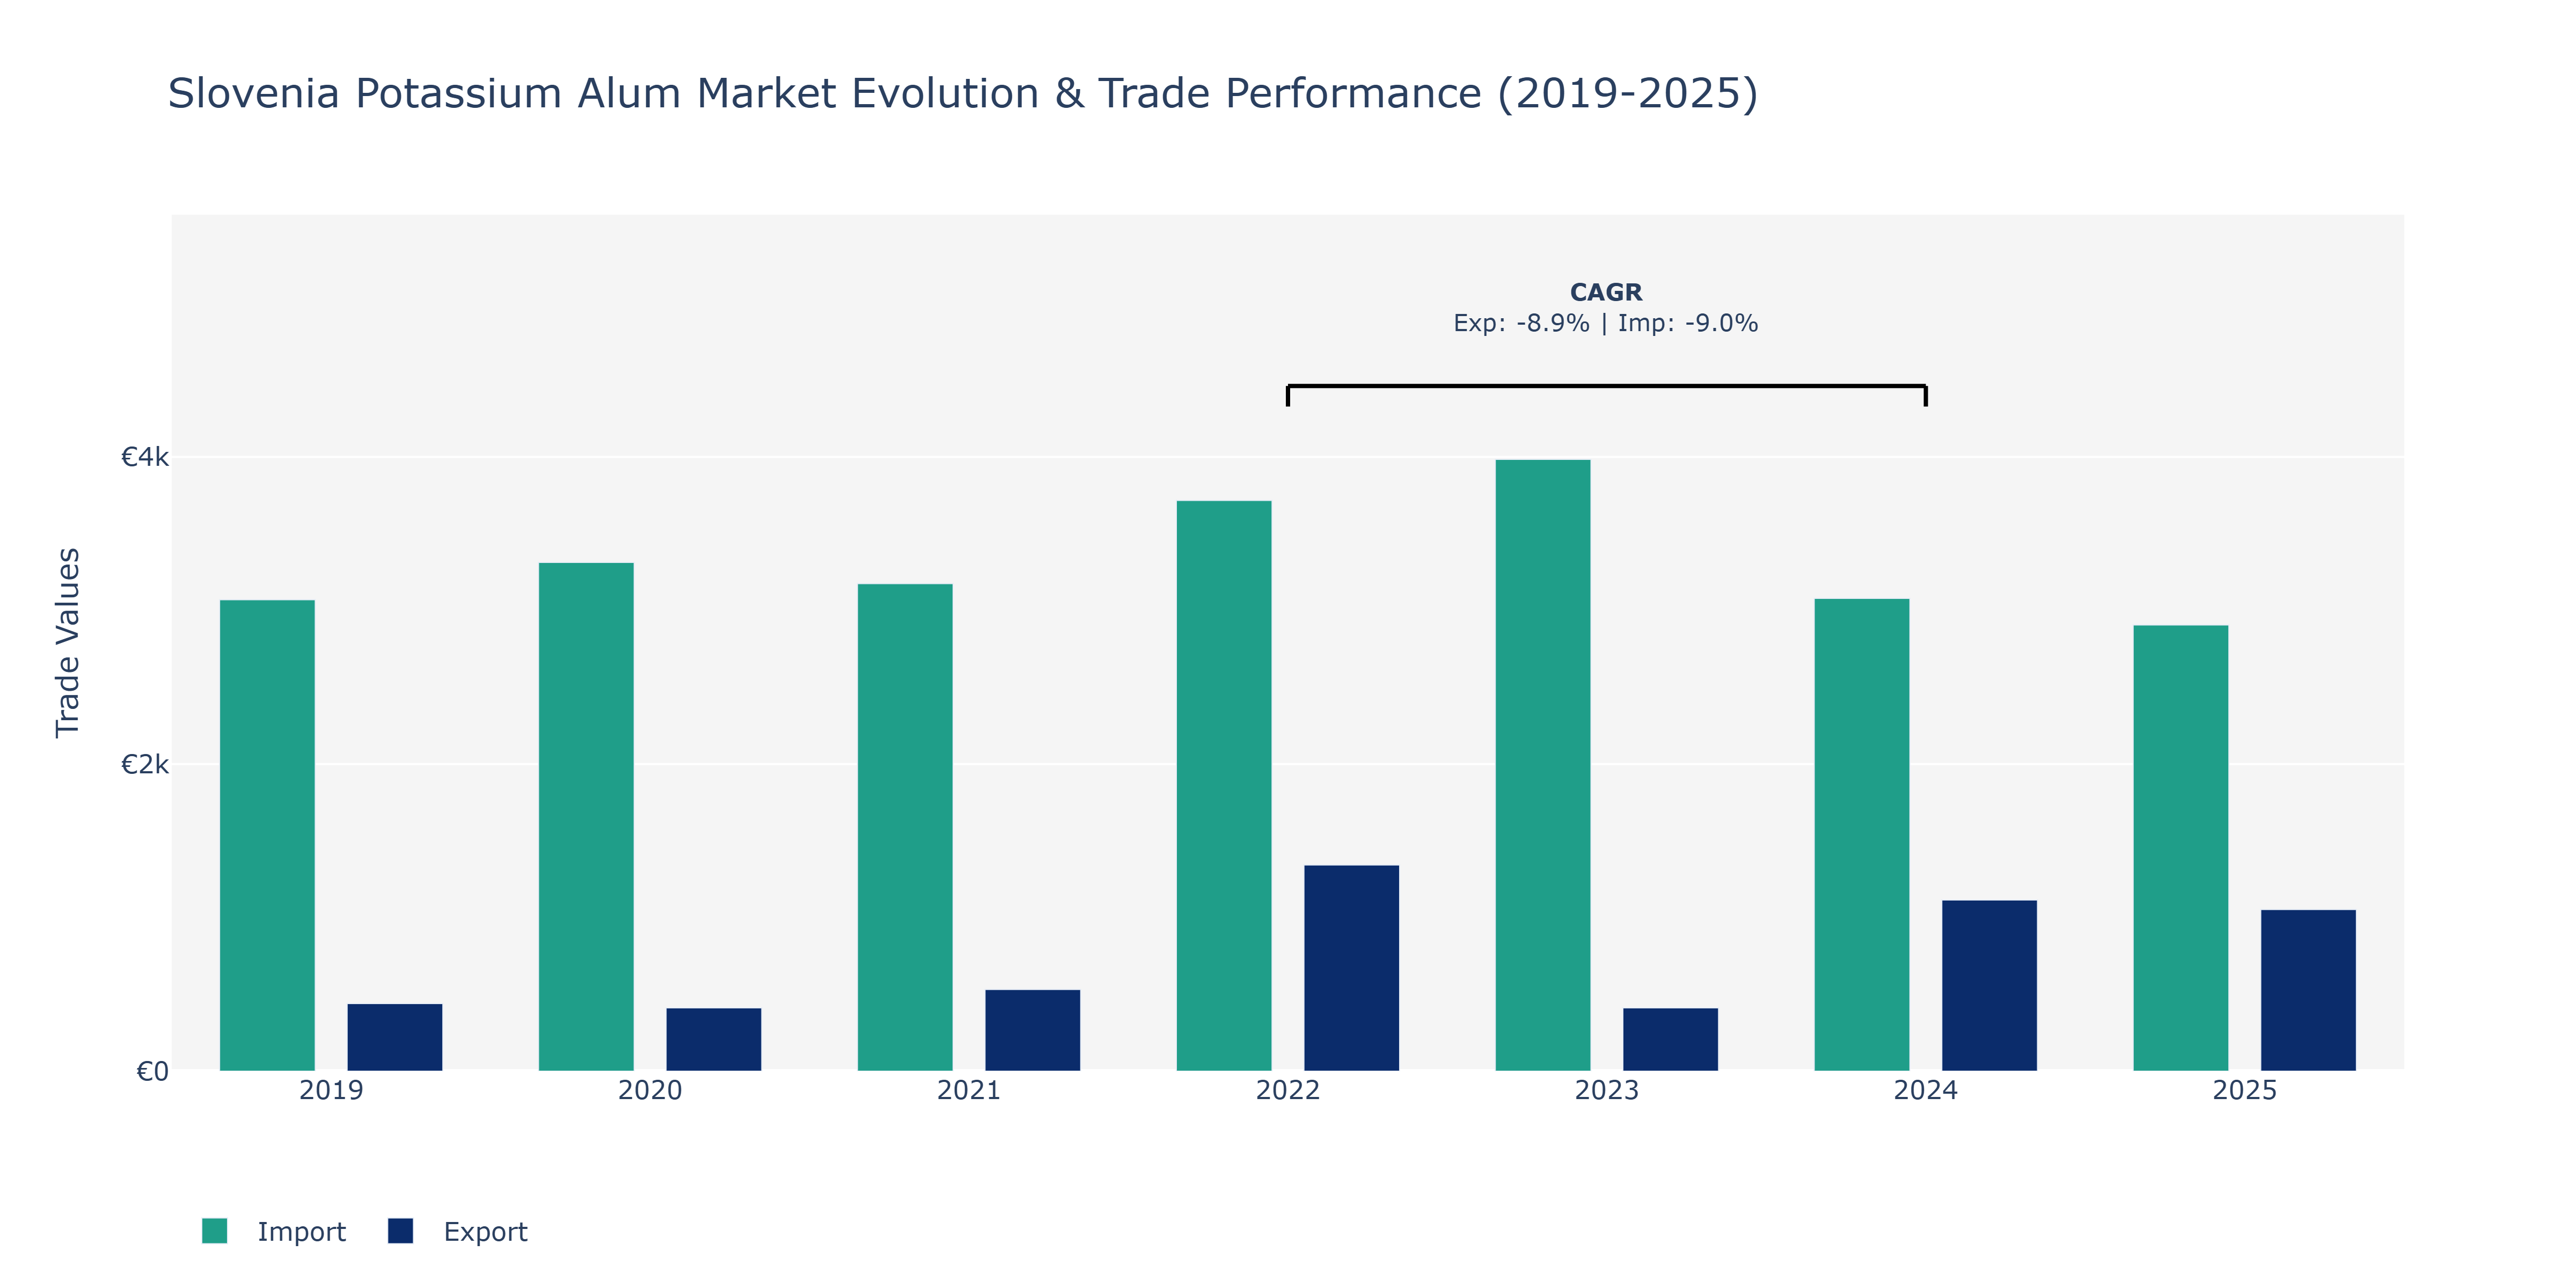
In the Slovenia Potassium Alum Market, exports demonstrated notable fluctuations over the years, starting at €440 million in 2019 and experiencing a decline to €412 million in 2020 before a substantial increase to €532 million in 2021. The peak point was observed in 2022 at €1.34 billion, followed by a decrease to €412 million in 2023 and then a rise to €1.11 billion in 2024. Conversely, imports also showcased variations, beginning at €3.07 thousand in 2019, rising to €3.31 thousand in 2020, and then decreasing to €3.17 thousand in 2021. The highest value was recorded in 2023 at €3.98 thousand, followed by a slight decline to €3.08 thousand in 2024 and further to €2.9 thousand in 2025. These fluctuations in exports and imports could be attributed to shifts in global demand, price changes in the alum market, and evolving trade agreements impacting Slovenia's position in the industry. Further analysis of production capacities and international trade policies could provide insights into these trends.
Key Highlights of the Report:
- Slovenia Potassium Alum Market Outlook
- Market Size of Slovenia Potassium Alum Market, 2025
- Forecast of Slovenia Potassium Alum Market, 2032
- Historical Data and Forecast of Slovenia Potassium Alum Revenues & Volume for the Period 2022-2032F
- Slovenia Potassium Alum Market Trend Evolution
- Slovenia Potassium Alum Market Drivers and Challenges
- Slovenia Potassium Alum Price Trends
- Slovenia Potassium Alum Porter`s Five Forces
- Slovenia Potassium Alum Industry Life Cycle
- Historical Data and Forecast of Slovenia Potassium Alum Market Revenues & Volume By Source for the Period 2022-2032F
- Historical Data and Forecast of Slovenia Potassium Alum Market Revenues & Volume By Natural for the Period 2022-2032F
- Historical Data and Forecast of Slovenia Potassium Alum Market Revenues & Volume By Synthetic for the Period 2022-2032F
- Historical Data and Forecast of Slovenia Potassium Alum Market Revenues & Volume By Form for the Period 2022-2032F
- Historical Data and Forecast of Slovenia Potassium Alum Market Revenues & Volume By Crystal Foam for the Period 2022-2032F
- Historical Data and Forecast of Slovenia Potassium Alum Market Revenues & Volume By Powder Foam for the Period 2022-2032F
- Historical Data and Forecast of Slovenia Potassium Alum Market Revenues & Volume By Application for the Period 2022-2032F
- Historical Data and Forecast of Slovenia Potassium Alum Market Revenues & Volume By Cosmetics for the Period 2022-2032F
- Historical Data and Forecast of Slovenia Potassium Alum Market Revenues & Volume By Pharmaceutical for the Period 2022-2032F
- Historical Data and Forecast of Slovenia Potassium Alum Market Revenues & Volume By Dyeing for the Period 2022-2032F
- Historical Data and Forecast of Slovenia Potassium Alum Market Revenues & Volume By Leather Tanning for the Period 2022-2032F
- Historical Data and Forecast of Slovenia Potassium Alum Market Revenues & Volume By Water Purification for the Period 2022-2032F
- Historical Data and Forecast of Slovenia Potassium Alum Market Revenues & Volume By Food Process for the Period 2022-2032F
- Historical Data and Forecast of Slovenia Potassium Alum Market Revenues & Volume By Others for the Period 2022-2032F
- Slovenia Potassium Alum Import Export Trade Statistics
- Market Opportunity Assessment By Source
- Market Opportunity Assessment By Form
- Market Opportunity Assessment By Application
- Slovenia Potassium Alum Top Companies Market Share
- Slovenia Potassium Alum Competitive Benchmarking By Technical and Operational Parameters
- Slovenia Potassium Alum Company Profiles
- Slovenia Potassium Alum Key Strategic Recommendations
Frequently Asked Questions About the Market Study (FAQs):
6Wresearch actively monitors the Slovenia Potassium Alum Market and publishes its comprehensive annual report, highlighting emerging trends, growth drivers, revenue analysis, and forecast outlook. Our insights help businesses to make data-backed strategic decisions with ongoing market dynamics. Our analysts track relevent industries related to the Slovenia Potassium Alum Market, allowing our clients with actionable intelligence and reliable forecasts tailored to emerging regional needs.
Yes, we provide customisation as per your requirements. To learn more, feel free to contact us on sales@6wresearch.com
1 Executive Summary |
2 Introduction |
2.1 Key Highlights of the Report |
2.2 Report Description |
2.3 Market Scope & Segmentation |
2.4 Research Methodology |
2.5 Assumptions |
3 Slovenia Potassium Alum Market Overview |
3.1 Slovenia Country Macro Economic Indicators |
3.2 Slovenia Potassium Alum Market Revenues & Volume, 2022 & 2032F |
3.3 Slovenia Potassium Alum Market - Industry Life Cycle |
3.4 Slovenia Potassium Alum Market - Porter's Five Forces |
3.5 Slovenia Potassium Alum Market Revenues & Volume Share, By Source, 2022 & 2032F |
3.6 Slovenia Potassium Alum Market Revenues & Volume Share, By Form, 2022 & 2032F |
3.7 Slovenia Potassium Alum Market Revenues & Volume Share, By Application, 2022 & 2032F |
4 Slovenia Potassium Alum Market Dynamics |
4.1 Impact Analysis |
4.2 Market Drivers |
4.2.1 Increasing awareness about the benefits of potassium alum as a natural deodorant and antiseptic |
4.2.2 Growing demand for natural and eco-friendly personal care products |
4.2.3 Rising health consciousness among consumers in Slovenia |
4.3 Market Restraints |
4.3.1 Limited availability of potassium alum mines in Slovenia |
4.3.2 Competition from synthetic deodorants and antiseptics in the market |
4.3.3 Fluctuating prices of raw materials impacting production costs |
5 Slovenia Potassium Alum Market Trends |
6 Slovenia Potassium Alum Market Segmentations |
6.1 Slovenia Potassium Alum Market, By Source |
6.1.1 Overview and Analysis |
6.1.2 Slovenia Potassium Alum Market Revenues & Volume, By Natural, 2022-2032F |
6.1.3 Slovenia Potassium Alum Market Revenues & Volume, By Synthetic, 2022-2032F |
6.2 Slovenia Potassium Alum Market, By Form |
6.2.1 Overview and Analysis |
6.2.2 Slovenia Potassium Alum Market Revenues & Volume, By Crystal Foam, 2022-2032F |
6.2.3 Slovenia Potassium Alum Market Revenues & Volume, By Powder Foam, 2022-2032F |
6.3 Slovenia Potassium Alum Market, By Application |
6.3.1 Overview and Analysis |
6.3.2 Slovenia Potassium Alum Market Revenues & Volume, By Cosmetics, 2022-2032F |
6.3.3 Slovenia Potassium Alum Market Revenues & Volume, By Pharmaceutical, 2022-2032F |
6.3.4 Slovenia Potassium Alum Market Revenues & Volume, By Dyeing, 2022-2032F |
6.3.5 Slovenia Potassium Alum Market Revenues & Volume, By Leather Tanning, 2022-2032F |
6.3.6 Slovenia Potassium Alum Market Revenues & Volume, By Water Purification, 2022-2032F |
6.3.7 Slovenia Potassium Alum Market Revenues & Volume, By Food Process, 2022-2032F |
7 Slovenia Potassium Alum Market Import-Export Trade Statistics |
7.1 Slovenia Potassium Alum Market Export to Major Countries |
7.2 Slovenia Potassium Alum Market Imports from Major Countries |
8 Slovenia Potassium Alum Market Key Performance Indicators |
8.1 Consumer engagement and satisfaction with potassium alum products |
8.2 Number of new product launches and innovations in the potassium alum market |
8.3 Adoption rate of potassium alum in personal care routines in Slovenia |
9 Slovenia Potassium Alum Market - Opportunity Assessment |
9.1 Slovenia Potassium Alum Market Opportunity Assessment, By Source, 2022 & 2032F |
9.2 Slovenia Potassium Alum Market Opportunity Assessment, By Form, 2022 & 2032F |
9.3 Slovenia Potassium Alum Market Opportunity Assessment, By Application, 2022 & 2032F |
10 Slovenia Potassium Alum Market - Competitive Landscape |
10.1 Slovenia Potassium Alum Market Revenue Share, By Companies, 2025 |
10.2 Slovenia Potassium Alum Market Competitive Benchmarking, By Operating and Technical Parameters |
11 Company Profiles |
12 Recommendations | 13 Disclaimer |
Global Go To Market Strategy - 2030
Export potential enables firms to identify high-growth global markets with greater confidence by combining advanced trade intelligence with a structured quantitative methodology. The framework analyzes emerging demand trends and country-level import patterns while integrating macroeconomic and trade datasets such as GDP and population forecasts, bilateral import–export flows, tariff structures, elasticity differentials between developed and developing economies, geographic distance, and import demand projections. Using weighted trade values from 2020–2024 as the base period to project country-to-country export potential for 2030, these inputs are operationalized through calculated drivers such as gravity model parameters, tariff impact factors, and projected GDP per-capita growth. Through an analysis of hidden potentials, demand hotspots, and market conditions that are most favorable to success, this method enables firms to focus on target countries, maximize returns, and global expansion with data, backed by accuracy.
By factoring in the projected importer demand gap that is currently unmet and could be potential opportunity, it identifies the potential for the Exporter (Country) among 190 countries, against the general trade analysis, which identifies the biggest importer or exporter.
To discover high-growth global markets and optimize your business strategy:
Click Here
Pricing
- Single User License$ 1,995
- Department License$ 2,400
- Site License$ 3,120
- Global License$ 3,795

Leadership Perspectives from Industry Events
Search
Thought Leadership and Analyst Meet


Our Clients
6WResearch In News
- India Export Attractiveness Tracker 2026
- India Air Conditioner Market Set for Strong Rebound in 2026 After Weather-Led Correction and GST-Driven Recovery: 6Wresearch
- ADAS in India: How Automatic Emergency Braking, Blind Spot Detection & Driver Monitoring are Transforming Road Safety
- Doha a strategic location for EV manufacturing hub: IPA Qatar
- Demand for luxury TVs surging in the GCC, says Samsung
- Empowering Growth: The Thriving Journey of Bangladesh’s Cable Industry
Latest Reports
- Nicaragua RPG Gaming Market (2026-2032)
- New Zealand RPG Gaming Market (2026-2032)
- Netherlands RPG Gaming Market (2026-2032)
- Nauru RPG Gaming Market (2026-2032)
- Namibia RPG Gaming Market (2026-2032)
- Mozambique RPG Gaming Market (2026-2032)
- Montenegro RPG Gaming Market (2026-2032)
- Mongolia RPG Gaming Market (2026-2032)
- Monaco RPG Gaming Market (2026-2032)
- Micronesia RPG Gaming Market (2026-2032)
Industry Events and Analyst Meet

EV India Expo 2026

HIMTEX 2026

India Refining Summit 2026

India EV Show 2026

EV tech India Expo 2026
Whitepaper
- Middle East & Africa Commercial Security Market Click here to view more.
- Middle East & Africa Fire Safety Systems & Equipment Market Click here to view more.
- GCC Drone Market Click here to view more.
- Middle East Lighting Fixture Market Click here to view more.
- GCC Physical & Perimeter Security Market Click here to view more.