Slovenia Steel Drawn Wire Market (2026-2032) | Value, Companies, Industry, Analysis, Growth, Outlook, Size & Revenue, Share, Forecast, Competitive Landscape, Segmentation, Trends
Market Forecast By Product Type (Carbon Steel, Stainless Steel, Alloy Steel), By Diameter (Up to 5 mm, 6-10 mm, 11-15 mm, 16-20 mm, Above 20 mm), By End-user (Automotive, Construction, Military, Telecom, Power & Energy, Heavy Machinery, Others (Aviation, Agriculture, etc.)), By Distribution Channel (Direct Sales, Indirect Sales) And Competitive Landscape
| Product Code: ETC9328264 | Publication Date: Sep 2024 | Updated Date: Apr 2026 | Product Type: Market Research Report | |
| Publisher: 6Wresearch | Author: Dhaval Chaurasia | No. of Pages: 75 | No. of Figures: 35 | No. of Tables: 20 |
Slovenia Steel Drawn Wire Market Size (2020-2030)
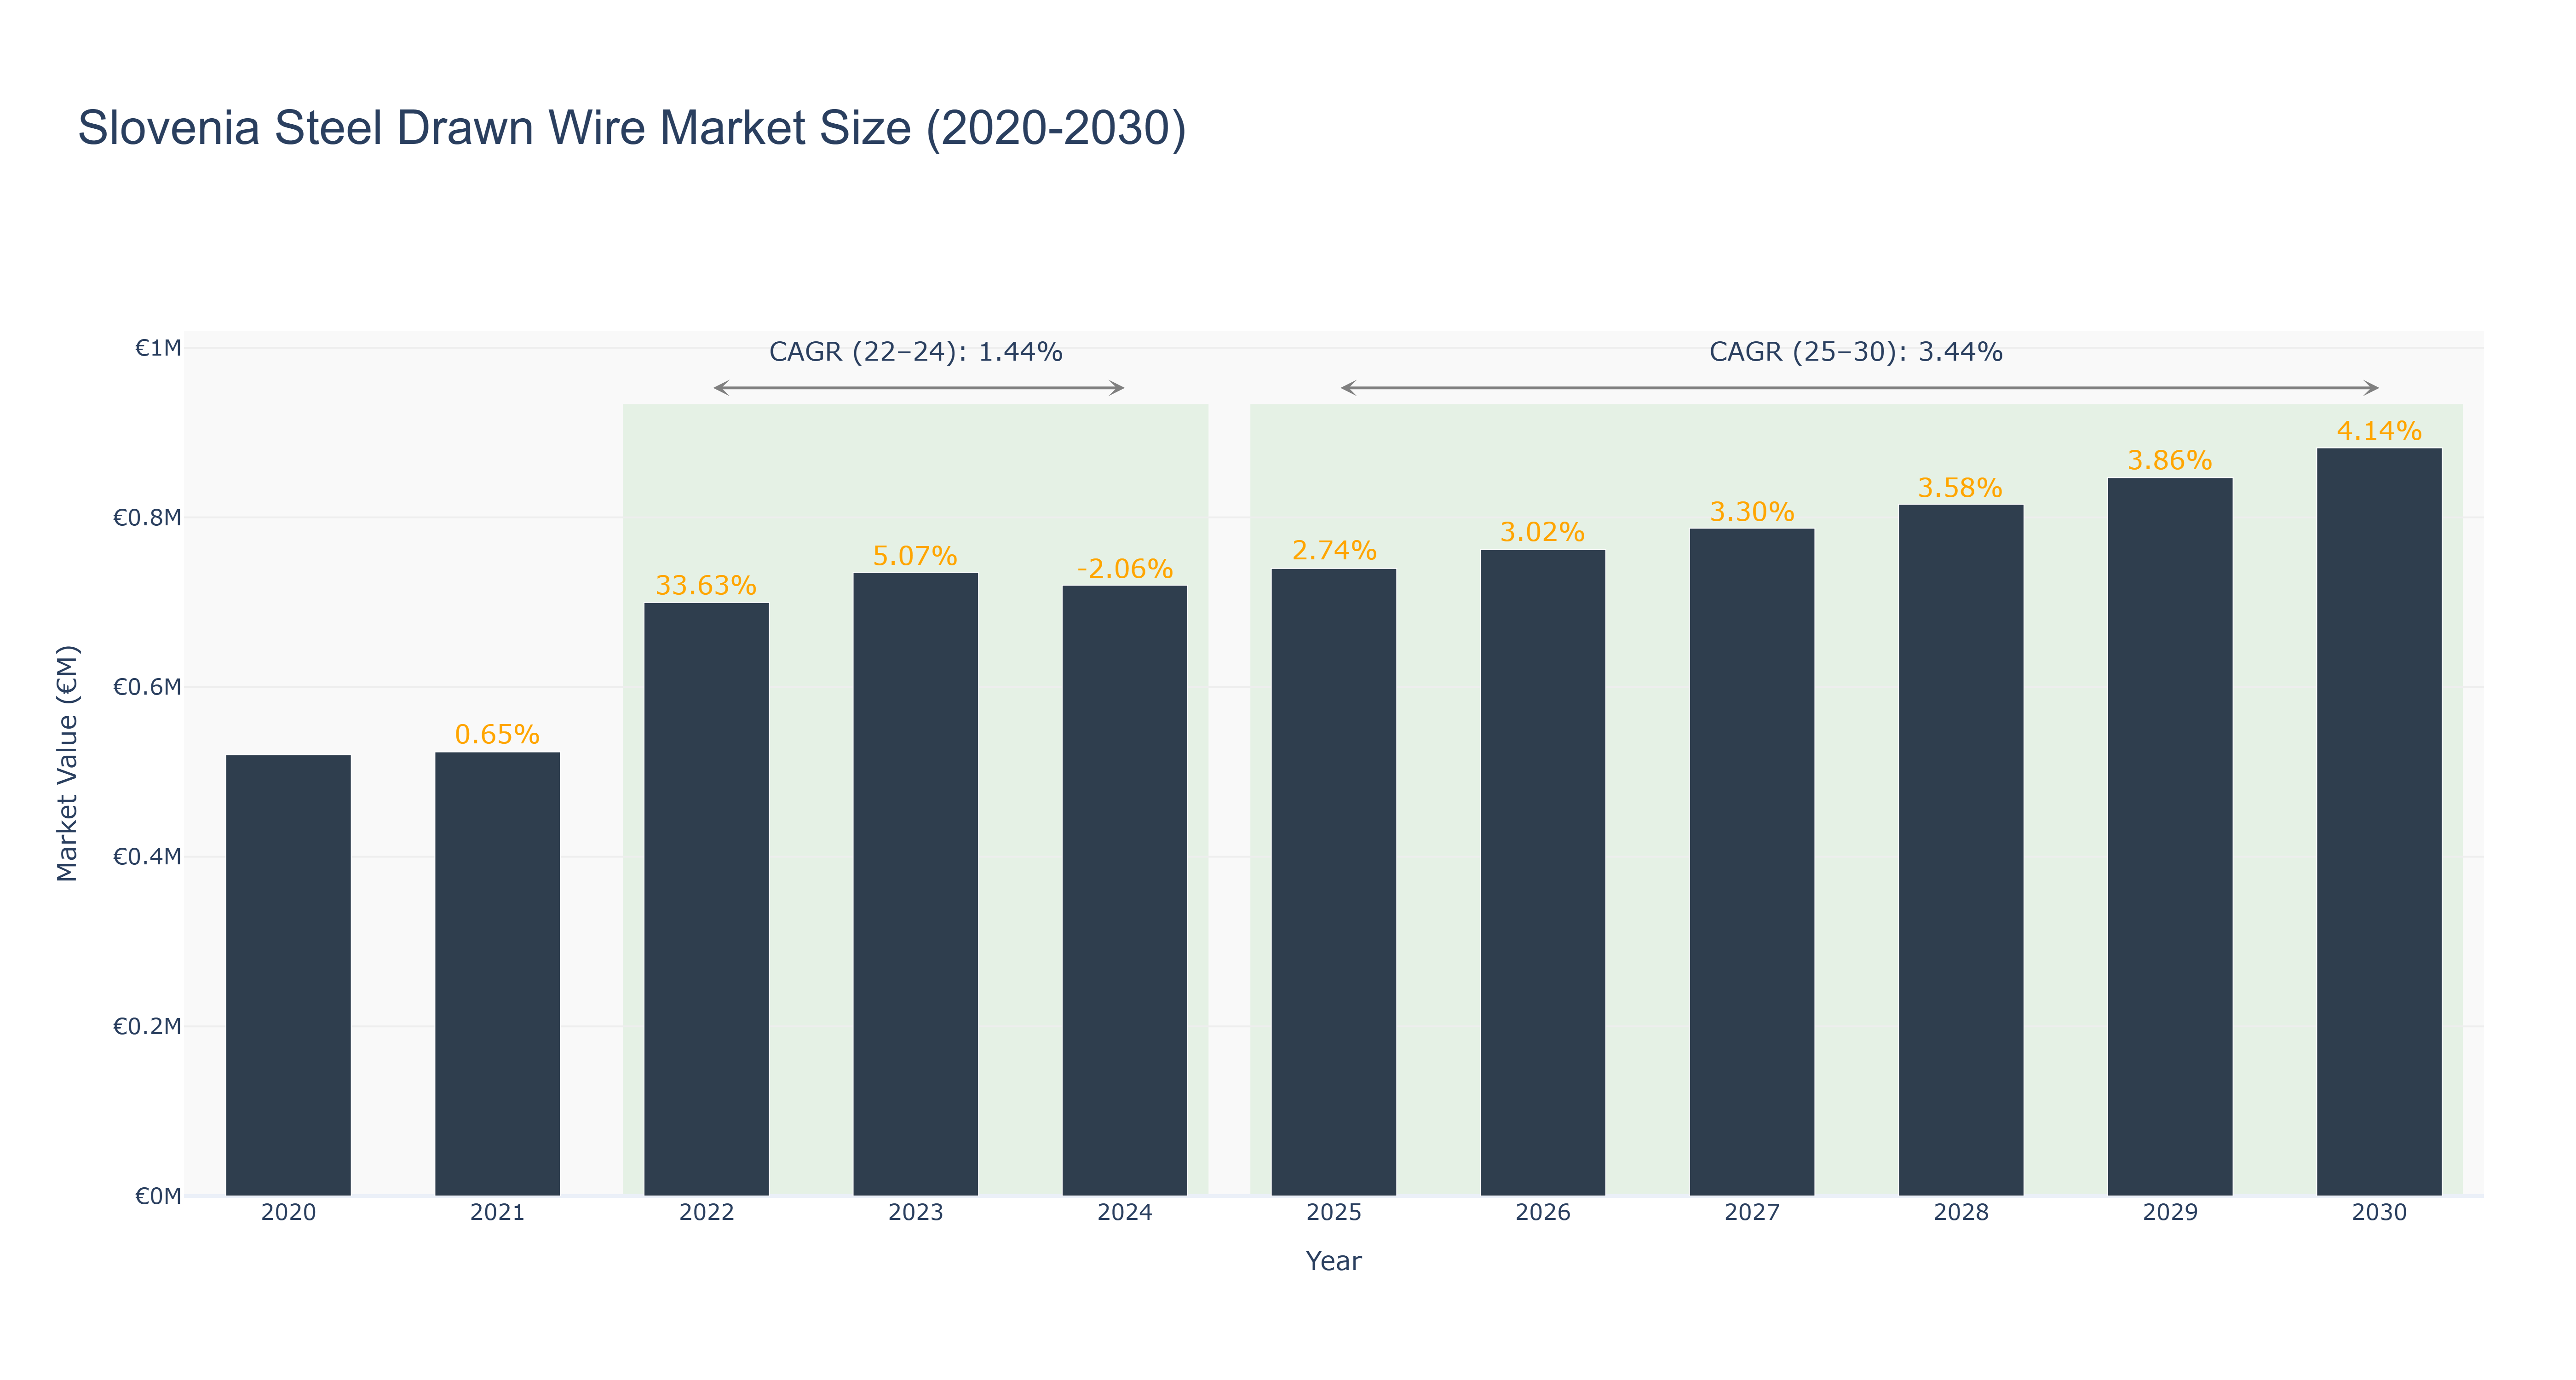
Slovenia Steel Drawn Wire Market has shown a fluctuating trend in market size over the years. The peak market size of €0.88 million is forecasted for 2030, with a steady growth trajectory. From 2020 to 2024, the market size ranged from €0.52 million to €0.72 million, experiencing both positive and negative growth rates. The forecasted market size from 2025 to 2030 is projected to increase steadily, with a CAGR of 3.44%. The CAGR from 2022 to 2024 was 1.44%, indicating a moderate growth phase. Industry drivers such as technological advancements and increasing demand for steel products are likely contributing to this growth. In the near future, Slovenia is set to launch a national initiative promoting sustainable steel production, aligning with global sustainability goals and driving further market expansion.
Slovenia Steel Drawn Wire Market: Production & Trade Performance (2019-2025)
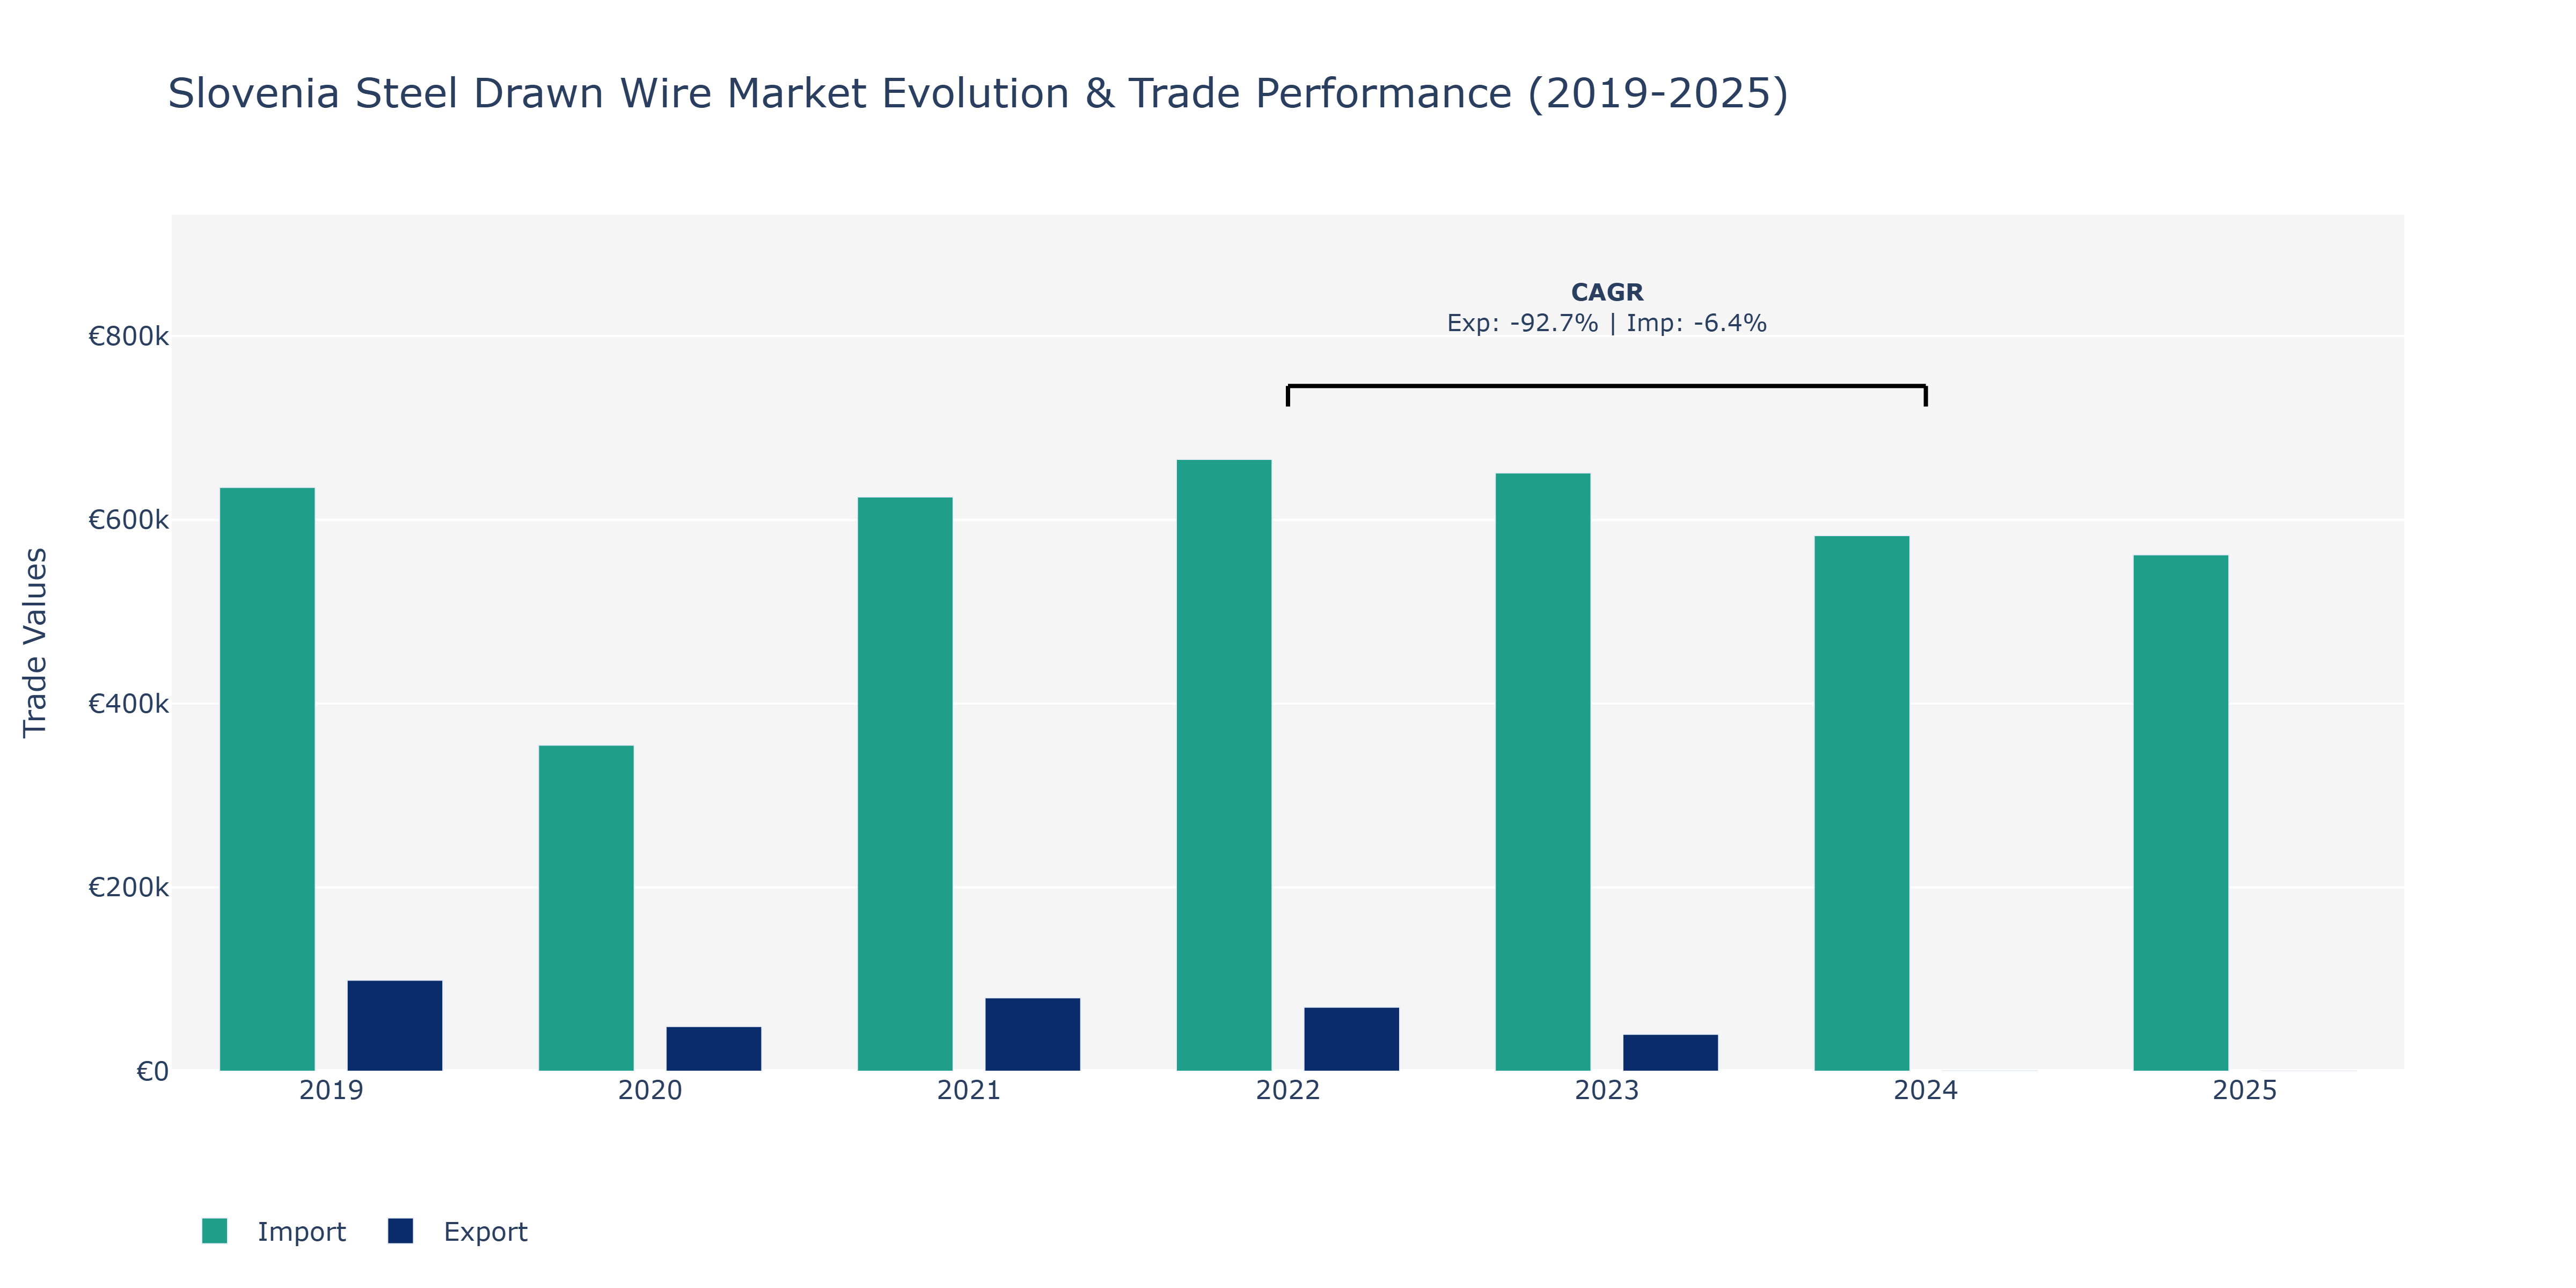
Between 2019 and 2025, Slovenia's Steel Drawn Wire market saw interesting dynamics in exports and imports. In 2019, imports stood notably higher than exports, with imports totaling €635.31 thousand compared to exports of €98.97 thousand. The following year, both exports and imports experienced a sharp decline, with exports dropping to €48.67 thousand and imports to €354.82 thousand. However, in 2021, both figures rebounded, with exports reaching €79.8 thousand and imports climbing to €624.93 thousand. Despite a slight drop in 2022, imports peaked at €665.78 thousand. Interestingly, the year 2024 witnessed a substantial decrease in exports to just €0.37 million while imports remained relatively stable at €582.78 thousand. This trend continued into 2025, highlighting a consistent decrease in exports to around €0.28 million. The fluctuating trends in exports and the stable nature of imports can be attributed to global steel prices, demand fluctuations, and trade policies impacting the steel industry. The decline in exports could be due to increased competition from other steel-producing countries or changes in consumer preferences for steel products. Meanwhile, the stability in imports might be influenced by the consistent demand for steel in Slovenia's manufacturing sector or long-term contracts with international suppliers.
Key Highlights of the Report:
- Slovenia Steel Drawn Wire Market Outlook
- Market Size of Slovenia Steel Drawn Wire Market, 2025
- Forecast of Slovenia Steel Drawn Wire Market, 2032
- Historical Data and Forecast of Slovenia Steel Drawn Wire Revenues & Volume for the Period 2022-2032F
- Slovenia Steel Drawn Wire Market Trend Evolution
- Slovenia Steel Drawn Wire Market Drivers and Challenges
- Slovenia Steel Drawn Wire Price Trends
- Slovenia Steel Drawn Wire Porter's Five Forces
- Slovenia Steel Drawn Wire Industry Life Cycle
- Historical Data and Forecast of Slovenia Steel Drawn Wire Market Revenues & Volume By Product Type for the Period 2022-2032F
- Historical Data and Forecast of Slovenia Steel Drawn Wire Market Revenues & Volume By Carbon Steel for the Period 2022-2032F
- Historical Data and Forecast of Slovenia Steel Drawn Wire Market Revenues & Volume By Stainless Steel for the Period 2022-2032F
- Historical Data and Forecast of Slovenia Steel Drawn Wire Market Revenues & Volume By Alloy Steel for the Period 2022-2032F
- Historical Data and Forecast of Slovenia Steel Drawn Wire Market Revenues & Volume By Diameter for the Period 2022-2032F
- Historical Data and Forecast of Slovenia Steel Drawn Wire Market Revenues & Volume By Up to 5 mm for the Period 2022-2032F
- Historical Data and Forecast of Slovenia Steel Drawn Wire Market Revenues & Volume By 6-10 mm for the Period 2022-2032F
- Historical Data and Forecast of Slovenia Steel Drawn Wire Market Revenues & Volume By 11-15 mm for the Period 2022-2032F
- Historical Data and Forecast of Slovenia Steel Drawn Wire Market Revenues & Volume By 16-20 mm for the Period 2022-2032F
- Historical Data and Forecast of Slovenia Steel Drawn Wire Market Revenues & Volume By Above 20 mm for the Period 2022-2032F
- Historical Data and Forecast of Slovenia Steel Drawn Wire Market Revenues & Volume By End-user for the Period 2022-2032F
- Historical Data and Forecast of Slovenia Steel Drawn Wire Market Revenues & Volume By Automotive for the Period 2022-2032F
- Historical Data and Forecast of Slovenia Steel Drawn Wire Market Revenues & Volume By Construction for the Period 2022-2032F
- Historical Data and Forecast of Slovenia Steel Drawn Wire Market Revenues & Volume By Military for the Period 2022-2032F
- Historical Data and Forecast of Slovenia Steel Drawn Wire Market Revenues & Volume By Telecom for the Period 2022-2032F
- Historical Data and Forecast of Slovenia Steel Drawn Wire Market Revenues & Volume By Power & Energy for the Period 2022-2032F
- Historical Data and Forecast of Slovenia Steel Drawn Wire Market Revenues & Volume By Heavy Machinery for the Period 2022-2032F
- Historical Data and Forecast of Slovenia Steel Drawn Wire Market Revenues & Volume By Others (Aviation, Agriculture, etc.) for the Period 2022-2032F
- Historical Data and Forecast of Slovenia Steel Drawn Wire Market Revenues & Volume By Distribution Channel for the Period 2022-2032F
- Historical Data and Forecast of Slovenia Steel Drawn Wire Market Revenues & Volume By Direct Sales for the Period 2022-2032F
- Historical Data and Forecast of Slovenia Steel Drawn Wire Market Revenues & Volume By Indirect Sales for the Period 2022-2032F
- Slovenia Steel Drawn Wire Import Export Trade Statistics
- Market Opportunity Assessment By Product Type
- Market Opportunity Assessment By Diameter
- Market Opportunity Assessment By End-user
- Market Opportunity Assessment By Distribution Channel
- Slovenia Steel Drawn Wire Top Companies Market Share
- Slovenia Steel Drawn Wire Competitive Benchmarking By Technical and Operational Parameters
- Slovenia Steel Drawn Wire Company Profiles
- Slovenia Steel Drawn Wire Key Strategic Recommendations
Frequently Asked Questions About the Market Study (FAQs):
6Wresearch actively monitors the Slovenia Steel Drawn Wire Market and publishes its comprehensive annual report, highlighting emerging trends, growth drivers, revenue analysis, and forecast outlook. Our insights help businesses to make data-backed strategic decisions with ongoing market dynamics. Our analysts track relevent industries related to the Slovenia Steel Drawn Wire Market, allowing our clients with actionable intelligence and reliable forecasts tailored to emerging regional needs.
Yes, we provide customisation as per your requirements. To learn more, feel free to contact us on sales@6wresearch.com
1 Executive Summary |
2 Introduction |
2.1 Key Highlights of the Report |
2.2 Report Description |
2.3 Market Scope & Segmentation |
2.4 Research Methodology |
2.5 Assumptions |
3 Slovenia Steel Drawn Wire Market Overview |
3.1 Slovenia Country Macro Economic Indicators |
3.2 Slovenia Steel Drawn Wire Market Revenues & Volume, 2022 & 2032F |
3.3 Slovenia Steel Drawn Wire Market - Industry Life Cycle |
3.4 Slovenia Steel Drawn Wire Market - Porter's Five Forces |
3.5 Slovenia Steel Drawn Wire Market Revenues & Volume Share, By Product Type, 2022 & 2032F |
3.6 Slovenia Steel Drawn Wire Market Revenues & Volume Share, By Diameter, 2022 & 2032F |
3.7 Slovenia Steel Drawn Wire Market Revenues & Volume Share, By End-user, 2022 & 2032F |
3.8 Slovenia Steel Drawn Wire Market Revenues & Volume Share, By Distribution Channel, 2022 & 2032F |
4 Slovenia Steel Drawn Wire Market Dynamics |
4.1 Impact Analysis |
4.2 Market Drivers |
4.2.1 Growing demand for steel drawn wire in construction and infrastructure projects |
4.2.2 Increasing adoption of steel drawn wire in the automotive industry for manufacturing components |
4.2.3 Technological advancements leading to improved quality and performance of steel drawn wire |
4.3 Market Restraints |
4.3.1 Fluctuating raw material prices impacting the cost of production |
4.3.2 Competition from alternative materials like aluminum and composite materials |
4.3.3 Regulatory challenges related to environmental impact and sustainability concerns |
5 Slovenia Steel Drawn Wire Market Trends |
6 Slovenia Steel Drawn Wire Market, By Types |
6.1 Slovenia Steel Drawn Wire Market, By Product Type |
6.1.1 Overview and Analysis |
6.1.2 Slovenia Steel Drawn Wire Market Revenues & Volume, By Product Type, 2022-2032F |
6.1.3 Slovenia Steel Drawn Wire Market Revenues & Volume, By Carbon Steel, 2022-2032F |
6.1.4 Slovenia Steel Drawn Wire Market Revenues & Volume, By Stainless Steel, 2022-2032F |
6.1.5 Slovenia Steel Drawn Wire Market Revenues & Volume, By Alloy Steel, 2022-2032F |
6.2 Slovenia Steel Drawn Wire Market, By Diameter |
6.2.1 Overview and Analysis |
6.2.2 Slovenia Steel Drawn Wire Market Revenues & Volume, By Up to 5 mm, 2022-2032F |
6.2.3 Slovenia Steel Drawn Wire Market Revenues & Volume, By 6-10 mm, 2022-2032F |
6.2.4 Slovenia Steel Drawn Wire Market Revenues & Volume, By 11-15 mm, 2022-2032F |
6.2.5 Slovenia Steel Drawn Wire Market Revenues & Volume, By 16-20 mm, 2022-2032F |
6.2.6 Slovenia Steel Drawn Wire Market Revenues & Volume, By Above 20 mm, 2022-2032F |
6.3 Slovenia Steel Drawn Wire Market, By End-user |
6.3.1 Overview and Analysis |
6.3.2 Slovenia Steel Drawn Wire Market Revenues & Volume, By Automotive, 2022-2032F |
6.3.3 Slovenia Steel Drawn Wire Market Revenues & Volume, By Construction, 2022-2032F |
6.3.4 Slovenia Steel Drawn Wire Market Revenues & Volume, By Military, 2022-2032F |
6.3.5 Slovenia Steel Drawn Wire Market Revenues & Volume, By Telecom, 2022-2032F |
6.3.6 Slovenia Steel Drawn Wire Market Revenues & Volume, By Power & Energy, 2022-2032F |
6.3.7 Slovenia Steel Drawn Wire Market Revenues & Volume, By Heavy Machinery, 2022-2032F |
6.4 Slovenia Steel Drawn Wire Market, By Distribution Channel |
6.4.1 Overview and Analysis |
6.4.2 Slovenia Steel Drawn Wire Market Revenues & Volume, By Direct Sales, 2022-2032F |
6.4.3 Slovenia Steel Drawn Wire Market Revenues & Volume, By Indirect Sales, 2022-2032F |
7 Slovenia Steel Drawn Wire Market Import-Export Trade Statistics |
7.1 Slovenia Steel Drawn Wire Market Export to Major Countries |
7.2 Slovenia Steel Drawn Wire Market Imports from Major Countries |
8 Slovenia Steel Drawn Wire Market Key Performance Indicators |
8.1 Average selling price of steel drawn wire |
8.2 Number of new construction and infrastructure projects utilizing steel drawn wire |
8.3 Percentage of automotive manufacturers using steel drawn wire in their production process |
8.4 Innovation rate in steel drawn wire technologies |
8.5 Percentage of compliance with environmental regulations in the production of steel drawn wire |
9 Slovenia Steel Drawn Wire Market - Opportunity Assessment |
9.1 Slovenia Steel Drawn Wire Market Opportunity Assessment, By Product Type, 2022 & 2032F |
9.2 Slovenia Steel Drawn Wire Market Opportunity Assessment, By Diameter, 2022 & 2032F |
9.3 Slovenia Steel Drawn Wire Market Opportunity Assessment, By End-user, 2022 & 2032F |
9.4 Slovenia Steel Drawn Wire Market Opportunity Assessment, By Distribution Channel, 2022 & 2032F |
10 Slovenia Steel Drawn Wire Market - Competitive Landscape |
10.1 Slovenia Steel Drawn Wire Market Revenue Share, By Companies, 2025 |
10.2 Slovenia Steel Drawn Wire Market Competitive Benchmarking, By Operating and Technical Parameters |
11 Company Profiles |
12 Recommendations |
13 Disclaimer |
Global Go To Market Strategy - 2030
Export potential enables firms to identify high-growth global markets with greater confidence by combining advanced trade intelligence with a structured quantitative methodology. The framework analyzes emerging demand trends and country-level import patterns while integrating macroeconomic and trade datasets such as GDP and population forecasts, bilateral import–export flows, tariff structures, elasticity differentials between developed and developing economies, geographic distance, and import demand projections. Using weighted trade values from 2020–2024 as the base period to project country-to-country export potential for 2030, these inputs are operationalized through calculated drivers such as gravity model parameters, tariff impact factors, and projected GDP per-capita growth. Through an analysis of hidden potentials, demand hotspots, and market conditions that are most favorable to success, this method enables firms to focus on target countries, maximize returns, and global expansion with data, backed by accuracy.
By factoring in the projected importer demand gap that is currently unmet and could be potential opportunity, it identifies the potential for the Exporter (Country) among 190 countries, against the general trade analysis, which identifies the biggest importer or exporter.
To discover high-growth global markets and optimize your business strategy:
Click Here
Pricing
- Single User License$ 1,995
- Department License$ 2,400
- Site License$ 3,120
- Global License$ 3,795

Leadership Perspectives from Industry Events
Search
Thought Leadership and Analyst Meet


Our Clients
6WResearch In News
- India Export Attractiveness Tracker 2026
- India Air Conditioner Market Set for Strong Rebound in 2026 After Weather-Led Correction and GST-Driven Recovery: 6Wresearch
- ADAS in India: How Automatic Emergency Braking, Blind Spot Detection & Driver Monitoring are Transforming Road Safety
- Doha a strategic location for EV manufacturing hub: IPA Qatar
- Demand for luxury TVs surging in the GCC, says Samsung
- Empowering Growth: The Thriving Journey of Bangladesh’s Cable Industry
Latest Reports
- Nicaragua RPG Gaming Market (2026-2032)
- New Zealand RPG Gaming Market (2026-2032)
- Netherlands RPG Gaming Market (2026-2032)
- Nauru RPG Gaming Market (2026-2032)
- Namibia RPG Gaming Market (2026-2032)
- Mozambique RPG Gaming Market (2026-2032)
- Montenegro RPG Gaming Market (2026-2032)
- Mongolia RPG Gaming Market (2026-2032)
- Monaco RPG Gaming Market (2026-2032)
- Micronesia RPG Gaming Market (2026-2032)
Industry Events and Analyst Meet

EV India Expo 2026

HIMTEX 2026

India Refining Summit 2026

India EV Show 2026

EV tech India Expo 2026
Whitepaper
- Middle East & Africa Commercial Security Market Click here to view more.
- Middle East & Africa Fire Safety Systems & Equipment Market Click here to view more.
- GCC Drone Market Click here to view more.
- Middle East Lighting Fixture Market Click here to view more.
- GCC Physical & Perimeter Security Market Click here to view more.