Slovenia Twine Market (2026-2032) | Growth, Industry, Forecast, Size, Revenue, Share, Outlook, Segmentation, Value, Analysis, Trends & Companies
Market Forecast By Type (Polyethylene Rope Twine, Metal Rope Twine, Other), By Applications (Industrial, Construction, Oil, Coal mine, Other) And Competitive Landscape
| Product Code: ETC5821625 | Publication Date: Nov 2023 | Updated Date: Apr 2026 | Product Type: Market Research Report | |
| Publisher: 6Wresearch | Author: Ravi Bhandari | No. of Pages: 60 | No. of Figures: 30 | No. of Tables: 5 |
Slovenia Twine Market Size (2020-2030)
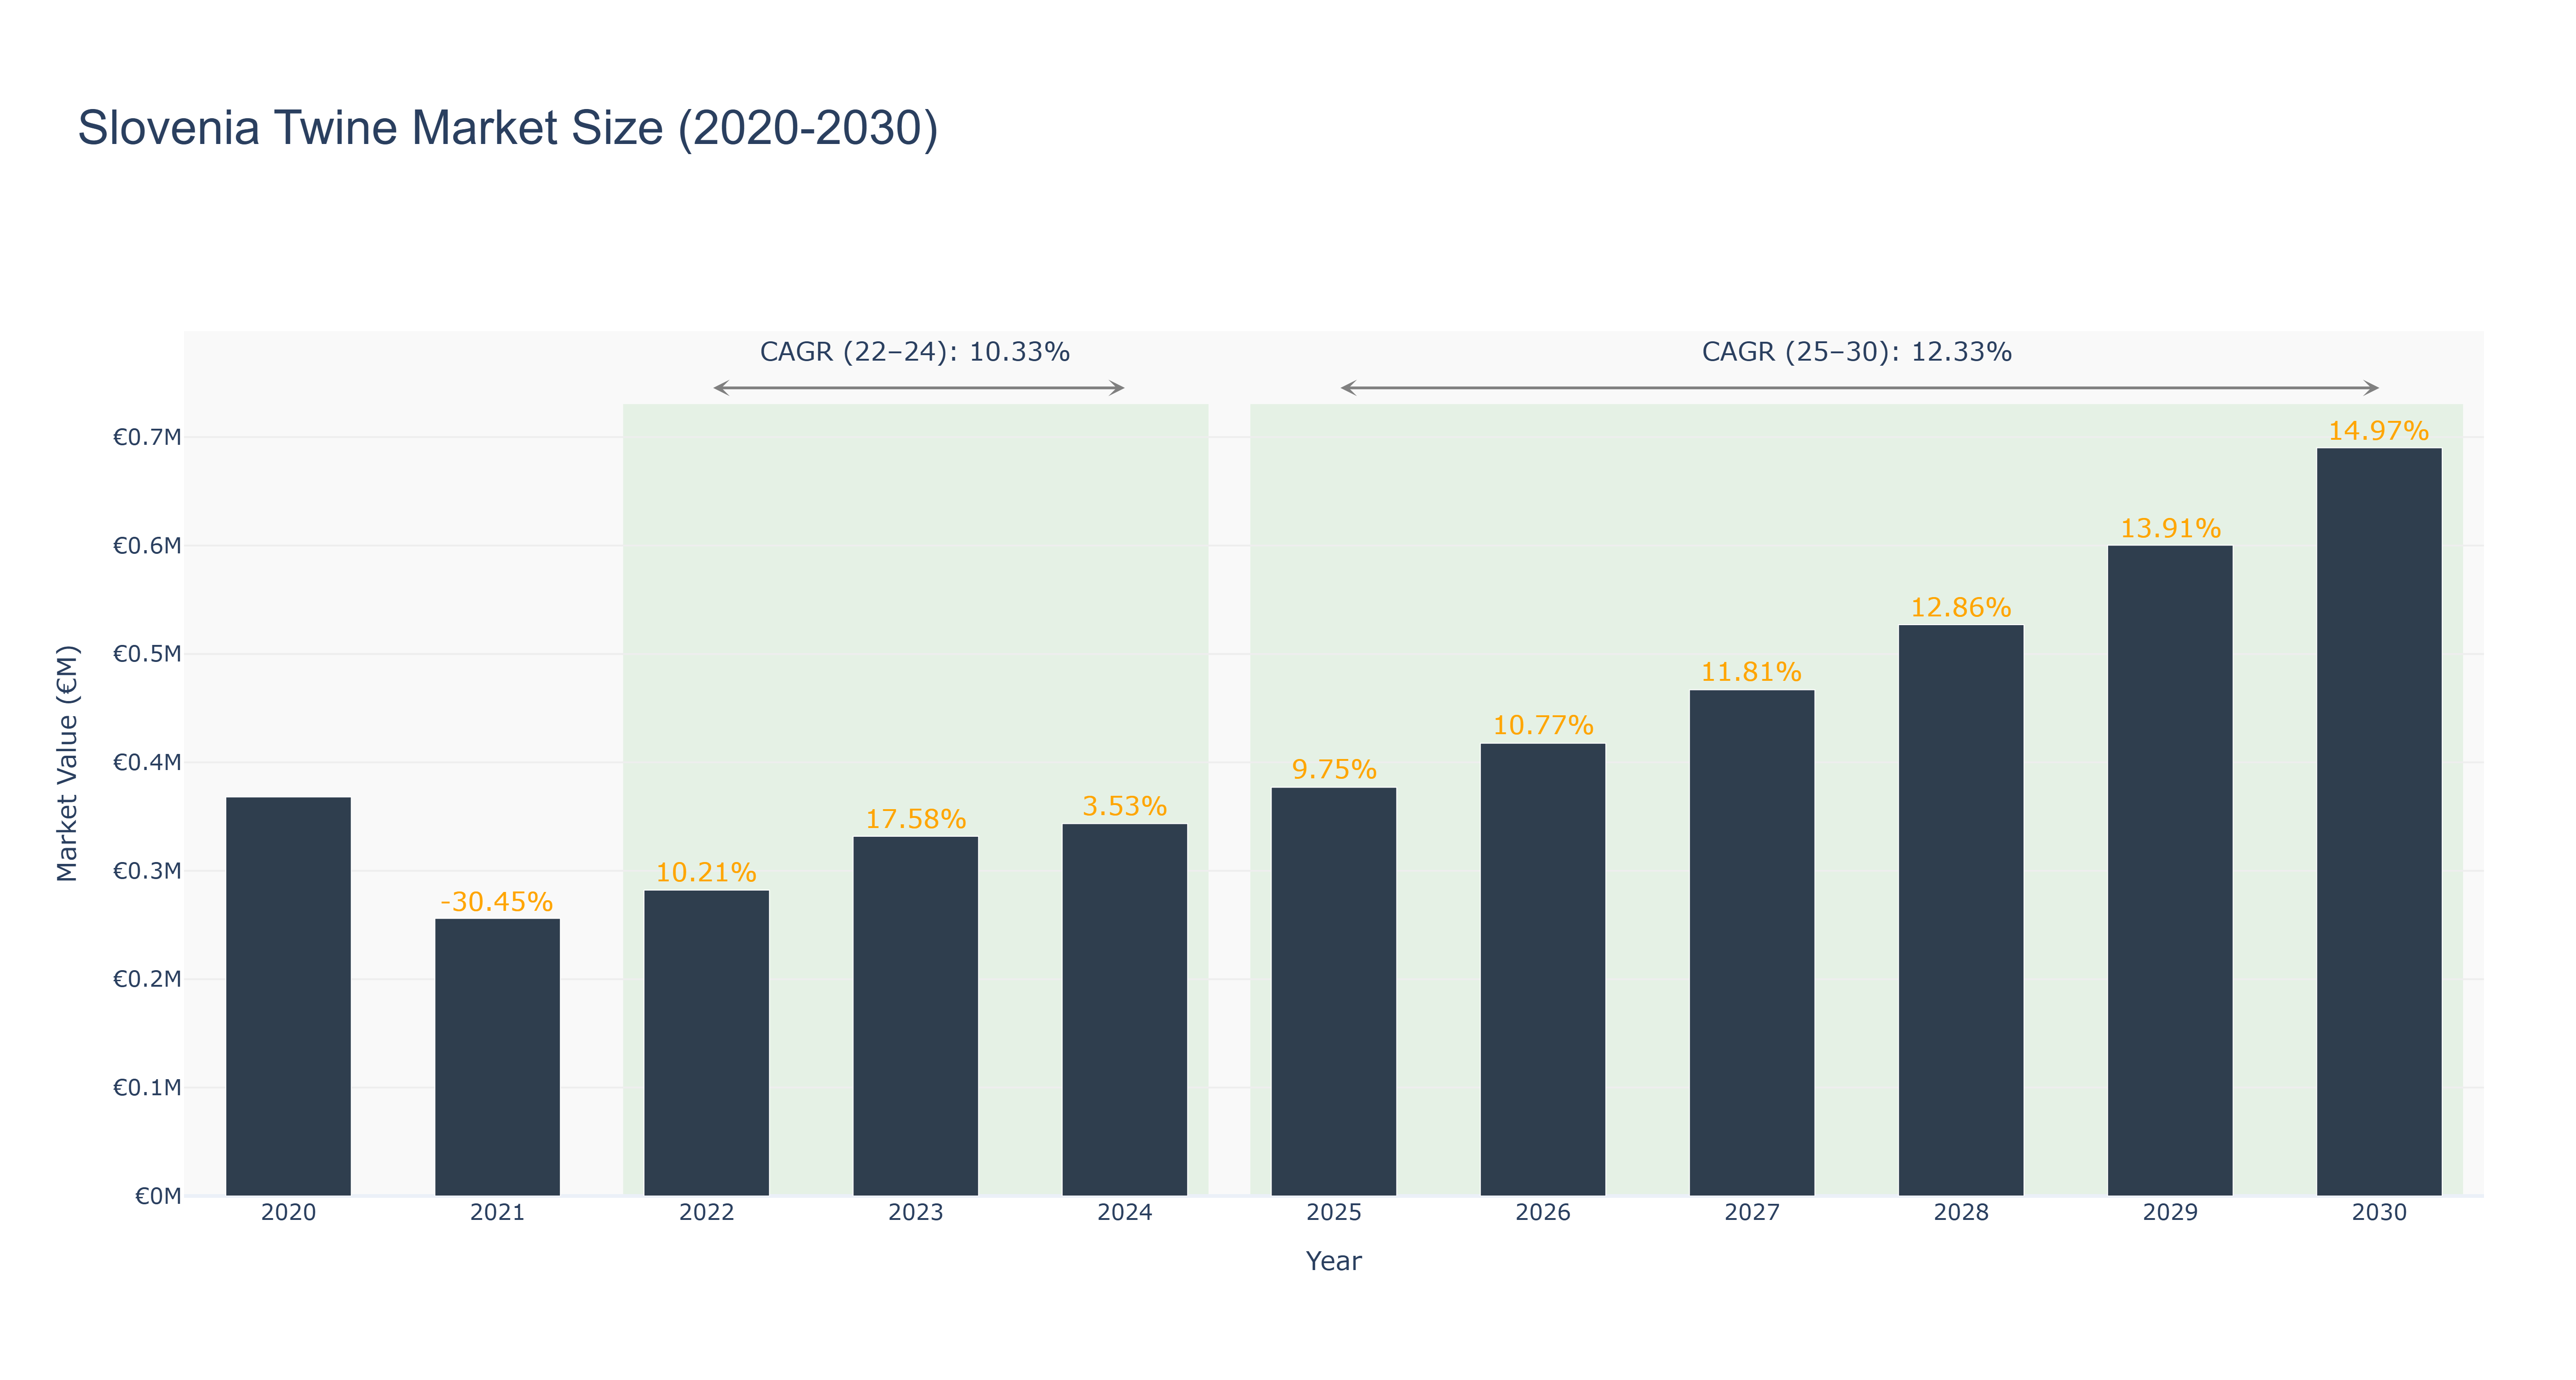
The Slovenia Twine Market experienced a peak market size of €0.69 million in 2030, following a steady growth trajectory. The market size was €0.28 million in 2022, increasing to €0.34 million in 2024. Forecasted growth indicates a positive trend, with market size projected to reach €0.94 million by 2030. The CAGR for the period 2022-24 was 10.33%, while for 2025-30, it is expected to be 12.33%. The market's growth can be attributed to increasing demand for eco-friendly packaging solutions and the growing textile industry in Slovenia. Recent developments include collaborations between local twine manufacturers and international textile companies to enhance product quality and expand market reach. Future plans involve investing in advanced production technologies to meet the rising demand for sustainable twine products in the European market.
Slovenia Twine Market: Production & Trade Performance (2019-2025)
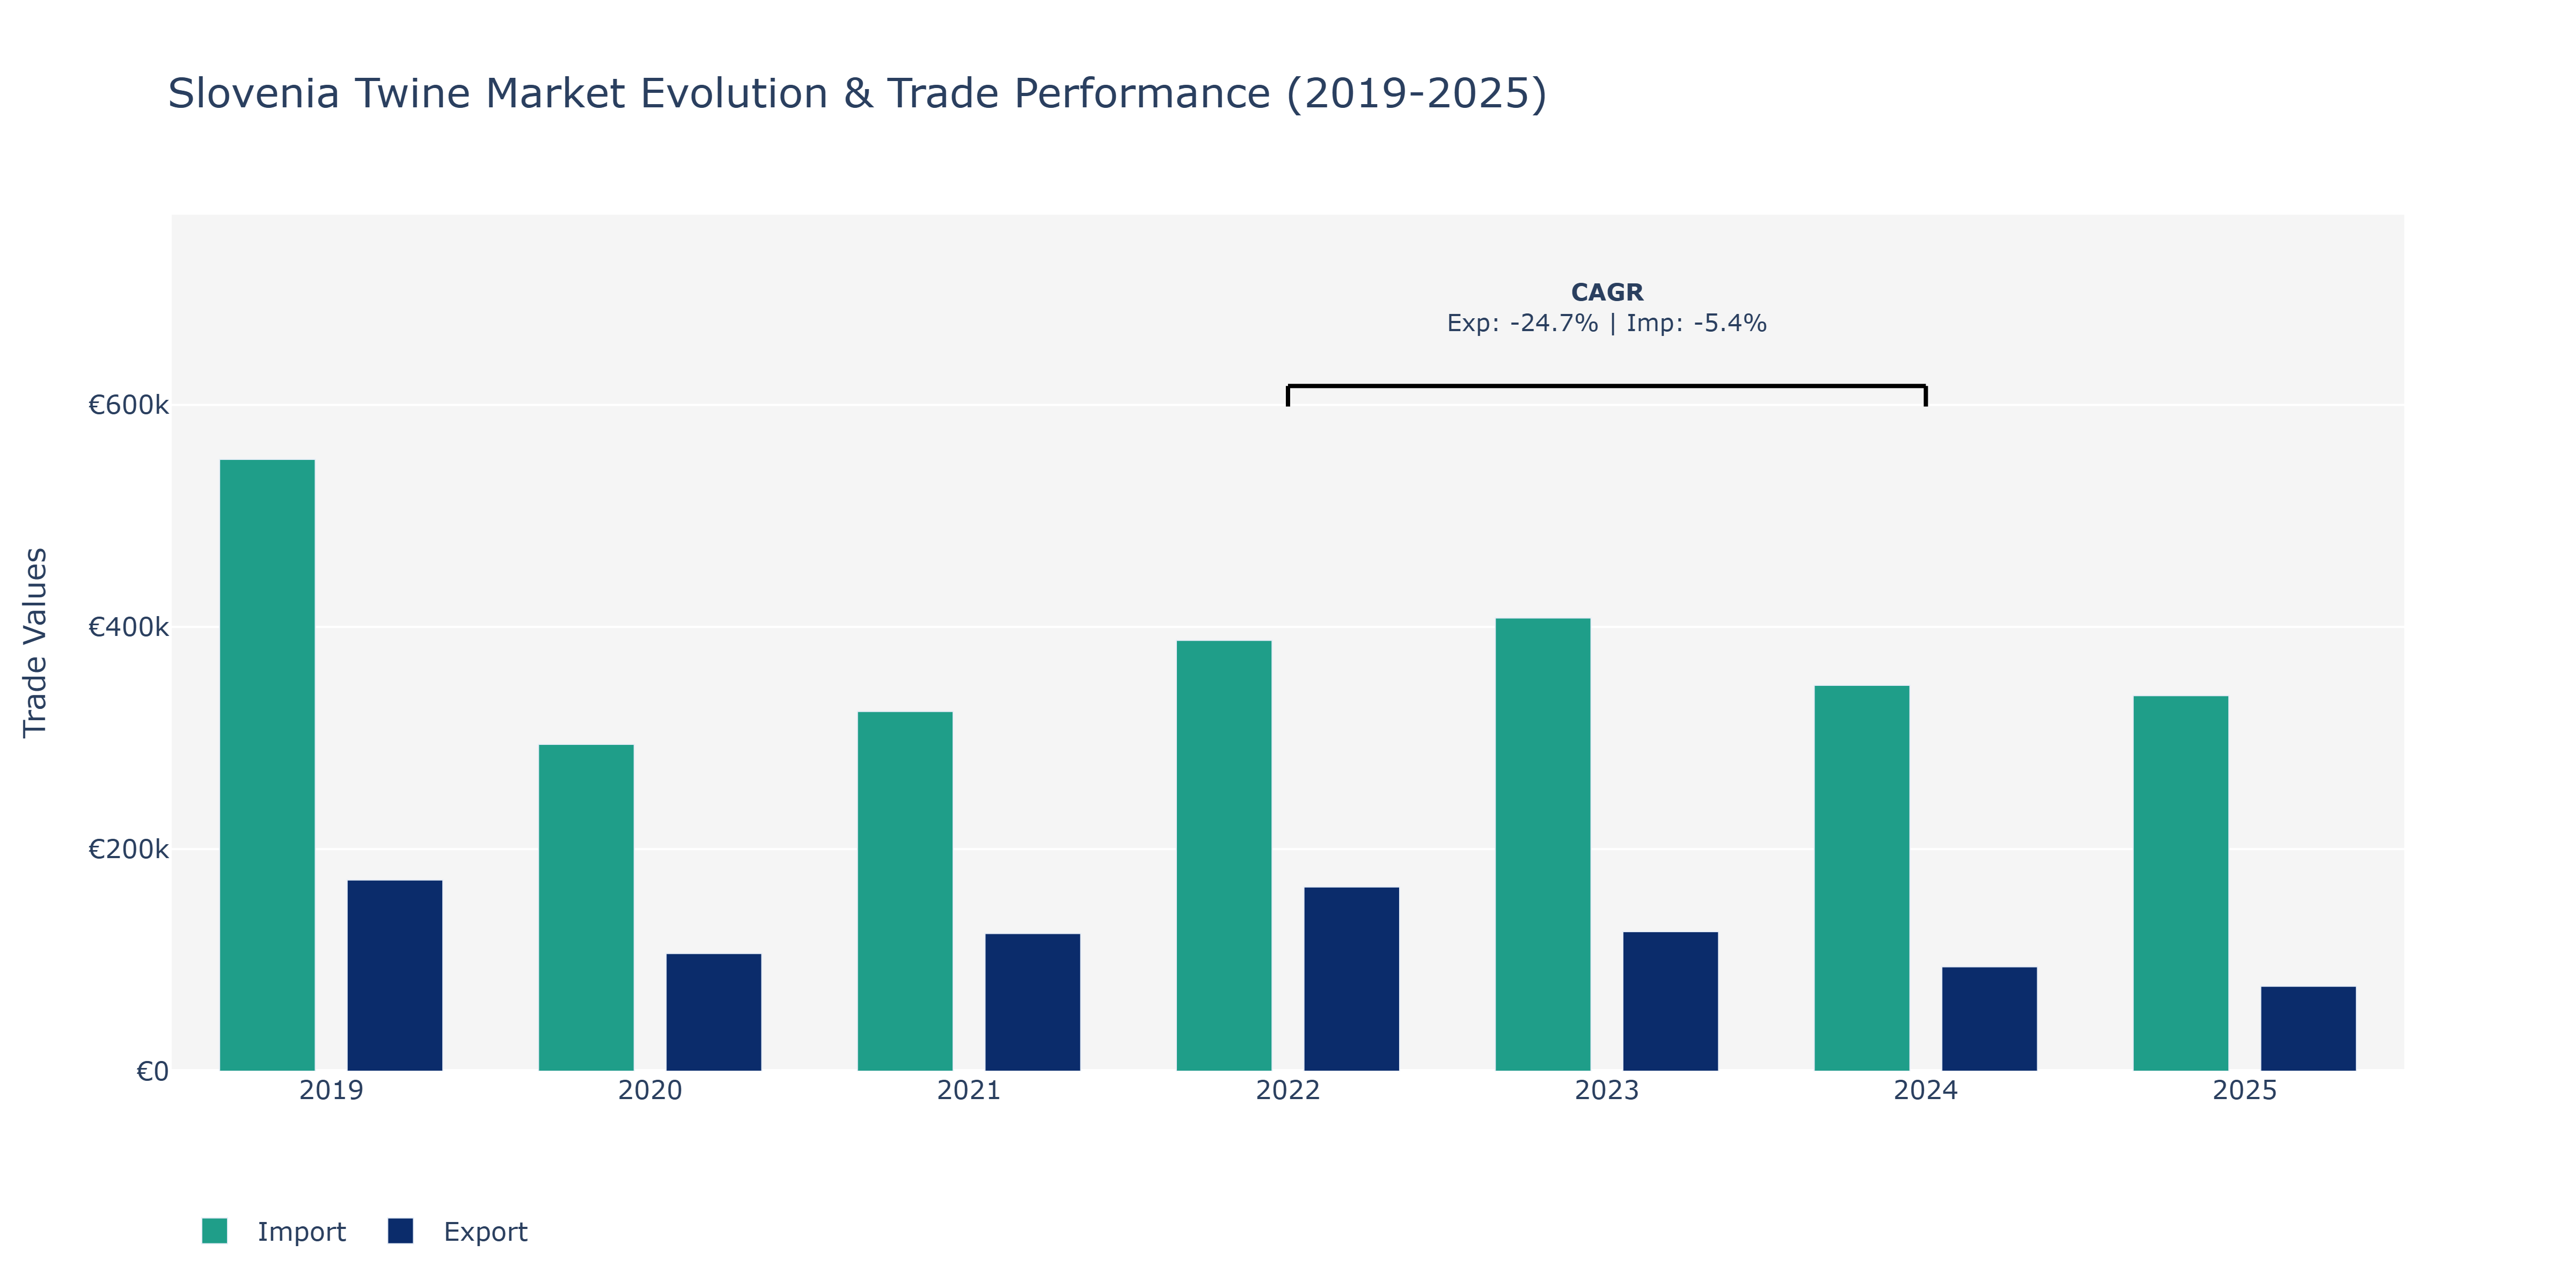
In the Slovenia Twine Market, exports experienced notable fluctuations during the period under review. In 2019, exports stood at €172.21 thousand, declining sharply to €105.92 thousand in 2020 before rebounding to €123.93 thousand in 2021. The peak export value of €165.93 thousand was observed in 2022, followed by a decline to €125.7 thousand in 2023 and a further drop to €94.0 thousand in 2024. In 2025, exports decreased to €76.47 thousand. Conversely, imports followed a different trajectory, increasing consistently from €550.93 thousand in 2019 to peak at €408.07 thousand in 2023 before decreasing to €338.18 thousand in 2025. The fluctuations in exports can be attributed to changing global demand for twine products, market competition, and economic conditions affecting exports. The increase in imports may be due to sourcing raw materials or finished goods for the twine industry from international markets to meet domestic demand and manufacturing needs.
Key Highlights of the Report:
- Slovenia Twine Market Outlook
- Market Size of Slovenia Twine Market, 2025
- Forecast of Slovenia Twine Market, 2032
- Historical Data and Forecast of Slovenia Twine Revenues & Volume for the Period 2022-2032F
- Slovenia Twine Market Trend Evolution
- Slovenia Twine Market Drivers and Challenges
- Slovenia Twine Price Trends
- Slovenia Twine Porter`s Five Forces
- Slovenia Twine Industry Life Cycle
- Historical Data and Forecast of Slovenia Twine Market Revenues & Volume By Type for the Period 2022-2032F
- Historical Data and Forecast of Slovenia Twine Market Revenues & Volume By Polyethylene Rope Twine for the Period 2022-2032F
- Historical Data and Forecast of Slovenia Twine Market Revenues & Volume By Metal Rope Twine for the Period 2022-2032F
- Historical Data and Forecast of Slovenia Twine Market Revenues & Volume By Other for the Period 2022-2032F
- Historical Data and Forecast of Slovenia Twine Market Revenues & Volume By Applications for the Period 2022-2032F
- Historical Data and Forecast of Slovenia Twine Market Revenues & Volume By Industrial for the Period 2022-2032F
- Historical Data and Forecast of Slovenia Twine Market Revenues & Volume By Construction for the Period 2022-2032F
- Historical Data and Forecast of Slovenia Twine Market Revenues & Volume By Oil for the Period 2022-2032F
- Historical Data and Forecast of Slovenia Twine Market Revenues & Volume By Coal mine for the Period 2022-2032F
- Historical Data and Forecast of Slovenia Twine Market Revenues & Volume By Other for the Period 2022-2032F
- Slovenia Twine Import Export Trade Statistics
- Market Opportunity Assessment By Type
- Market Opportunity Assessment By Applications
- Slovenia Twine Top Companies Market Share
- Slovenia Twine Competitive Benchmarking By Technical and Operational Parameters
- Slovenia Twine Company Profiles
- Slovenia Twine Key Strategic Recommendations
Frequently Asked Questions About the Market Study (FAQs):
6Wresearch actively monitors the Slovenia Twine Market and publishes its comprehensive annual report, highlighting emerging trends, growth drivers, revenue analysis, and forecast outlook. Our insights help businesses to make data-backed strategic decisions with ongoing market dynamics. Our analysts track relevent industries related to the Slovenia Twine Market, allowing our clients with actionable intelligence and reliable forecasts tailored to emerging regional needs.
Yes, we provide customisation as per your requirements. To learn more, feel free to contact us on sales@6wresearch.com
1 Executive Summary |
2 Introduction |
2.1 Key Highlights of the Report |
2.2 Report Description |
2.3 Market Scope & Segmentation |
2.4 Research Methodology |
2.5 Assumptions |
3 Slovenia Twine Market Overview |
3.1 Slovenia Country Macro Economic Indicators |
3.2 Slovenia Twine Market Revenues & Volume, 2022 & 2032F |
3.3 Slovenia Twine Market - Industry Life Cycle |
3.4 Slovenia Twine Market - Porter's Five Forces |
3.5 Slovenia Twine Market Revenues & Volume Share, By Type, 2022 & 2032F |
3.6 Slovenia Twine Market Revenues & Volume Share, By Applications, 2022 & 2032F |
4 Slovenia Twine Market Dynamics |
4.1 Impact Analysis |
4.2 Market Drivers |
4.2.1 Increasing demand for eco-friendly and sustainable packaging solutions |
4.2.2 Growth in agriculture and horticulture industries in Slovenia |
4.2.3 Rising awareness about the benefits of using twine in various applications |
4.3 Market Restraints |
4.3.1 Fluctuating prices of raw materials used in twine production |
4.3.2 Competition from alternative packaging materials such as plastic and synthetic fibers |
4.3.3 Impact of changing government regulations on the production and use of twine |
5 Slovenia Twine Market Trends |
6 Slovenia Twine Market Segmentations |
6.1 Slovenia Twine Market, By Type |
6.1.1 Overview and Analysis |
6.1.2 Slovenia Twine Market Revenues & Volume, By Polyethylene Rope Twine, 2022-2032F |
6.1.3 Slovenia Twine Market Revenues & Volume, By Metal Rope Twine, 2022-2032F |
6.1.4 Slovenia Twine Market Revenues & Volume, By Other, 2022-2032F |
6.2 Slovenia Twine Market, By Applications |
6.2.1 Overview and Analysis |
6.2.2 Slovenia Twine Market Revenues & Volume, By Industrial, 2022-2032F |
6.2.3 Slovenia Twine Market Revenues & Volume, By Construction, 2022-2032F |
6.2.4 Slovenia Twine Market Revenues & Volume, By Oil, 2022-2032F |
6.2.5 Slovenia Twine Market Revenues & Volume, By Coal mine, 2022-2032F |
6.2.6 Slovenia Twine Market Revenues & Volume, By Other, 2022-2032F |
7 Slovenia Twine Market Import-Export Trade Statistics |
7.1 Slovenia Twine Market Export to Major Countries |
7.2 Slovenia Twine Market Imports from Major Countries |
8 Slovenia Twine Market Key Performance Indicators |
8.1 Percentage of twine made from recycled or sustainable materials |
8.2 Adoption rate of twine in new industries or applications |
8.3 Customer satisfaction and loyalty towards twine products |
8.4 Innovation rate in twine manufacturing processes |
8.5 Environmental impact metrics related to twine production and usage |
9 Slovenia Twine Market - Opportunity Assessment |
9.1 Slovenia Twine Market Opportunity Assessment, By Type, 2022 & 2032F |
9.2 Slovenia Twine Market Opportunity Assessment, By Applications, 2022 & 2032F |
10 Slovenia Twine Market - Competitive Landscape |
10.1 Slovenia Twine Market Revenue Share, By Companies, 2025 |
10.2 Slovenia Twine Market Competitive Benchmarking, By Operating and Technical Parameters |
11 Company Profiles |
12 Recommendations | 13 Disclaimer |
Global Go To Market Strategy - 2030
Export potential enables firms to identify high-growth global markets with greater confidence by combining advanced trade intelligence with a structured quantitative methodology. The framework analyzes emerging demand trends and country-level import patterns while integrating macroeconomic and trade datasets such as GDP and population forecasts, bilateral import–export flows, tariff structures, elasticity differentials between developed and developing economies, geographic distance, and import demand projections. Using weighted trade values from 2020–2024 as the base period to project country-to-country export potential for 2030, these inputs are operationalized through calculated drivers such as gravity model parameters, tariff impact factors, and projected GDP per-capita growth. Through an analysis of hidden potentials, demand hotspots, and market conditions that are most favorable to success, this method enables firms to focus on target countries, maximize returns, and global expansion with data, backed by accuracy.
By factoring in the projected importer demand gap that is currently unmet and could be potential opportunity, it identifies the potential for the Exporter (Country) among 190 countries, against the general trade analysis, which identifies the biggest importer or exporter.
To discover high-growth global markets and optimize your business strategy:
Click Here
Pricing
- Single User License$ 1,995
- Department License$ 2,400
- Site License$ 3,120
- Global License$ 3,795

Leadership Perspectives from Industry Events
Search
Thought Leadership and Analyst Meet


Our Clients
6WResearch In News
- India Export Attractiveness Tracker 2026
- India Air Conditioner Market Set for Strong Rebound in 2026 After Weather-Led Correction and GST-Driven Recovery: 6Wresearch
- ADAS in India: How Automatic Emergency Braking, Blind Spot Detection & Driver Monitoring are Transforming Road Safety
- Doha a strategic location for EV manufacturing hub: IPA Qatar
- Demand for luxury TVs surging in the GCC, says Samsung
- Empowering Growth: The Thriving Journey of Bangladesh’s Cable Industry
Latest Reports
- Nicaragua RPG Gaming Market (2026-2032)
- New Zealand RPG Gaming Market (2026-2032)
- Netherlands RPG Gaming Market (2026-2032)
- Nauru RPG Gaming Market (2026-2032)
- Namibia RPG Gaming Market (2026-2032)
- Mozambique RPG Gaming Market (2026-2032)
- Montenegro RPG Gaming Market (2026-2032)
- Mongolia RPG Gaming Market (2026-2032)
- Monaco RPG Gaming Market (2026-2032)
- Micronesia RPG Gaming Market (2026-2032)
Industry Events and Analyst Meet

EV India Expo 2026

HIMTEX 2026

India Refining Summit 2026

India EV Show 2026

EV tech India Expo 2026
Whitepaper
- Middle East & Africa Commercial Security Market Click here to view more.
- Middle East & Africa Fire Safety Systems & Equipment Market Click here to view more.
- GCC Drone Market Click here to view more.
- Middle East Lighting Fixture Market Click here to view more.
- GCC Physical & Perimeter Security Market Click here to view more.