South Korea Quartz Market (2020-2026) | Growth, Outlook, Trends, Size, Value, Companies, Analysis, COVID-19 IMPACT, Share, Industry, Forecast & Revenue
Market Forecast By Product Type (Quartz Surface and Tile, High-purity Quartz, Quartz Glass, Quartz Crystal, Quartz Sand, Others), By End-users (Electronics and Semiconductor, Solar, Buildings and Construction, Medical, Optics and Telecommunication, Other) And Competitive Landscape
| Product Code: ETC008083 | Publication Date: Jun 2023 | Updated Date: Aug 2025 | Product Type: Report | |
| Publisher: 6Wresearch | Author: Ravi Bhandari | No. of Pages: 70 | No. of Figures: 35 | No. of Tables: 5 |
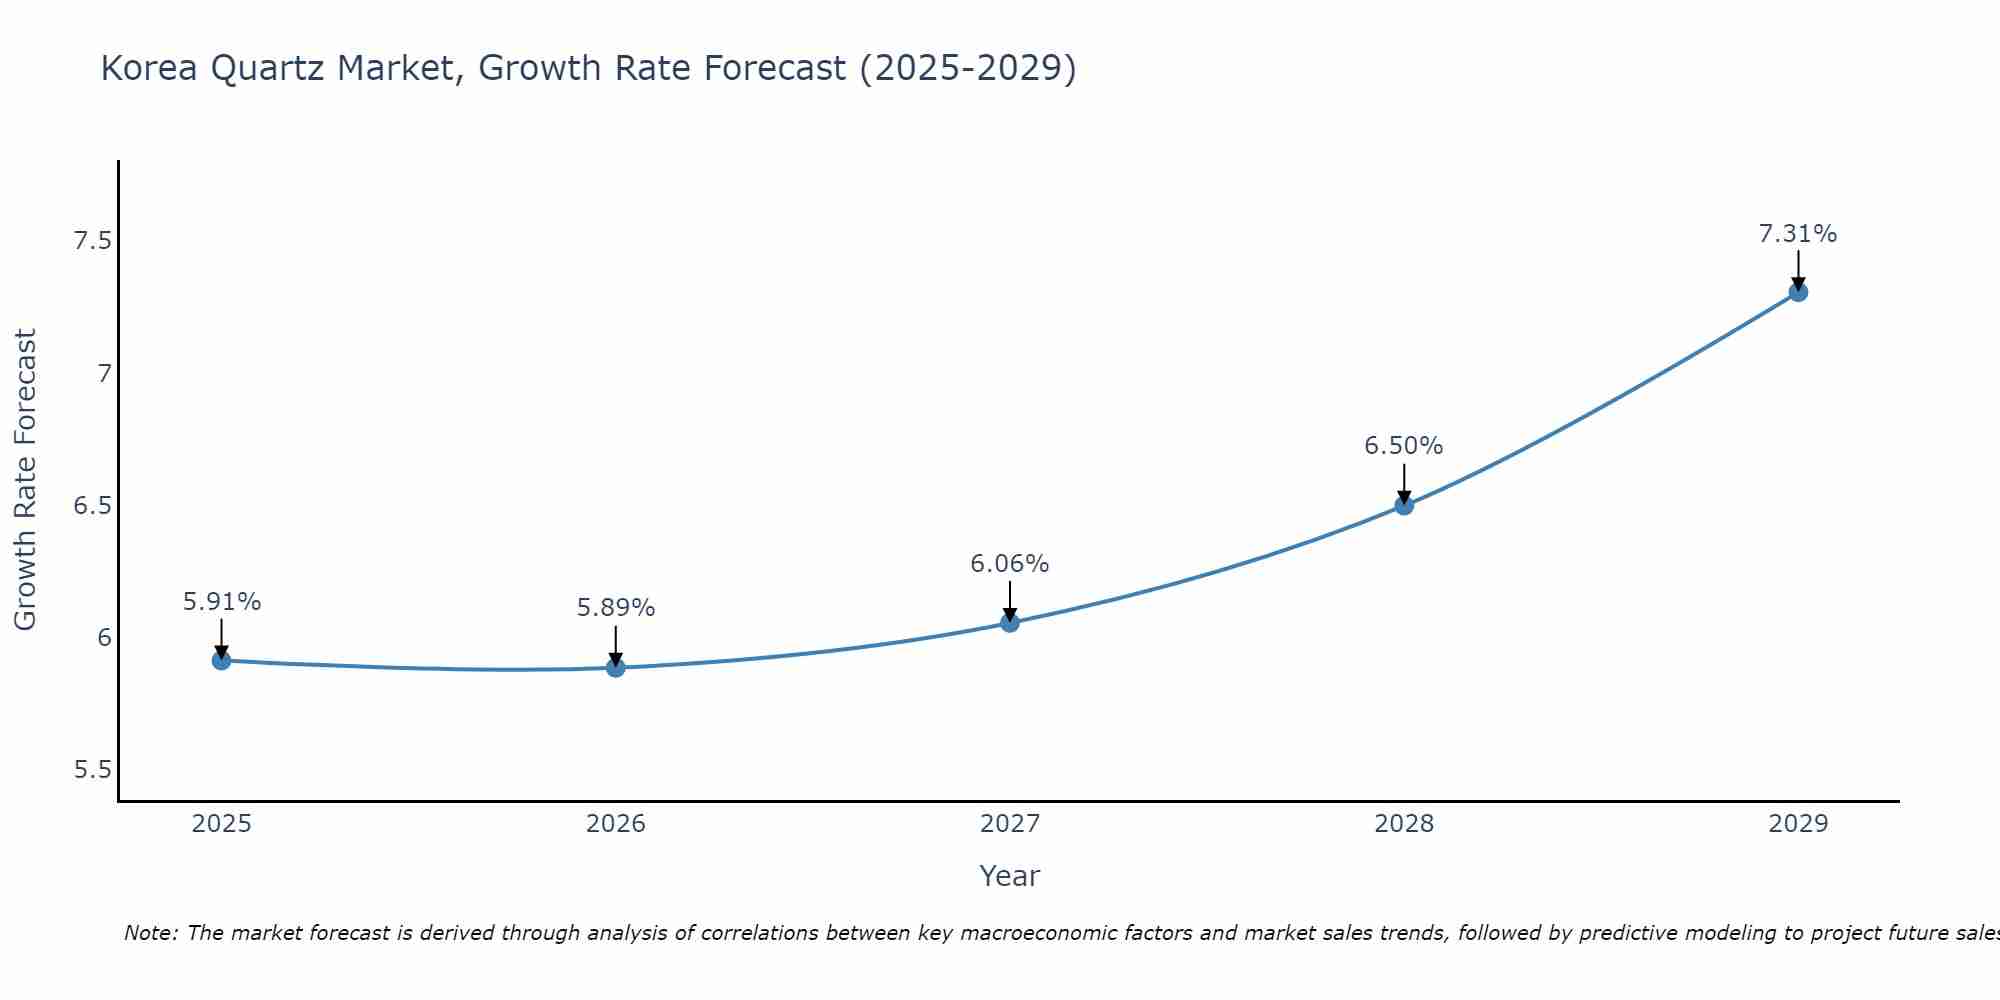
South Korea Quartz Market Size Growth Rate
The South Korea Quartz Market is projected to witness mixed growth rate patterns during 2025 to 2029. The growth rate starts at 5.91% in 2025 and reaches 7.31% by 2029.
south korea quartz market Synopsis
South Korea is expected to experience steady growth in the quartz market over the forecast period of 2020-2026. This can be attributed to its growing construction industry, owing to economic developments taking place in the country. Additionally, increasing investments by domestic and international investors towards modernizing infrastructure has further increased demand for quartz products such as countertops, tiles, flooring materials etc., which is likely to propel growth of South Korean quartz market over the forecast period. Moreover, rising disposable incomes among consumers have also augmented demand for luxury items such as kitchen counters made from premium quality stone material such as granite and marble or artificial alternatives like quartz which is projected to drive market growth during the forecast period. Furthermore, various government initiatives aimed at promoting building standards with focus on energy efficiency are likely to boost usage of advanced technology based materials including quartz leading with it a surge in product sales contributing significantly to overall revenue generated in this sector.
Key Highlights of the Report:
- South Korea Quartz Market Outlook
- Market Size of South Korea Quartz Market, 2019
- Forecast of South Korea Quartz Market, 2026
- Historical Data and Forecast of South Korea Quartz Revenues & Volume for the Period 2016 - 2026
- South Korea Quartz Market Trend Evolution
- South Korea Quartz Market Drivers and Challenges
- South Korea Quartz Price Trends
- South Korea Quartz Porter's Five Forces
- South Korea Quartz Industry Life Cycle
- Historical Data and Forecast of South Korea Quartz Market Revenues & Volume By Product Type for the Period 2016 - 2026
- Historical Data and Forecast of South Korea Quartz Market Revenues & Volume By Quartz Surface and Tile for the Period 2016 - 2026
- Historical Data and Forecast of South Korea Quartz Market Revenues & Volume By High-purity Quartz for the Period 2016 - 2026
- Historical Data and Forecast of South Korea Quartz Market Revenues & Volume By Quartz Glass for the Period 2016 - 2026
- Historical Data and Forecast of South Korea Quartz Market Revenues & Volume By Quartz Crystal for the Period 2016 - 2026
- Historical Data and Forecast of South Korea Quartz Market Revenues & Volume By Quartz Sand for the Period 2016 - 2026
- Historical Data and Forecast of South Korea Quartz Market Revenues & Volume By Others for the Period 2016 - 2026
- Historical Data and Forecast of South Korea Quartz Market Revenues & Volume By End-users for the Period 2016 - 2026
- Historical Data and Forecast of South Korea Quartz Market Revenues & Volume By Electronics and Semiconductor for the Period 2016 - 2026
- Historical Data and Forecast of South Korea Quartz Market Revenues & Volume By Solar for the Period 2016 - 2026
- Historical Data and Forecast of South Korea Quartz Market Revenues & Volume By Buildings and Construction for the Period 2016 - 2026
- Historical Data and Forecast of South Korea Quartz Market Revenues & Volume By Medical for the Period 2016 - 2026
- Historical Data and Forecast of South Korea Quartz Market Revenues & Volume By Optics and Telecommunication for the Period 2016 - 2026
- Historical Data and Forecast of South Korea Quartz Market Revenues & Volume By Other for the Period 2016 - 2026
- South Korea Quartz Import Export Trade Statistics
- Market Opportunity Assessment By Product Type
- Market Opportunity Assessment By End-users
- South Korea Quartz Top Companies Market Share
- South Korea Quartz Competitive Benchmarking By Technical and Operational Parameters
- South Korea Quartz Company Profiles
- South Korea Quartz Key Strategic Recommendations
Frequently Asked Questions About the Market Study (FAQs):
6Wresearch actively monitors the South Korea Quartz Market and publishes its comprehensive annual report, highlighting emerging trends, growth drivers, revenue analysis, and forecast outlook. Our insights help businesses to make data-backed strategic decisions with ongoing market dynamics. Our analysts track relevent industries related to the South Korea Quartz Market, allowing our clients with actionable intelligence and reliable forecasts tailored to emerging regional needs.
Yes, we provide customisation as per your requirements. To learn more, feel free to contact us on sales@6wresearch.com
1 Executive Summary |
2 Introduction |
2.1 Key Highlights of the Report |
2.2 Report Description |
2.3 Market Scope & Segmentation |
2.4 Research Methodology |
2.5 Assumptions |
3 South Korea Quartz Market Overview |
3.1 South Korea Country Macro Economic Indicators |
3.2 South Korea Quartz Market Revenues & Volume, 2019 & 2026F |
3.3 South Korea Quartz Market - Industry Life Cycle |
3.4 South Korea Quartz Market - Porter's Five Forces |
3.5 South Korea Quartz Market Revenues & Volume Share, By Product Type, 2019 & 2026F |
3.6 South Korea Quartz Market Revenues & Volume Share, By End-users, 2019 & 2026F |
4 South Korea Quartz Market Dynamics |
4.1 Impact Analysis |
4.2 Market Drivers |
4.2.1 Growing demand for premium and high-quality materials in construction and interior design sectors. |
4.2.2 Increasing awareness about the benefits of quartz over other countertop materials like granite and marble. |
4.2.3 Rising disposable income and changing lifestyle preferences leading to higher spending on home renovations. |
4.2.4 Innovation in quartz manufacturing processes, resulting in a wider variety of colors and patterns. |
4.2.5 Government initiatives promoting sustainable and eco-friendly building materials. |
4.3 Market Restraints |
4.3.1 Fluctuating raw material prices impacting manufacturing costs. |
4.3.2 Intense competition in the quartz market leading to price wars and margin pressures. |
4.3.3 Challenges related to product differentiation and brand positioning in a crowded market. |
4.3.4 Economic uncertainties affecting consumer confidence and spending on luxury items. |
4.3.5 Environmental concerns regarding the mining and processing of quartz. |
5 South Korea Quartz Market Trends |
6 South Korea Quartz Market, By Types |
6.1 South Korea Quartz Market, By Product Type |
6.1.1 Overview and Analysis |
6.1.2 South Korea Quartz Market Revenues & Volume, By Product Type, 2016 - 2026F |
6.1.3 South Korea Quartz Market Revenues & Volume, By Quartz Surface and Tile, 2016 - 2026F |
6.1.4 South Korea Quartz Market Revenues & Volume, By High-purity Quartz , 2016 - 2026F |
6.1.5 South Korea Quartz Market Revenues & Volume, By Quartz Glass , 2016 - 2026F |
6.1.6 South Korea Quartz Market Revenues & Volume, By Quartz Crystal , 2016 - 2026F |
6.1.7 South Korea Quartz Market Revenues & Volume, By Quartz Sand , 2016 - 2026F |
6.1.8 South Korea Quartz Market Revenues & Volume, By Others, 2016 - 2026F |
6.2 South Korea Quartz Market, By End-users |
6.2.1 Overview and Analysis |
6.2.2 South Korea Quartz Market Revenues & Volume, By Electronics and Semiconductor, 2016 - 2026F |
6.2.3 South Korea Quartz Market Revenues & Volume, By Solar, 2016 - 2026F |
6.2.4 South Korea Quartz Market Revenues & Volume, By Buildings and Construction, 2016 - 2026F |
6.2.5 South Korea Quartz Market Revenues & Volume, By Medical, 2016 - 2026F |
6.2.6 South Korea Quartz Market Revenues & Volume, By Optics and Telecommunication, 2016 - 2026F |
6.2.7 South Korea Quartz Market Revenues & Volume, By Other, 2016 - 2026F |
7 South Korea Quartz Market Import-Export Trade Statistics |
7.1 South Korea Quartz Market Export to Major Countries |
7.2 South Korea Quartz Market Imports from Major Countries |
8 South Korea Quartz Market Key Performance Indicators |
8.1 Average selling price (ASP) of quartz products in the South Korea market. |
8.2 Number of new product launches and innovations in the quartz segment. |
8.3 Percentage of market share held by eco-friendly quartz manufacturers. |
8.4 Customer satisfaction score related to the durability and aesthetics of quartz countertops. |
8.5 Adoption rate of quartz in commercial projects and high-end residential developments. |
9 South Korea Quartz Market - Opportunity Assessment |
9.1 South Korea Quartz Market Opportunity Assessment, By Product Type, 2019 & 2026F |
9.2 South Korea Quartz Market Opportunity Assessment, By End-users, 2019 & 2026F |
10 South Korea Quartz Market - Competitive Landscape |
10.1 South Korea Quartz Market Revenue Share, By Companies, 2019 |
10.2 South Korea Quartz Market Competitive Benchmarking, By Operating and Technical Parameters |
11 Company Profiles |
12 Recommendations |
13 Disclaimer |
Global Go To Market Strategy - 2030
Export potential enables firms to identify high-growth global markets with greater confidence by combining advanced trade intelligence with a structured quantitative methodology. The framework analyzes emerging demand trends and country-level import patterns while integrating macroeconomic and trade datasets such as GDP and population forecasts, bilateral import–export flows, tariff structures, elasticity differentials between developed and developing economies, geographic distance, and import demand projections. Using weighted trade values from 2020–2024 as the base period to project country-to-country export potential for 2030, these inputs are operationalized through calculated drivers such as gravity model parameters, tariff impact factors, and projected GDP per-capita growth. Through an analysis of hidden potentials, demand hotspots, and market conditions that are most favorable to success, this method enables firms to focus on target countries, maximize returns, and global expansion with data, backed by accuracy.
By factoring in the projected importer demand gap that is currently unmet and could be potential opportunity, it identifies the potential for the Exporter (Country) among 190 countries, against the general trade analysis, which identifies the biggest importer or exporter.
To discover high-growth global markets and optimize your business strategy:
Click Here
Pricing
- Single User License$ 1,995
- Department License$ 2,400
- Site License$ 3,120
- Global License$ 3,795

Leadership Perspectives from Industry Events
Search
Thought Leadership and Analyst Meet


Our Clients
6WResearch In News
- India Export Attractiveness Tracker 2026
- India Air Conditioner Market Set for Strong Rebound in 2026 After Weather-Led Correction and GST-Driven Recovery: 6Wresearch
- ADAS in India: How Automatic Emergency Braking, Blind Spot Detection & Driver Monitoring are Transforming Road Safety
- Doha a strategic location for EV manufacturing hub: IPA Qatar
- Demand for luxury TVs surging in the GCC, says Samsung
- Empowering Growth: The Thriving Journey of Bangladesh’s Cable Industry
Latest Reports
- Nicaragua RPG Gaming Market (2026-2032)
- New Zealand RPG Gaming Market (2026-2032)
- Netherlands RPG Gaming Market (2026-2032)
- Nauru RPG Gaming Market (2026-2032)
- Namibia RPG Gaming Market (2026-2032)
- Mozambique RPG Gaming Market (2026-2032)
- Montenegro RPG Gaming Market (2026-2032)
- Mongolia RPG Gaming Market (2026-2032)
- Monaco RPG Gaming Market (2026-2032)
- Micronesia RPG Gaming Market (2026-2032)
Industry Events and Analyst Meet

EV India Expo 2026

HIMTEX 2026

India Refining Summit 2026

India EV Show 2026

EV tech India Expo 2026
Whitepaper
- Middle East & Africa Commercial Security Market Click here to view more.
- Middle East & Africa Fire Safety Systems & Equipment Market Click here to view more.
- GCC Drone Market Click here to view more.
- Middle East Lighting Fixture Market Click here to view more.
- GCC Physical & Perimeter Security Market Click here to view more.