Spain Chlorine Market Outlook | Revenue, Share, Companies, Industry, Size, Forecast, Trends, Analysis, Growth, Value & COVID-19 IMPACT
Market Forecast By Application (EDC/PVC, Isocyanates and Oxygenates, Chloromethanes, Solvents and Epichlorohydrin, Inorganic Chemicals, Other Applications), By End-user Industry (Water Treatment, Pharmaceutical, Chemicals, Paper and Pulp, Plastic, Pesticides, Other End-user Industries) And Competitive Landscape
| Product Code: ETC191246 | Publication Date: May 2022 | Updated Date: Apr 2026 | Product Type: Market Research Report | |
| Publisher: 6Wresearch | Author: Ravi Bhandari | No. of Pages: 60 | No. of Figures: 40 | No. of Tables: 7 |
Spain Chlorine Market Size (2020-2030)
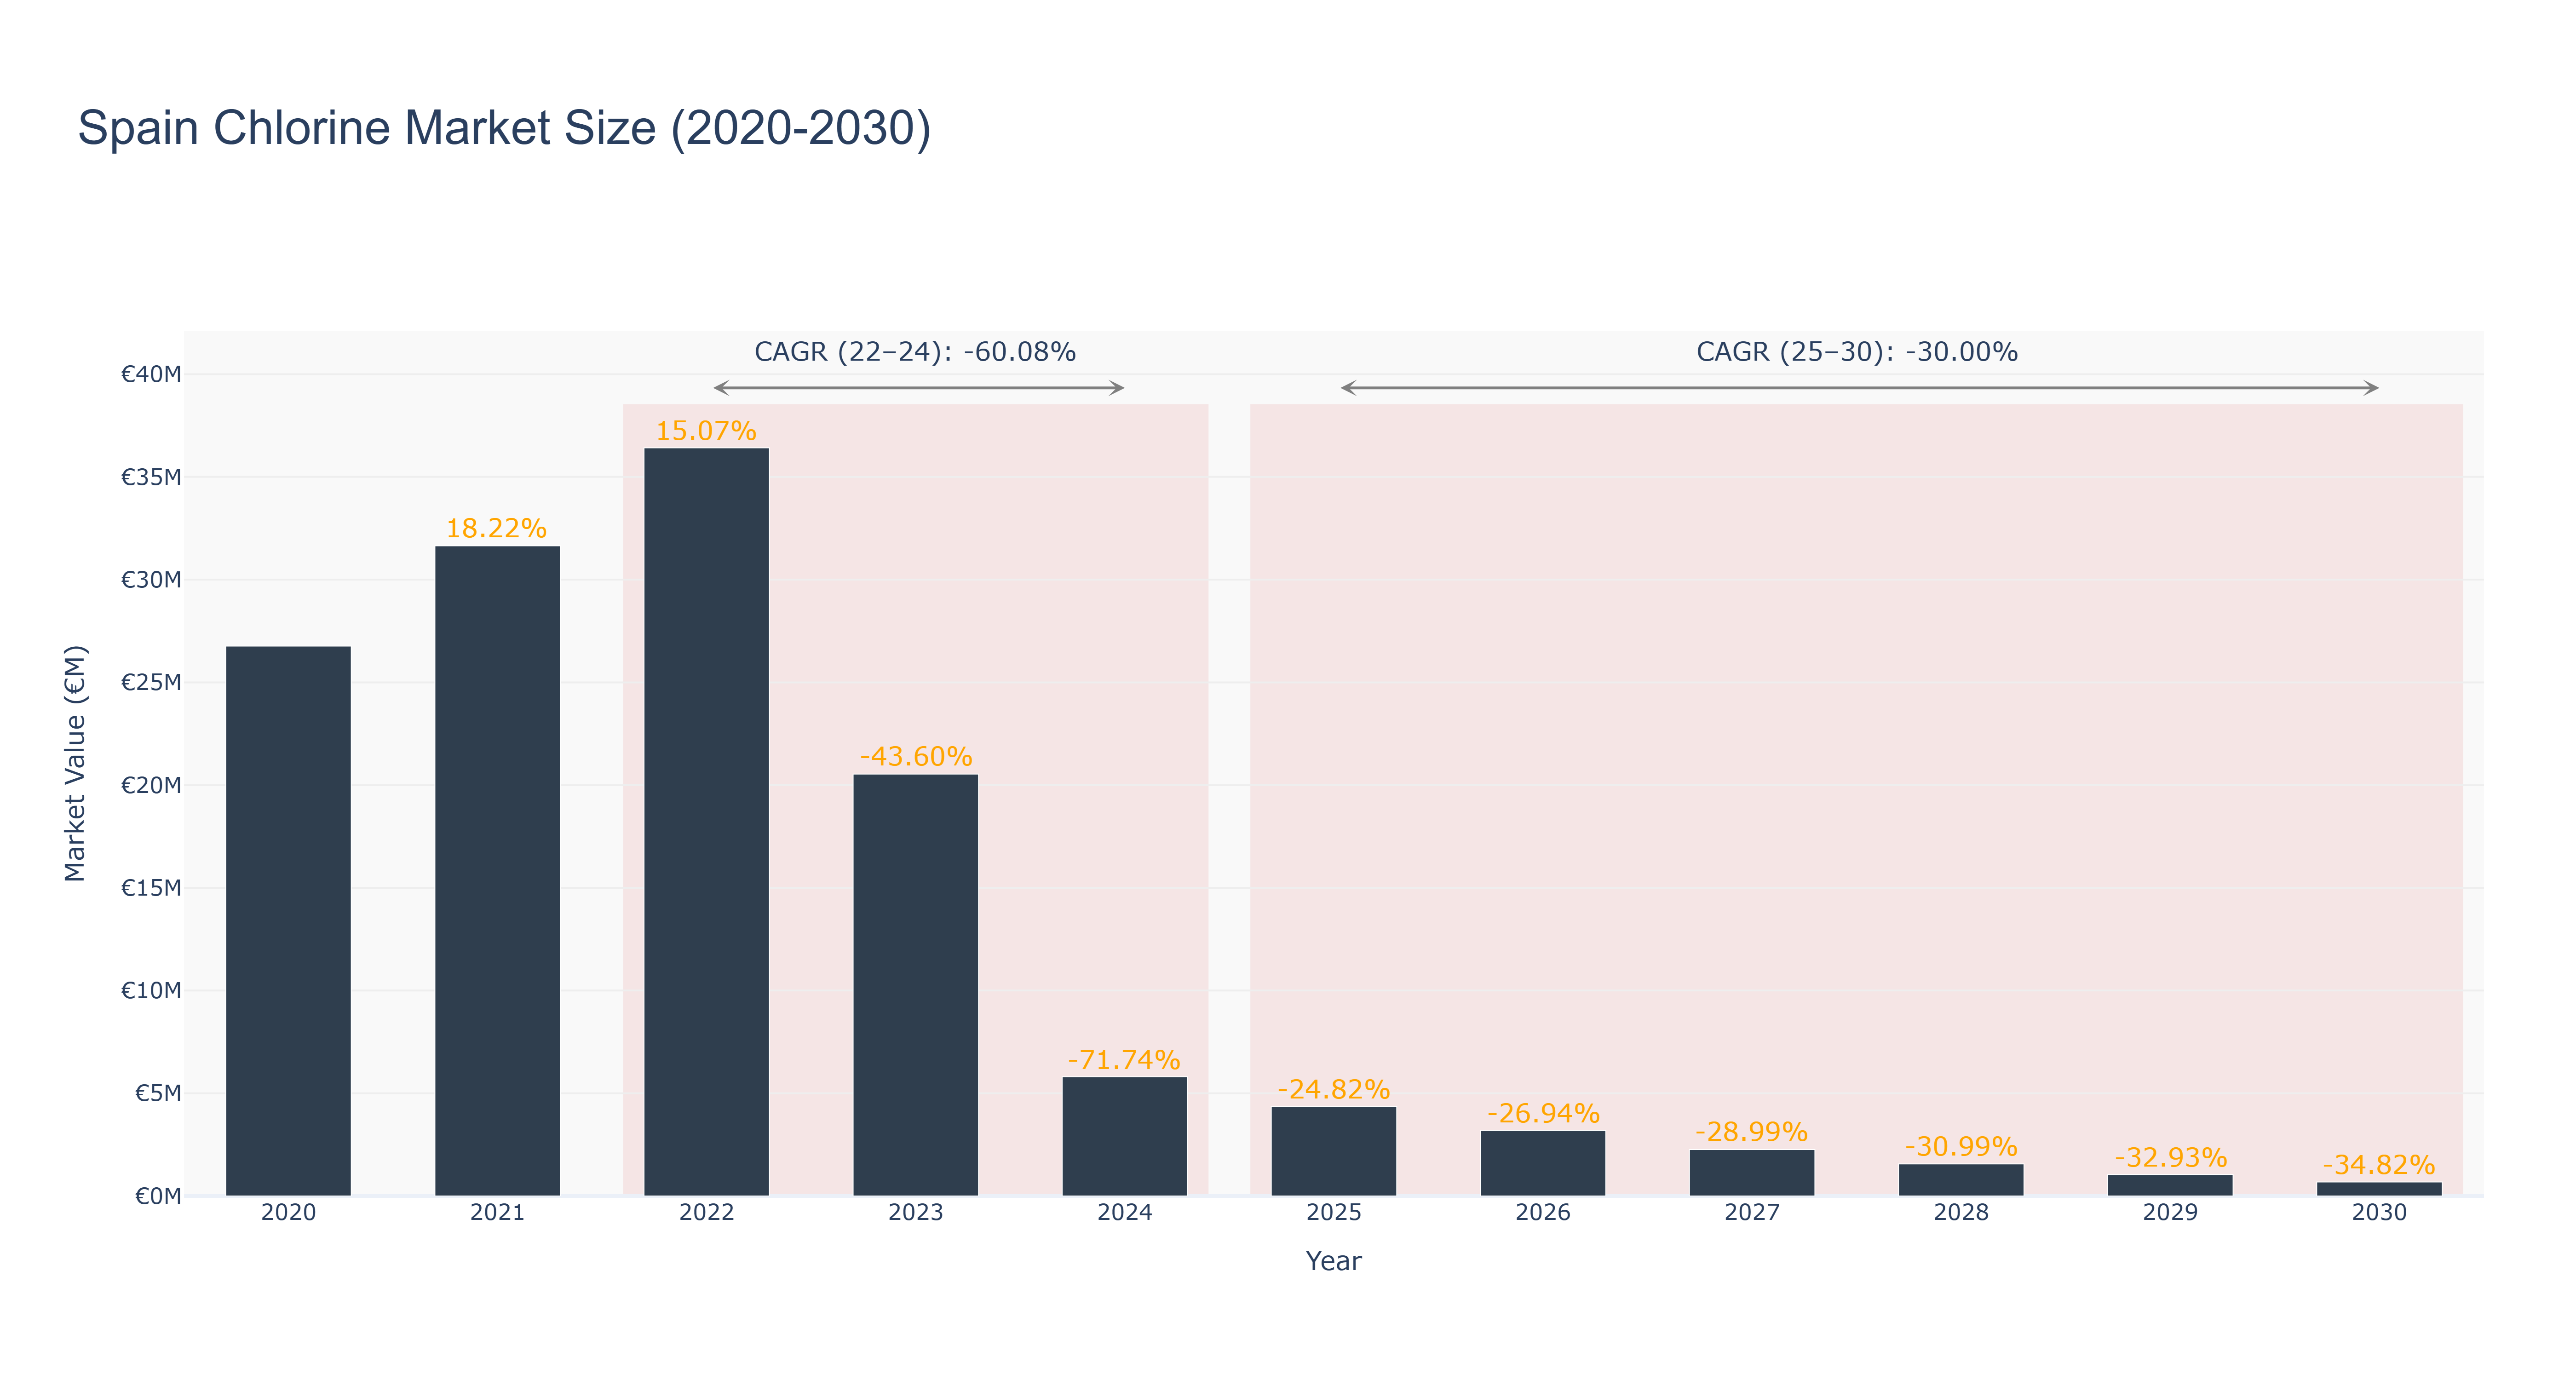
Spain Chlorine Market has experienced a significant decline in market size over the past decade. The peak market size of €36.42 million was recorded in 2022, followed by a drastic drop to €5.80 million in 2024. The forecasted market size continues to decrease, with an estimated value of €0.68 million in 2030. The CAGR for the period 2022-24 was -60.08%, reflecting a sharp downturn, while the CAGR for 2025-30 is projected at -30.0%. The market's decline can be attributed to factors such as evolving environmental regulations, technological advancements leading to reduced chlorine usage, and shifting consumer preferences towards eco-friendly alternatives. Despite the challenging market conditions, Spain is set to invest in sustainable water treatment projects to enhance environmental protection and public health in the near future. Industry drivers include the growing focus on sustainability and stringent regulatory requirements.
Spain Chlorine Market: Production & Trade Performance (2019-2025)
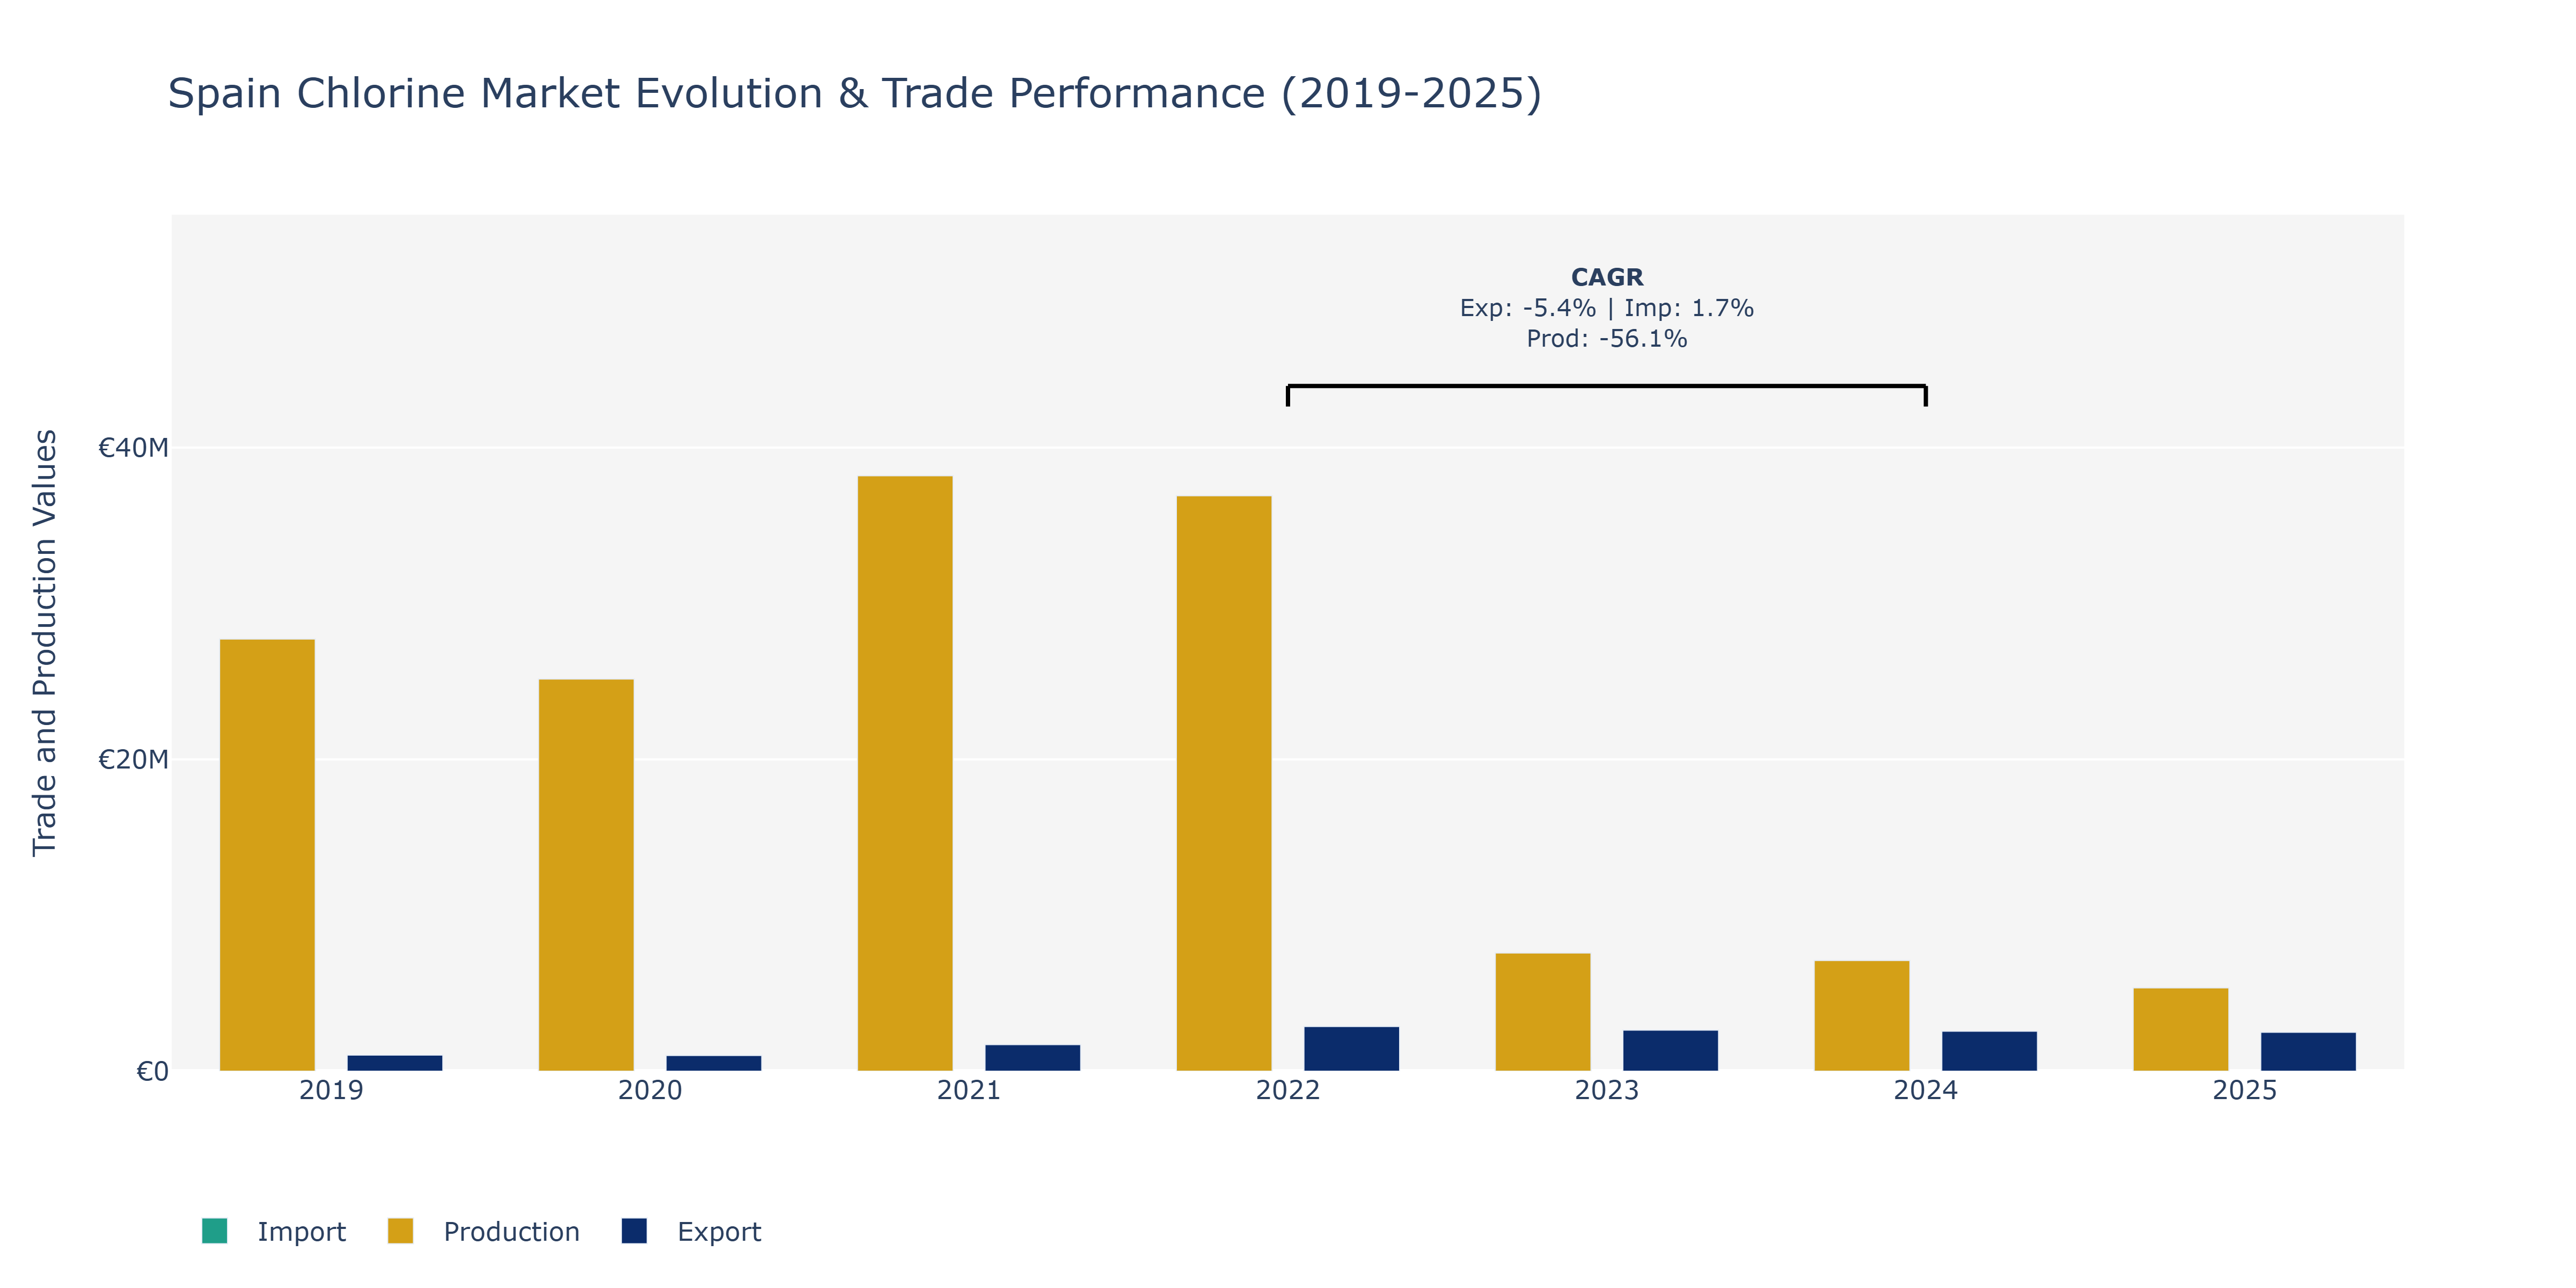
In the Spain Chlorine Market, exports experienced a downward trend from 2019 to 2025, with a peak value of €2.87 million in 2022, followed by a moderate decline. Imports, on the other hand, fluctuated over the years, reaching their highest point in 2020 at €1.17 million before decreasing slightly by 2025. Production in the market exhibited a significant decline from €38.19 million in 2021 to €5.34 million in 2025, reflecting a challenging period for domestic manufacturing. The fluctuations in exports and imports could be attributed to global demand shifts, trade agreements, and economic conditions impacting Spain's competitiveness in the chlorine market. The substantial production drop might be influenced by environmental regulations, technological advancements, or changes in consumer preferences towards more sustainable alternatives, as seen in the industry reports highlighting the transition towards greener chemicals production methods.
Spain Chlorine Market Overview
The chlorine market in Spain is pivotal for industries such as water treatment, chemicals, and pharmaceuticals. As environmental regulations tighten, the market is witnessing a shift towards more sustainable chlorine production methods. The increasing focus on water quality and safety is driving demand for chlorine in municipal and industrial applications, reinforcing its significance in public health.
Drivers of the market
The chlorine market in Spain is propelled by its critical role in the production of various chemicals, including PVC and disinfectants. The growth of the construction and healthcare sectors fuels the demand for chlorine-based products. Additionally, increasing environmental regulations encourage the use of chlorine in water treatment processes, further driving market growth.
Challenges of the market
The Spain chlorine market is impacted by environmental concerns related to the use and disposal of chlorine products. Regulatory challenges, including compliance with safety standards, can increase operational complexities for manufacturers. Additionally, the emergence of alternative disinfecting technologies poses competitive threats.
Government Policy of the market
The chlorine market in Spain is influenced by environmental policies aimed at reducing chemical pollution. Regulatory frameworks govern the production, distribution, and use of chlorine, ensuring that safety standards are met. Additionally, the government promotes the development of safer chemical alternatives.
Key Highlights of the Report:
- Spain Chlorine Market Outlook
- Market Size of Spain Chlorine Market, 2024
- Forecast of Spain Chlorine Market, 2031
- Historical Data and Forecast of Spain Chlorine Revenues & Volume for the Period 2018 - 2031
- Spain Chlorine Market Trend Evolution
- Spain Chlorine Market Drivers and Challenges
- Spain Chlorine Price Trends
- Spain Chlorine Porter's Five Forces
- Spain Chlorine Industry Life Cycle
- Historical Data and Forecast of Spain Chlorine Market Revenues & Volume By Application for the Period 2018 - 2031
- Historical Data and Forecast of Spain Chlorine Market Revenues & Volume By EDC/PVC for the Period 2018 - 2031
- Historical Data and Forecast of Spain Chlorine Market Revenues & Volume By Isocyanates and Oxygenates for the Period 2018 - 2031
- Historical Data and Forecast of Spain Chlorine Market Revenues & Volume By Chloromethanes for the Period 2018 - 2031
- Historical Data and Forecast of Spain Chlorine Market Revenues & Volume By Solvents and Epichlorohydrin for the Period 2018 - 2031
- Historical Data and Forecast of Spain Chlorine Market Revenues & Volume By Inorganic Chemicals for the Period 2018 - 2031
- Historical Data and Forecast of Spain Chlorine Market Revenues & Volume By Other Applications for the Period 2018 - 2031
- Historical Data and Forecast of Spain Chlorine Market Revenues & Volume By End-user Industry for the Period 2018 - 2031
- Historical Data and Forecast of Spain Chlorine Market Revenues & Volume By Water Treatment for the Period 2018 - 2031
- Historical Data and Forecast of Spain Chlorine Market Revenues & Volume By Pharmaceutical for the Period 2018 - 2031
- Historical Data and Forecast of Spain Chlorine Market Revenues & Volume By Chemicals for the Period 2018 - 2031
- Historical Data and Forecast of Spain Chlorine Market Revenues & Volume By Paper and Pulp for the Period 2018 - 2031
- Historical Data and Forecast of Spain Chlorine Market Revenues & Volume By Plastic for the Period 2018 - 2031
- Historical Data and Forecast of Spain Chlorine Market Revenues & Volume By Pesticides for the Period 2018 - 2031
- Historical Data and Forecast of Spain Chlorine Market Revenues & Volume By Other End-user Industries for the Period 2018 - 2031
- Spain Chlorine Import Export Trade Statistics
- Market Opportunity Assessment By Application
- Market Opportunity Assessment By End-user Industry
- Spain Chlorine Top Companies Market Share
- Spain Chlorine Competitive Benchmarking By Technical and Operational Parameters
- Spain Chlorine Company Profiles
- Spain Chlorine Key Strategic Recommendations
Frequently Asked Questions About the Market Study (FAQs):
6Wresearch actively monitors the Spain Chlorine Market and publishes its comprehensive annual report, highlighting emerging trends, growth drivers, revenue analysis, and forecast outlook. Our insights help businesses to make data-backed strategic decisions with ongoing market dynamics. Our analysts track relevent industries related to the Spain Chlorine Market, allowing our clients with actionable intelligence and reliable forecasts tailored to emerging regional needs.
Yes, we provide customisation as per your requirements. To learn more, feel free to contact us on sales@6wresearch.com
1 Executive Summary |
2 Introduction |
2.1 Key Highlights of the Report |
2.2 Report Description |
2.3 Market Scope & Segmentation |
2.4 Research Methodology |
2.5 Assumptions |
3 Spain Chlorine Market Overview |
3.1 Spain Country Macro Economic Indicators |
3.2 Spain Chlorine Market Revenues & Volume, 2021 & 2031F |
3.3 Spain Chlorine Market - Industry Life Cycle |
3.4 Spain Chlorine Market - Porter's Five Forces |
3.5 Spain Chlorine Market Revenues & Volume Share, By Application, 2021 & 2031F |
3.6 Spain Chlorine Market Revenues & Volume Share, By End-user Industry, 2021 & 2031F |
4 Spain Chlorine Market Dynamics |
4.1 Impact Analysis |
4.2 Market Drivers |
4.2.1 Increasing demand for chlorine in water treatment and sanitation applications |
4.2.2 Growth in the chemical industry in Spain driving the demand for chlorine |
4.2.3 Rising awareness about the importance of hygiene and sanitation post-COVID-19 pandemic |
4.3 Market Restraints |
4.3.1 Fluctuating raw material prices impacting the production cost of chlorine |
4.3.2 Stringent environmental regulations on the use and disposal of chlorine |
4.3.3 Competition from alternative water treatment technologies affecting the demand for chlorine |
5 Spain Chlorine Market Trends |
6 Spain Chlorine Market, By Types |
6.1 Spain Chlorine Market, By Application |
6.1.1 Overview and Analysis |
6.1.2 Spain Chlorine Market Revenues & Volume, By Application, 2021-2031F |
6.1.3 Spain Chlorine Market Revenues & Volume, By EDC/PVC, 2021-2031F |
6.1.4 Spain Chlorine Market Revenues & Volume, By Isocyanates and Oxygenates, 2021-2031F |
6.1.5 Spain Chlorine Market Revenues & Volume, By Chloromethanes, 2021-2031F |
6.1.6 Spain Chlorine Market Revenues & Volume, By Solvents and Epichlorohydrin, 2021-2031F |
6.1.7 Spain Chlorine Market Revenues & Volume, By Inorganic Chemicals, 2021-2031F |
6.1.8 Spain Chlorine Market Revenues & Volume, By Other Applications, 2021-2031F |
6.2 Spain Chlorine Market, By End-user Industry |
6.2.1 Overview and Analysis |
6.2.2 Spain Chlorine Market Revenues & Volume, By Water Treatment, 2021-2031F |
6.2.3 Spain Chlorine Market Revenues & Volume, By Pharmaceutical, 2021-2031F |
6.2.4 Spain Chlorine Market Revenues & Volume, By Chemicals, 2021-2031F |
6.2.5 Spain Chlorine Market Revenues & Volume, By Paper and Pulp, 2021-2031F |
6.2.6 Spain Chlorine Market Revenues & Volume, By Plastic, 2021-2031F |
6.2.7 Spain Chlorine Market Revenues & Volume, By Pesticides, 2021-2031F |
7 Spain Chlorine Market Import-Export Trade Statistics |
7.1 Spain Chlorine Market Export to Major Countries |
7.2 Spain Chlorine Market Imports from Major Countries |
8 Spain Chlorine Market Key Performance Indicators |
8.1 Percentage increase in the number of water treatment plants using chlorine |
8.2 Adoption rate of chlorine in industrial manufacturing processes |
8.3 Number of new applications or industries utilizing chlorine technology |
9 Spain Chlorine Market - Opportunity Assessment |
9.1 Spain Chlorine Market Opportunity Assessment, By Application, 2021 & 2031F |
9.2 Spain Chlorine Market Opportunity Assessment, By End-user Industry, 2021 & 2031F |
10 Spain Chlorine Market - Competitive Landscape |
10.1 Spain Chlorine Market Revenue Share, By Companies, 2024 |
10.2 Spain Chlorine Market Competitive Benchmarking, By Operating and Technical Parameters |
11 Company Profiles |
12 Recommendations |
13 Disclaimer |
Global Go To Market Strategy - 2030
Export potential enables firms to identify high-growth global markets with greater confidence by combining advanced trade intelligence with a structured quantitative methodology. The framework analyzes emerging demand trends and country-level import patterns while integrating macroeconomic and trade datasets such as GDP and population forecasts, bilateral import–export flows, tariff structures, elasticity differentials between developed and developing economies, geographic distance, and import demand projections. Using weighted trade values from 2020–2024 as the base period to project country-to-country export potential for 2030, these inputs are operationalized through calculated drivers such as gravity model parameters, tariff impact factors, and projected GDP per-capita growth. Through an analysis of hidden potentials, demand hotspots, and market conditions that are most favorable to success, this method enables firms to focus on target countries, maximize returns, and global expansion with data, backed by accuracy.
By factoring in the projected importer demand gap that is currently unmet and could be potential opportunity, it identifies the potential for the Exporter (Country) among 190 countries, against the general trade analysis, which identifies the biggest importer or exporter.
To discover high-growth global markets and optimize your business strategy:
Click Here
Pricing
- Single User License$ 1,995
- Department License$ 2,400
- Site License$ 3,120
- Global License$ 3,795

Leadership Perspectives from Industry Events
Search
Thought Leadership and Analyst Meet


Our Clients
6WResearch In News
- India Export Attractiveness Tracker 2026
- India Air Conditioner Market Set for Strong Rebound in 2026 After Weather-Led Correction and GST-Driven Recovery: 6Wresearch
- ADAS in India: How Automatic Emergency Braking, Blind Spot Detection & Driver Monitoring are Transforming Road Safety
- Doha a strategic location for EV manufacturing hub: IPA Qatar
- Demand for luxury TVs surging in the GCC, says Samsung
- Empowering Growth: The Thriving Journey of Bangladesh’s Cable Industry
Latest Reports
- Nicaragua RPG Gaming Market (2026-2032)
- New Zealand RPG Gaming Market (2026-2032)
- Netherlands RPG Gaming Market (2026-2032)
- Nauru RPG Gaming Market (2026-2032)
- Namibia RPG Gaming Market (2026-2032)
- Mozambique RPG Gaming Market (2026-2032)
- Montenegro RPG Gaming Market (2026-2032)
- Mongolia RPG Gaming Market (2026-2032)
- Monaco RPG Gaming Market (2026-2032)
- Micronesia RPG Gaming Market (2026-2032)
Industry Events and Analyst Meet

EV India Expo 2026

HIMTEX 2026

India Refining Summit 2026

India EV Show 2026

EV tech India Expo 2026
Whitepaper
- Middle East & Africa Commercial Security Market Click here to view more.
- Middle East & Africa Fire Safety Systems & Equipment Market Click here to view more.
- GCC Drone Market Click here to view more.
- Middle East Lighting Fixture Market Click here to view more.
- GCC Physical & Perimeter Security Market Click here to view more.