Sri Lanka Bioinsecticides Market (2026-2032) Outlook | Growth, Revenue, Forecast, Trends, Value, Industry, Companies, Size, Share & Analysis
Market Forecast By Organism Type (Bacteria Thuringiensis, Beauveria Bassiana, Metarhizium Anisopliae), By Type (Microbials , Macrobials) And Competitive Landscape
| Product Code: ETC4600292 | Publication Date: Jul 2023 | Updated Date: Mar 2026 | Product Type: Report | |
| Publisher: 6Wresearch | Author: Ravi Bhandari | No. of Pages: 85 | No. of Figures: 45 | No. of Tables: 25 |
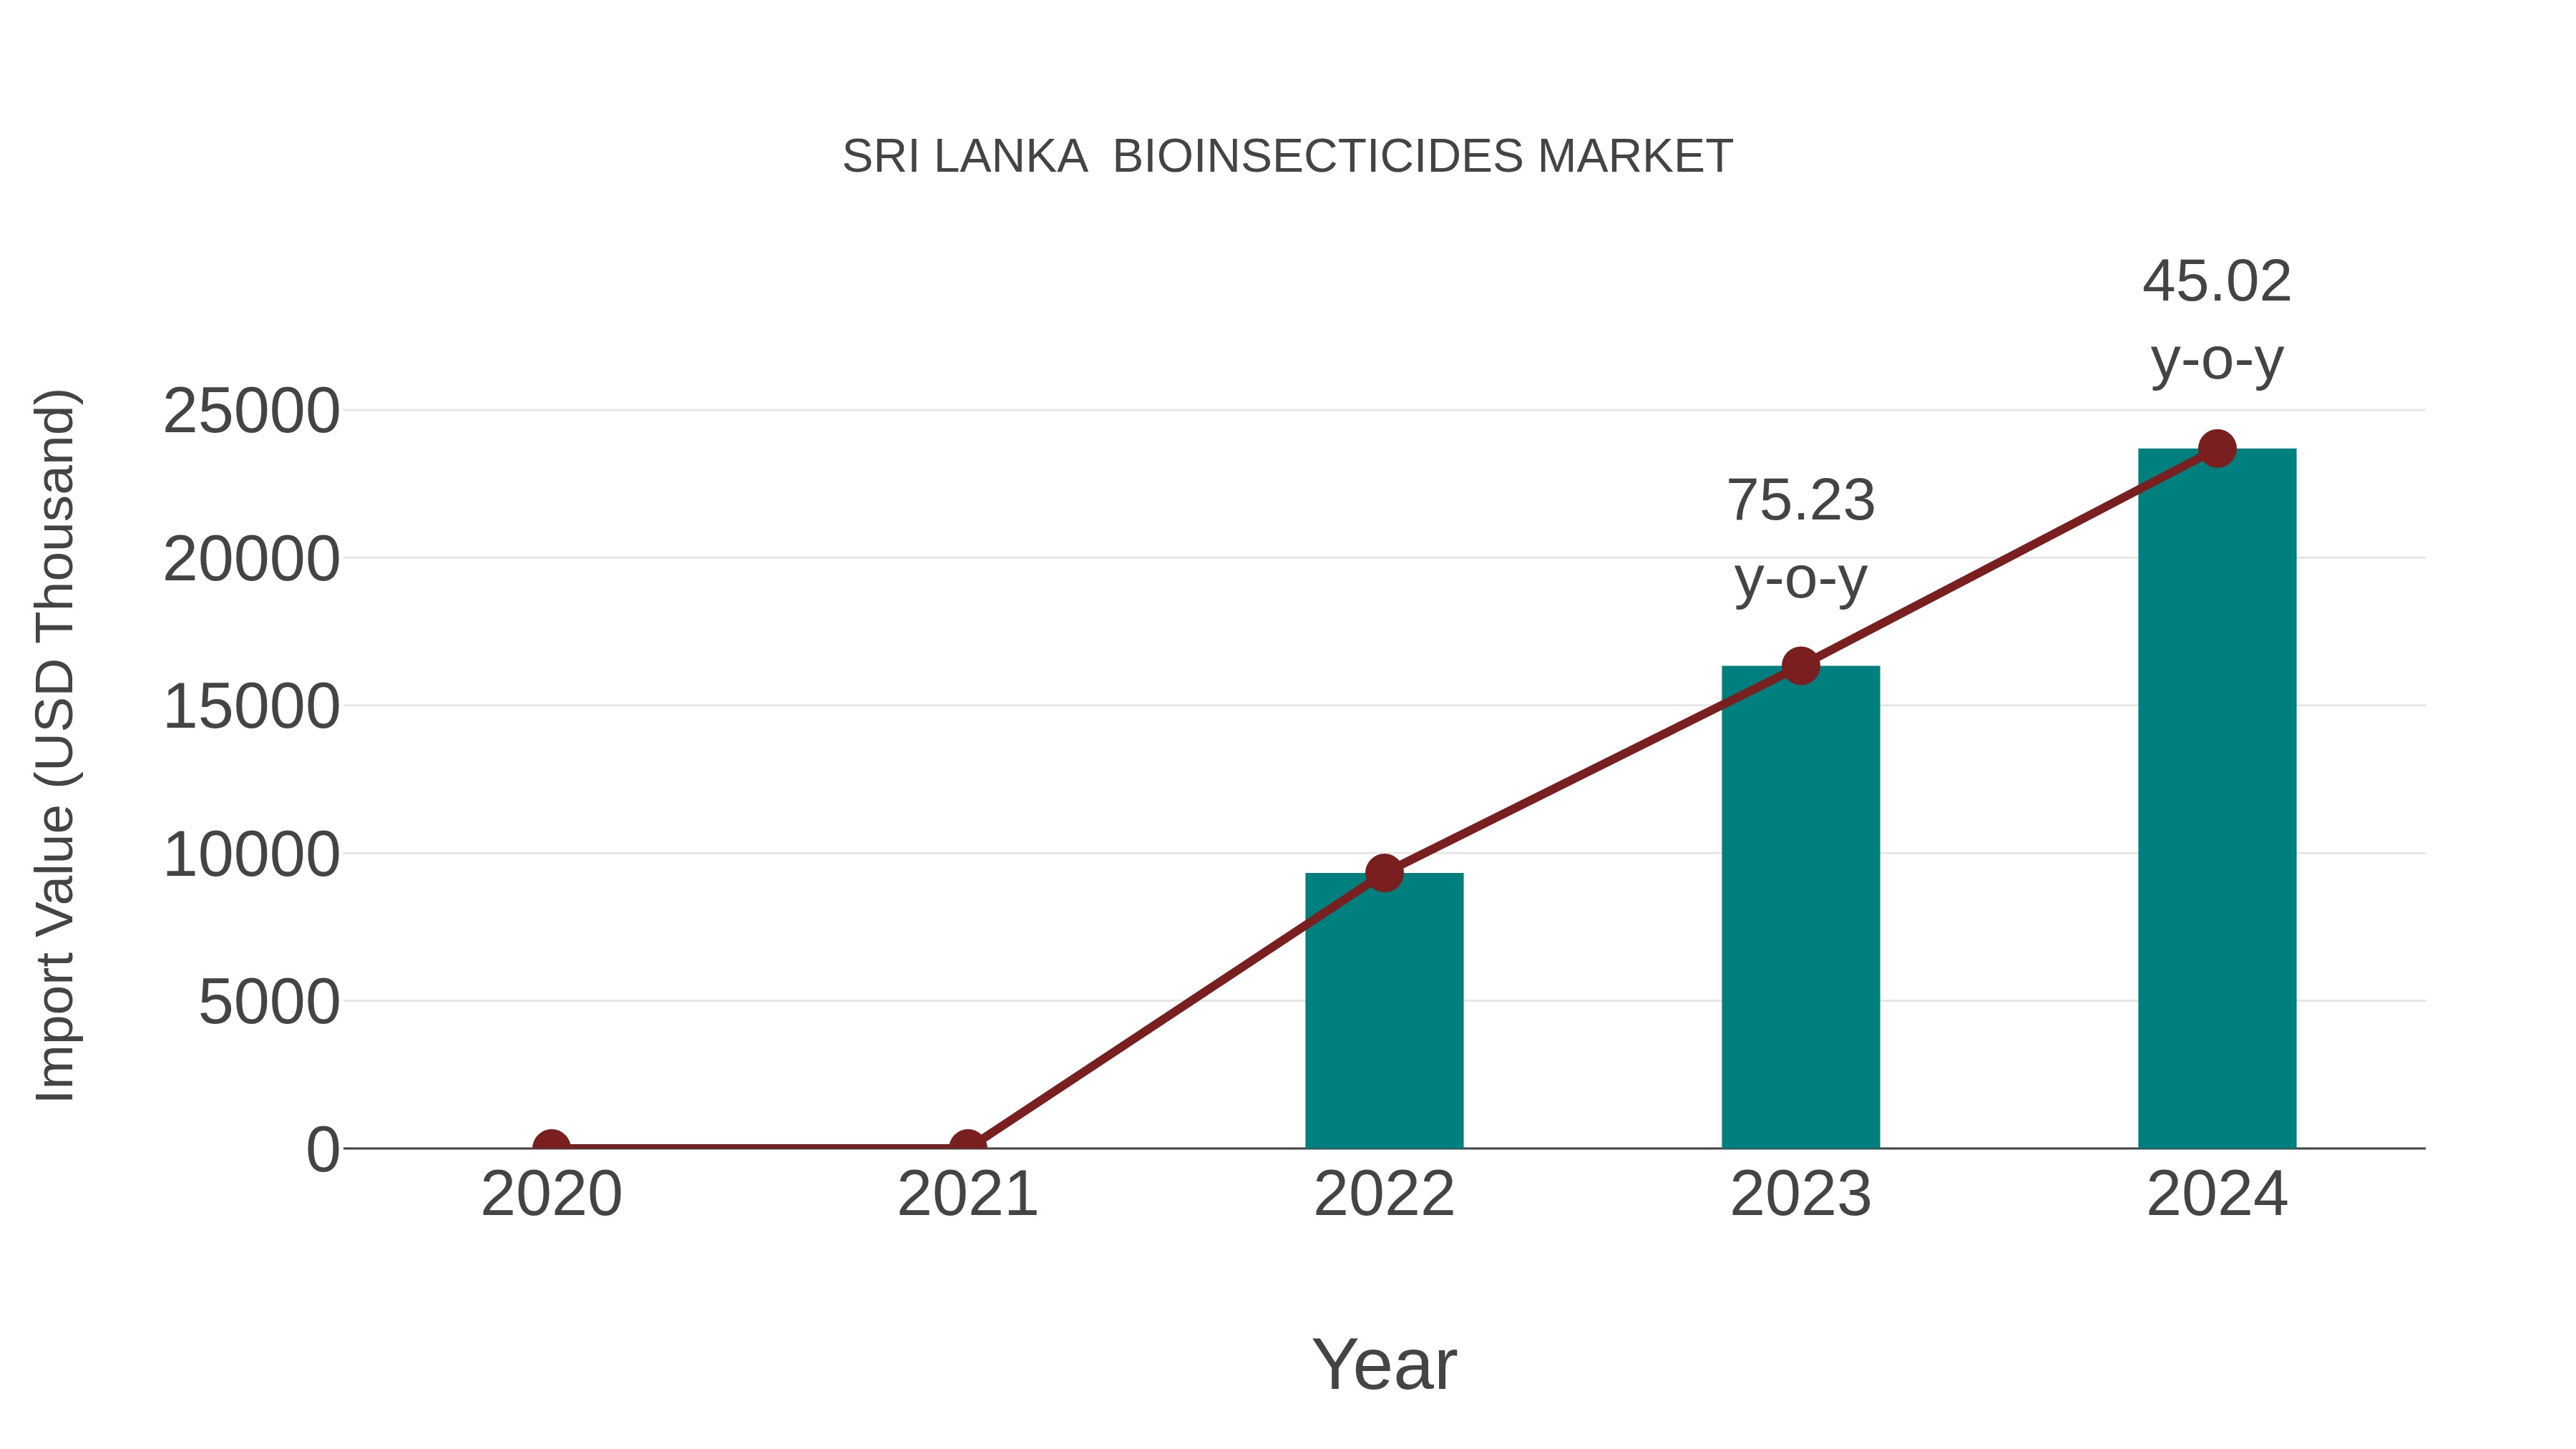
Sri Lanka Bioinsecticides Market: Import Trend Analysis
Sri Lanka import trend for the bioinsecticides market showed significant growth from 2023 to 2024, with a growth rate of 45.02%. The compound annual growth rate (CAGR) for the period 2020-2024 was 59.41%. This surge can be attributed to increasing awareness of sustainable agricultural practices in the region.
Sri Lanka Bioinsecticides Market Overview
Sri Lanka bioinsecticides market is expanding due to the increasing emphasis on sustainable agriculture. Bioinsecticides, derived from natural sources, offer an eco-friendly alternative to chemical pesticides. The market growth is driven by the rising demand for organic produce and the need to reduce the environmental impact of conventional farming practices.
Drivers of the market
The bioinsecticides market in Sri Lanka is driven by the growing agricultural sector`s need for sustainable and environmentally friendly pest control solutions. Increasing awareness of the adverse effects of chemical pesticides on health and the environment is leading to a shift towards bioinsecticides. Additionally, government support and regulations promoting organic farming practices are further boosting the market.
Challenges of the market
The bioinsecticides market in Sri Lanka is impeded by regulatory challenges and the slow approval process for new products. Farmers and agricultural professionals often lack awareness and training on the benefits and proper usage of bioinsecticides. Additionally, bioinsecticides tend to be more expensive and have a shorter shelf life compared to synthetic insecticides, which discourages widespread adoption despite their environmental benefits.
Government Policy of the market
The Sri Lankan government encourages the use of bioinsecticides through policies aimed at reducing chemical pesticide use and promoting organic farming. Subsidies and technical support are provided to farmers transitioning to bioinsecticides. Additionally, there are stringent regulations on the registration and use of bioinsecticides to ensure their effectiveness and safety for both humans and the environment.
Key Highlights of the Report:
- Sri Lanka Bioinsecticides Market Outlook
- Market Size of Sri Lanka Bioinsecticides Market, 2025
- Forecast of Sri Lanka Bioinsecticides Market, 2032
- Historical Data and Forecast of Sri Lanka Bioinsecticides Revenues & Volume for the Period 2022-2032F
- Sri Lanka Bioinsecticides Market Trend Evolution
- Sri Lanka Bioinsecticides Market Drivers and Challenges
- Sri Lanka Bioinsecticides Price Trends
- Sri Lanka Bioinsecticides Porter's Five Forces
- Sri Lanka Bioinsecticides Industry Life Cycle
- Historical Data and Forecast of Sri Lanka Bioinsecticides Market Revenues & Volume By Organism Type for the Period 2022-2032F
- Historical Data and Forecast of Sri Lanka Bioinsecticides Market Revenues & Volume By Bacteria Thuringiensis for the Period 2022-2032F
- Historical Data and Forecast of Sri Lanka Bioinsecticides Market Revenues & Volume By Beauveria Bassiana for the Period 2022-2032F
- Historical Data and Forecast of Sri Lanka Bioinsecticides Market Revenues & Volume By Metarhizium Anisopliae for the Period 2022-2032F
- Historical Data and Forecast of Sri Lanka Bioinsecticides Market Revenues & Volume By Type for the Period 2022-2032F
- Historical Data and Forecast of Sri Lanka Bioinsecticides Market Revenues & Volume By Microbials for the Period 2022-2032F
- Historical Data and Forecast of Sri Lanka Bioinsecticides Market Revenues & Volume By Macrobials for the Period 2022-2032F
- Sri Lanka Bioinsecticides Import Export Trade Statistics
- Market Opportunity Assessment By Organism Type
- Market Opportunity Assessment By Type
- Sri Lanka Bioinsecticides Top Companies Market Share
- Sri Lanka Bioinsecticides Competitive Benchmarking By Technical and Operational Parameters
- Sri Lanka Bioinsecticides Company Profiles
- Sri Lanka Bioinsecticides Key Strategic Recommendations
Sri Lanka Bioinsecticides Market (2026-2032): FAQs
The increasing awareness about eco-friendly agricultural practices and the rising adoption of bioinsecticides by farmers, such as those offered by companies like Eco Solutions and Bioworks, are key factors contributing to the growth of the market in Sri Lanka.
The Sri Lanka bioinsecticides market comprises various players such as Ecochem, Sumitomo Chemical, and Bayer CropScience offering products like Bacillus thuringiensis-based insecticides and neem-based formulations to control pests in crops like rice, tea, and vegetables. This market focuses on providing environmentally friendly pest management solutions to farmers looking to reduce chemical pesticide usage.
The future outlook for the Sri Lanka bioinsecticides market is promising, with increasing awareness about the harmful effects of chemical pesticides on the environment and human health. Companies like Bayer Crop Science and Syngenta are investing in research and development of innovative bioinsecticide solutions. As Sri Lanka aims to promote sustainable agriculture practices, the demand for bioinsecticides is expected to rise, driving the market growth in the coming years.
Customers in the Sri Lanka bioinsecticides market show a growing preference for organic and environmentally-friendly pest control solutions. Companies like Ecochem Biopesticides and Agrochemicals are gaining traction due to their focus on sustainable farming practices that resonate with consumers seeking chemical-free alternatives. Additionally, there is an increasing demand for bioinsecticides that are effective against specific pests while being safe for beneficial insects, reflecting a shift towards integrated pest management strategies among farmers.
In Sri Lanka, the bioinsecticides market is primarily driven by the increasing demand for organic and sustainable farming practices. Companies like Lanka Bio Organics and Southern Bio Farms are capitalizing on this trend by offering a range of bioinsecticide products derived from natural sources like neem and bacillus thuringiensis. However, challenges such as limited awareness among farmers about the efficacy of bioinsecticides and the high initial costs associated with these products hinder market growth. Additionally, the dynamics of regulatory approvals and government support play a crucial role in shaping the adoption of bioinsecticides in Sri Lanka.
6Wresearch actively monitors the Sri Lanka Bioinsecticides Market and publishes its comprehensive annual report, highlighting emerging trends, growth drivers, revenue analysis, and forecast outlook. Our insights help businesses to make data-backed strategic decisions with ongoing market dynamics. Our analysts track relevent industries related to the Sri Lanka Bioinsecticides Market, allowing our clients with actionable intelligence and reliable forecasts tailored to emerging regional needs.
Yes, we provide customisation as per your requirements. To learn more, feel free to contact us on sales@6wresearch.com
1 Executive Summary |
2 Introduction |
2.1 Key Highlights of the Report |
2.2 Report Description |
2.3 Market Scope & Segmentation |
2.4 Research Methodology |
2.5 Assumptions |
3 Sri Lanka Bioinsecticides Market Overview |
3.1 Sri Lanka Country Macro Economic Indicators |
3.2 Sri Lanka Bioinsecticides Market Revenues & Volume, 2022 & 2032F |
3.3 Sri Lanka Bioinsecticides Market - Industry Life Cycle |
3.4 Sri Lanka Bioinsecticides Market - Porter's Five Forces |
3.5 Sri Lanka Bioinsecticides Market Revenues & Volume Share, By Organism Type, 2022 & 2032F |
3.6 Sri Lanka Bioinsecticides Market Revenues & Volume Share, By Type, 2022 & 2032F |
4 Sri Lanka Bioinsecticides Market Dynamics |
4.1 Impact Analysis |
4.2 Market Drivers |
4.2.1 Increasing awareness about the harmful effects of chemical insecticides on the environment and human health |
4.2.2 Government initiatives promoting the use of eco-friendly agricultural practices |
4.2.3 Growing demand for organic food products in Sri Lanka |
4.3 Market Restraints |
4.3.1 Limited availability of advanced bioinsecticide technologies in the market |
4.3.2 High initial investment costs associated with setting up bioinsecticide production facilities |
4.3.3 Lack of awareness among farmers about the efficacy and benefits of bioinsecticides |
5 Sri Lanka Bioinsecticides Market Trends |
6 Sri Lanka Bioinsecticides Market, By Types |
6.1 Sri Lanka Bioinsecticides Market, By Organism Type |
6.1.1 Overview and Analysis |
6.1.2 Sri Lanka Bioinsecticides Market Revenues & Volume, By Organism Type, 2022-2032F |
6.1.3 Sri Lanka Bioinsecticides Market Revenues & Volume, By Bacteria Thuringiensis, 2022-2032F |
6.1.4 Sri Lanka Bioinsecticides Market Revenues & Volume, By Beauveria Bassiana, 2022-2032F |
6.1.5 Sri Lanka Bioinsecticides Market Revenues & Volume, By Metarhizium Anisopliae, 2022-2032F |
6.2 Sri Lanka Bioinsecticides Market, By Type |
6.2.1 Overview and Analysis |
6.2.2 Sri Lanka Bioinsecticides Market Revenues & Volume, By Microbials , 2022-2032F |
6.2.3 Sri Lanka Bioinsecticides Market Revenues & Volume, By Macrobials, 2022-2032F |
7 Sri Lanka Bioinsecticides Market Import-Export Trade Statistics |
7.1 Sri Lanka Bioinsecticides Market Export to Major Countries |
7.2 Sri Lanka Bioinsecticides Market Imports from Major Countries |
8 Sri Lanka Bioinsecticides Market Key Performance Indicators |
8.1 Adoption rate of bioinsecticides by farmers in Sri Lanka |
8.2 Number of research and development initiatives focused on bioinsecticide technology |
8.3 Percentage of agricultural land in Sri Lanka using bioinsecticides |
8.4 Rate of growth in the market for bioinsecticide products |
8.5 Number of partnerships between bioinsecticide manufacturers and agricultural organizations in Sri Lanka |
9 Sri Lanka Bioinsecticides Market - Opportunity Assessment |
9.1 Sri Lanka Bioinsecticides Market Opportunity Assessment, By Organism Type, 2022 & 2032F |
9.2 Sri Lanka Bioinsecticides Market Opportunity Assessment, By Type, 2022 & 2032F |
10 Sri Lanka Bioinsecticides Market - Competitive Landscape |
10.1 Sri Lanka Bioinsecticides Market Revenue Share, By Companies, 2025 |
10.2 Sri Lanka Bioinsecticides Market Competitive Benchmarking, By Operating and Technical Parameters |
11 Company Profiles |
12 Recommendations |
13 Disclaimer |
Global Go To Market Strategy - 2030
Export potential enables firms to identify high-growth global markets with greater confidence by combining advanced trade intelligence with a structured quantitative methodology. The framework analyzes emerging demand trends and country-level import patterns while integrating macroeconomic and trade datasets such as GDP and population forecasts, bilateral import–export flows, tariff structures, elasticity differentials between developed and developing economies, geographic distance, and import demand projections. Using weighted trade values from 2020–2024 as the base period to project country-to-country export potential for 2030, these inputs are operationalized through calculated drivers such as gravity model parameters, tariff impact factors, and projected GDP per-capita growth. Through an analysis of hidden potentials, demand hotspots, and market conditions that are most favorable to success, this method enables firms to focus on target countries, maximize returns, and global expansion with data, backed by accuracy.
By factoring in the projected importer demand gap that is currently unmet and could be potential opportunity, it identifies the potential for the Exporter (Country) among 190 countries, against the general trade analysis, which identifies the biggest importer or exporter.
To discover high-growth global markets and optimize your business strategy:
Click Here
Pricing
- Single User License$ 1,995
- Department License$ 2,400
- Site License$ 3,120
- Global License$ 3,795

Leadership Perspectives from Industry Events
Search
Thought Leadership and Analyst Meet


Our Clients
6WResearch In News
- India Export Attractiveness Tracker 2026
- India Air Conditioner Market Set for Strong Rebound in 2026 After Weather-Led Correction and GST-Driven Recovery: 6Wresearch
- ADAS in India: How Automatic Emergency Braking, Blind Spot Detection & Driver Monitoring are Transforming Road Safety
- Doha a strategic location for EV manufacturing hub: IPA Qatar
- Demand for luxury TVs surging in the GCC, says Samsung
- Empowering Growth: The Thriving Journey of Bangladesh’s Cable Industry
Latest Reports
- Nicaragua RPG Gaming Market (2026-2032)
- New Zealand RPG Gaming Market (2026-2032)
- Netherlands RPG Gaming Market (2026-2032)
- Nauru RPG Gaming Market (2026-2032)
- Namibia RPG Gaming Market (2026-2032)
- Mozambique RPG Gaming Market (2026-2032)
- Montenegro RPG Gaming Market (2026-2032)
- Mongolia RPG Gaming Market (2026-2032)
- Monaco RPG Gaming Market (2026-2032)
- Micronesia RPG Gaming Market (2026-2032)
Industry Events and Analyst Meet

EV India Expo 2026

HIMTEX 2026

India Refining Summit 2026

India EV Show 2026

EV tech India Expo 2026
Whitepaper
- Middle East & Africa Commercial Security Market Click here to view more.
- Middle East & Africa Fire Safety Systems & Equipment Market Click here to view more.
- GCC Drone Market Click here to view more.
- Middle East Lighting Fixture Market Click here to view more.
- GCC Physical & Perimeter Security Market Click here to view more.