Sri Lanka Glass Reinforced Plastic Market (2026-2032) Outlook | Analysis, Size, Trends, Share, Companies, Industry, Growth, Value, Forecast & Revenue
Market Forecast By Type (Epoxy, Polyester, Vinyl Ester, Polyurethane, Others), By Method (Moulding Method, Pultrusion Method, Layup, Others), By Application (Pipes and Tanks, Wind Power Turbines, Storage Containers, Roofs, Floor Gratings, Steps and Stairs, Switch Actuators, Others), By End-Use (Building and Construction, Transportation, Electrical and Electronics, Oil and Gas, Mining, Water and Wastewater, Others) And Competitive Landscape
| Product Code: ETC264091 | Publication Date: Aug 2022 | Updated Date: Jul 2026 | Product Type: Market Research Report | |
| Publisher: 6Wresearch | Author: Vasudha | No. of Pages: 75 | No. of Figures: 35 | No. of Tables: 20 |
Sri Lanka Glass Reinforced Plastic Market Size, Share & Growth Rate
The Sri Lanka Glass Reinforced Plastic Market was estimated at USD 348 Million in 2025 and is projected to reach USD 456 Million by 2032, growing at a CAGR of 3.9% from 2026 to 2032. This upward trajectory is primarily fueled by a surge in construction activities, where GRP is gaining traction for its resilience and adaptability. Additionally, the automotive and marine sectors are increasingly adopting GRP components, driven by a need for lightweight yet durable materials that enhance performance and efficiency.
Sri Lanka Glass Reinforced Plastic Market Year-wise Growth Rate and Key Drivers
This graph highlights how the Sri Lanka Glass Reinforced Plastic Market has steadily grown over the years, supported by major growth factors.
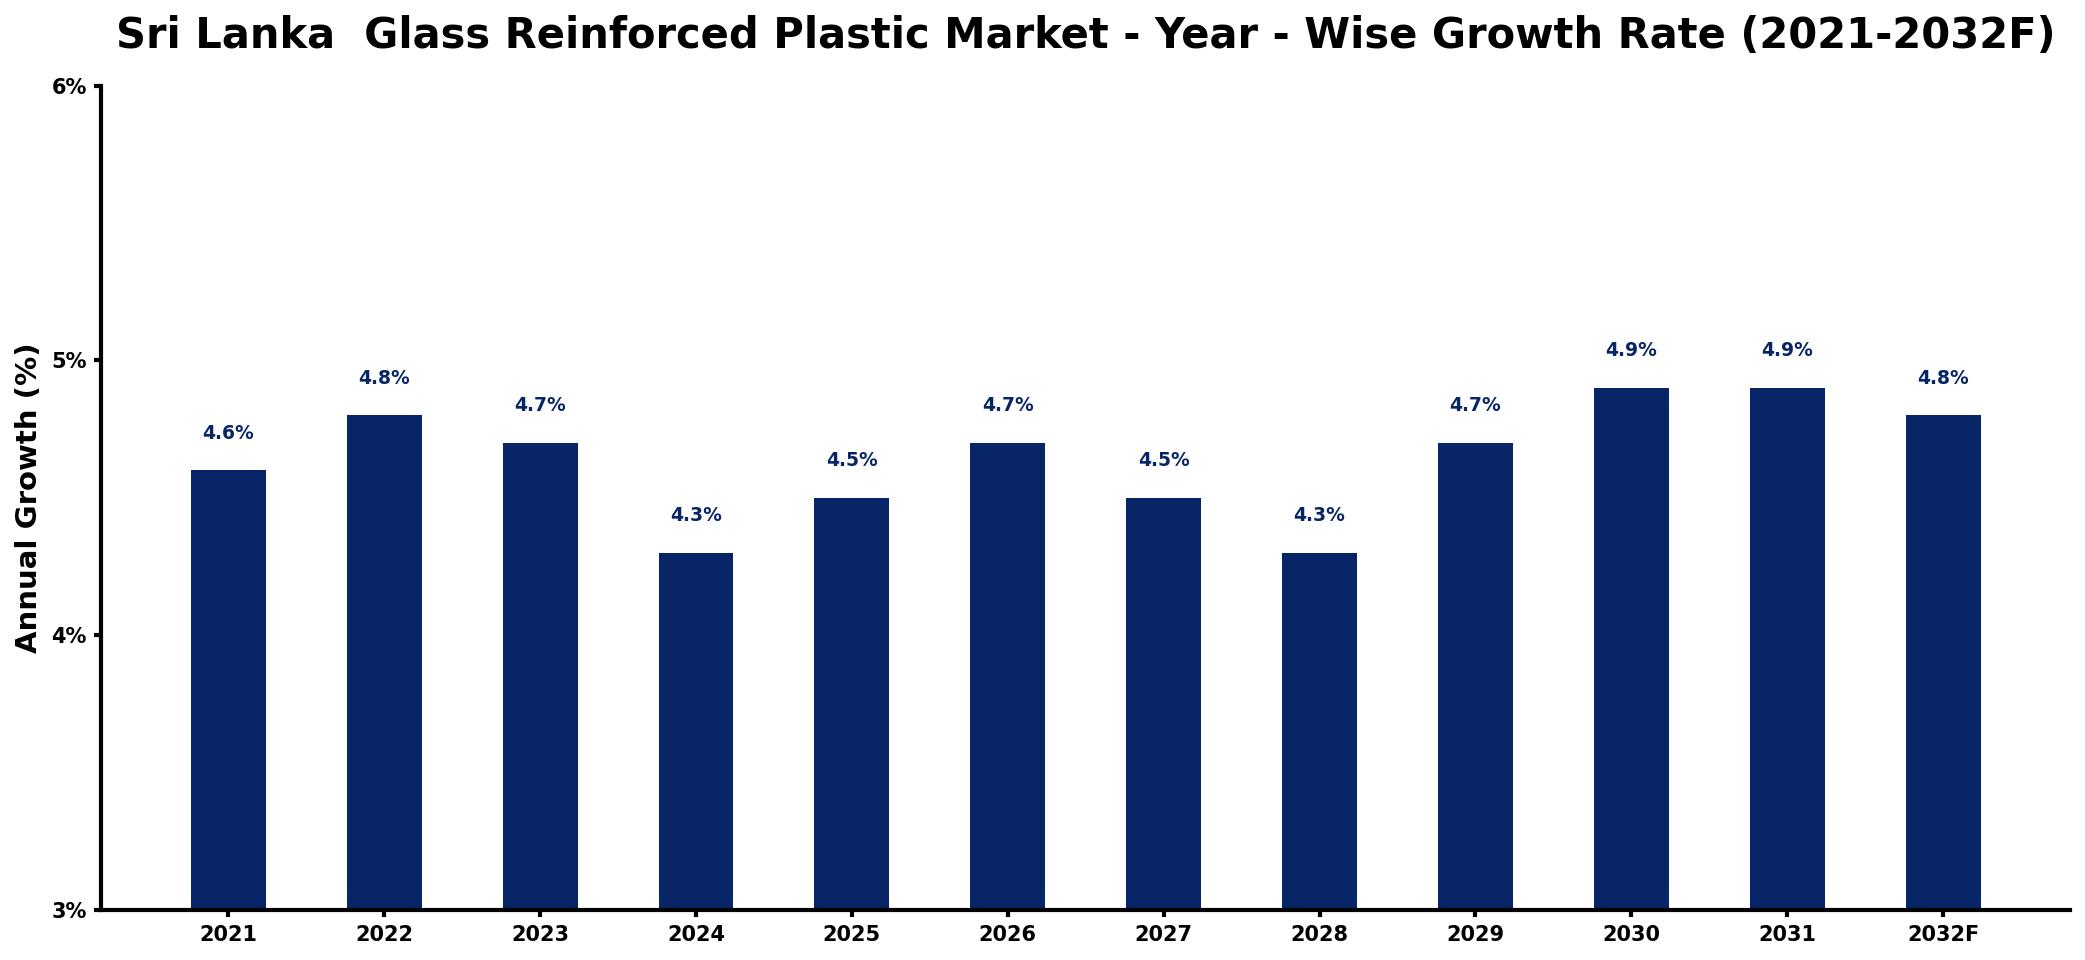
The table below presents the year‑wise growth rates along with the key drivers influencing the market
| Year | Growth Rate | Major Drivers |
| 2021 | 4.6% | Rising construction sector investments |
| 2022 | 4.8% | Increased demand from automotive industry |
| 2023 | 4.7% | Growth in renewable energy projects |
| 2024 | 4.3% | Expansion of marine applications sector |
| 2025 | 4.5% | Surge in infrastructure development projects |
| 2026 | 4.7% | Emergence of new manufacturing facilities |
| 2027 | 4.5% | Growing consumer awareness and preference |
| 2028 | 4.3% | Increased exports to regional markets |
| 2029 | 4.7% | Technological advancements in production |
| 2030 | 4.9% | Investment in sustainable materials research |
| 2031 | 4.9% | Rising popularity of recreational vehicles |
| 2032 | 4.8% | Strengthening of local supply chains |
Note: Market size estimations and growth projections presented in this report are based on 6Wresearch's proprietary forecasting methodology, utilizing the latest available industry data, government publications, and primary research inputs.
Sri Lanka Glass Reinforced Plastic Market Synopsis
Recently, the Glass Reinforced Plastic market in Sri Lanka has seen consistent growth, largely driven by advancements in manufacturing techniques and rising awareness about the advantages of GRP. As the market continues to mature, it is poised for a significant expansion, fueled by increasing investments in infrastructure and sustainability initiatives.
As Sri Lanka navigates its path towards economic development, the demand for GRP products is expected to further intensify, supported by government policies promoting local production and quality standards. The outlook suggests that industries such as construction and automotive will remain crucial to market dynamics, presenting ample opportunities for stakeholders.
Sri Lanka Glass Reinforced Plastic Market Key Takeaways
- The GRP market in Sri Lanka is primarily driven by its applications in construction, automotive, aerospace, and marine industries.
- There is a growing recognition of the sustainability of GRP materials, contributing to increased adoption across various sectors.
- Investments in local manufacturing and distribution networks will be vital for meeting rising market demands.
- The government is actively supporting the sector through favorable policies and initiatives aimed at quality improvement.
- The market is experiencing innovation in product development to enhance performance and efficiency in various applications.
Evaluation of Restraints in Sri Lanka Glass Reinforced Plastic Market
Despite the promising growth, the Sri Lanka Glass Reinforced Plastic market faces several restraints that could impede its potential. A primary concern is the limited awareness and understanding among consumers and businesses regarding the benefits of GRP products, which affects adoption rates. Moreover, inconsistent quality standards often raise questions about durability and performance, leading to hesitancy among potential users. High production costs stemming from reliance on imported raw materials also pose a challenge, along with the shortage of skilled labor proficient in GRP manufacturing techniques. Addressing these issues will be critical for unlocking the markets full potential.
Sri Lanka Glass Reinforced Plastic Market Trends
Current trends in the Sri Lankan Glass Reinforced Plastic market indicate a significant shift towards sustainable materials and practices. As environmental concerns gain traction, industries are increasingly seeking GRP for its recyclable properties and longevity. Technological advancements are also shaping demand, with innovations in GRP manufacturing processes that enhance quality and reduce costs. Additionally, the construction sector is leaning towards design flexibility and cost-effectiveness offered by GRP products, fueling their adoption in various projects.
Sri Lanka Glass Reinforced Plastic Market Opportunities
There exist considerable investment opportunities within the Sri Lanka Glass Reinforced Plastic market, particularly in light of the growing demand for lightweight, durable materials across construction, automotive, and marine sectors. The expansion of infrastructure projects presents a ripe environment for GRP applications, including tanks, pipes, and panels. Furthermore, as the government promotes sustainable practices, there is an opportunity for investors to tap into the green technology segment of the GRP market, thereby enhancing profitability while contributing to environmental sustainability.
Government Initiatives in the Sri Lanka Glass Reinforced Plastic Market
The Sri Lankan government has initiated various policies aimed at nurturing the Glass Reinforced Plastic market. These include financial incentives and tax benefits to stimulate investment in GRP manufacturing. The establishment of quality standards is also a priority, ensuring that GRP products meet safety and durability requirements. Additionally, the government promotes sustainable practices within the sector to reduce environmental impact and supports research and development efforts, aiming to bolster innovation and competitiveness in the GRP industry.
Future Insights of the Sri Lanka Glass Reinforced Plastic Market
Looking ahead to 2026-2032, the Sri Lanka Glass Reinforced Plastic market is on a promising growth trajectory. Key drivers will include the sustained demand from construction projects and advancements in GRP technology that improve product performance. Furthermore, increasing government investments in infrastructure and a growing focus on sustainable materials are expected to propel market expansion. While challenges such as fluctuating raw material prices persist, the overall outlook remains positive, with steady growth anticipated over the coming years.
Sri Lanka Glass Reinforced Plastic Market Latest Developments (2025 - 2026)
Recent developments in the Sri Lanka Glass Reinforced Plastic market reflect a focus on innovation and quality improvement. Industry players are increasingly investing in advanced manufacturing technologies to enhance production efficiency and product performance. Additionally, there have been collaborative efforts between government entities and private manufacturers to establish quality standards that ensure the safety and reliability of GRP products. As the market evolves, a commitment to sustainability and environmental responsibility continues to shape industry practices.
Sri Lanka Glass Reinforced Plastic Market - Key Attractiveness of the Report
- 10 Years of Market Numbers
- Historical Data Starting from 2022 to 2025
- Base Year: 2025
- Forecast Data until 2032
- Key Performance Indicators Impacting the Market
- Major Upcoming Developments and Projects
Key Highlights of the Report:
- Sri Lanka Glass Reinforced Plastic Market Outlook
- Market Size of Sri Lanka Glass Reinforced Plastic Market, 2025
- Forecast of Sri Lanka Glass Reinforced Plastic Market, 2032
- Historical Data and Forecast of Sri Lanka Glass Reinforced Plastic Revenues & Volume for the Period 2022-2032F
- Sri Lanka Glass Reinforced Plastic Market Trend Evolution
- Sri Lanka Glass Reinforced Plastic Market Drivers and Challenges
- Sri Lanka Glass Reinforced Plastic Price Trends
- Sri Lanka Glass Reinforced Plastic Porter's Five Forces
- Sri Lanka Glass Reinforced Plastic Industry Life Cycle
- Historical Data and Forecast of Sri Lanka Glass Reinforced Plastic Market Revenues & Volume By Type for the Period 2022-2032F
- Historical Data and Forecast of Sri Lanka Glass Reinforced Plastic Market Revenues & Volume By Epoxy for the Period 2022-2032F
- Historical Data and Forecast of Sri Lanka Glass Reinforced Plastic Market Revenues & Volume By Polyester for the Period 2022-2032F
- Historical Data and Forecast of Sri Lanka Glass Reinforced Plastic Market Revenues & Volume By Vinyl Ester for the Period 2022-2032F
- Historical Data and Forecast of Sri Lanka Glass Reinforced Plastic Market Revenues & Volume By Polyurethane for the Period 2022-2032F
- Historical Data and Forecast of Sri Lanka Glass Reinforced Plastic Market Revenues & Volume By Others for the Period 2022-2032F
- Historical Data and Forecast of Sri Lanka Glass Reinforced Plastic Market Revenues & Volume By Method for the Period 2022-2032F
- Historical Data and Forecast of Sri Lanka Glass Reinforced Plastic Market Revenues & Volume By Moulding Method for the Period 2022-2032F
- Historical Data and Forecast of Sri Lanka Glass Reinforced Plastic Market Revenues & Volume By Pultrusion Method for the Period 2022-2032F
- Historical Data and Forecast of Sri Lanka Glass Reinforced Plastic Market Revenues & Volume By Layup for the Period 2022-2032F
- Historical Data and Forecast of Sri Lanka Glass Reinforced Plastic Market Revenues & Volume By Others for the Period 2022-2032F
- Historical Data and Forecast of Sri Lanka Glass Reinforced Plastic Market Revenues & Volume By Application for the Period 2022-2032F
- Historical Data and Forecast of Sri Lanka Glass Reinforced Plastic Market Revenues & Volume By Pipes and Tanks for the Period 2022-2032F
- Historical Data and Forecast of Sri Lanka Glass Reinforced Plastic Market Revenues & Volume By Wind Power Turbines for the Period 2022-2032F
- Historical Data and Forecast of Sri Lanka Glass Reinforced Plastic Market Revenues & Volume By Storage Containers for the Period 2022-2032F
- Historical Data and Forecast of Sri Lanka Glass Reinforced Plastic Market Revenues & Volume By Roofs for the Period 2022-2032F
- Historical Data and Forecast of Sri Lanka Glass Reinforced Plastic Market Revenues & Volume By Floor Gratings for the Period 2022-2032F
- Historical Data and Forecast of Sri Lanka Glass Reinforced Plastic Market Revenues & Volume By Steps and Stairs for the Period 2022-2032F
- Historical Data and Forecast of Sri Lanka Glass Reinforced Plastic Market Revenues & Volume By Switch Actuators for the Period 2022-2032F
- Historical Data and Forecast of Sri Lanka Glass Reinforced Plastic Market Revenues & Volume By Others for the Period 2022-2032F
- Historical Data and Forecast of Sri Lanka Glass Reinforced Plastic Market Revenues & Volume By End-Use for the Period 2022-2032F
- Historical Data and Forecast of Sri Lanka Glass Reinforced Plastic Market Revenues & Volume By Building and Construction for the Period 2022-2032F
- Historical Data and Forecast of Sri Lanka Glass Reinforced Plastic Market Revenues & Volume By Transportation for the Period 2022-2032F
- Historical Data and Forecast of Sri Lanka Glass Reinforced Plastic Market Revenues & Volume By Electrical and Electronics for the Period 2022-2032F
- Historical Data and Forecast of Sri Lanka Glass Reinforced Plastic Market Revenues & Volume By Oil and Gas for the Period 2022-2032F
- Historical Data and Forecast of Sri Lanka Glass Reinforced Plastic Market Revenues & Volume By Mining for the Period 2022-2032F
- Historical Data and Forecast of Sri Lanka Glass Reinforced Plastic Market Revenues & Volume By Water and Wastewater for the Period 2022-2032F
- Historical Data and Forecast of Sri Lanka Glass Reinforced Plastic Market Revenues & Volume By Others for the Period 2022-2032F
- Sri Lanka Glass Reinforced Plastic Import Export Trade Statistics
- Market Opportunity Assessment By Type
- Market Opportunity Assessment By Method
- Market Opportunity Assessment By Application
- Market Opportunity Assessment By End-Use
- Sri Lanka Glass Reinforced Plastic Top Companies Market Share
- Sri Lanka Glass Reinforced Plastic Competitive Benchmarking By Technical and Operational Parameters
- Sri Lanka Glass Reinforced Plastic Company Profiles
- Sri Lanka Glass Reinforced Plastic Key Strategic Recommendations
Frequently Asked Questions About the Market Study (FAQs):
Key drivers include increasing demand from the construction sector for durable and corrosion-resistant materials, as well as the automotive industry's need for lightweight components.
The Sri Lanka Glass Reinforced Plastic Market was estimated at USD 348 Million in 2025 and is projected to reach USD 456 Million by 2032, growing at a CAGR of 3.9% from 2026 to 2032.
The market is challenged by limited consumer awareness of GRP benefits, inconsistent product quality, high production costs, and a shortage of skilled labor.
The construction, automotive, aerospace, and marine sectors are major contributors, each utilizing GRP for its unique properties and applications.
Opportunities include investing in local GRP manufacturing facilities and developing distribution networks to meet the rising demand across multiple sectors.
The government promotes the GRP market through financial incentives, the establishment of quality standards, and initiatives focused on sustainable practices and research development.
6Wresearch actively monitors the Sri Lanka Glass Reinforced Plastic Market and publishes its comprehensive annual report, highlighting emerging trends, growth drivers, revenue analysis, and forecast outlook. Our insights help businesses to make data-backed strategic decisions with ongoing market dynamics. Our analysts track relevent industries related to the Sri Lanka Glass Reinforced Plastic Market, allowing our clients with actionable intelligence and reliable forecasts tailored to emerging regional needs.
Yes, we provide customisation as per your requirements. To learn more, feel free to contact us on sales@6wresearch.com
1 Executive Summary |
2 Introduction |
2.1 Key Highlights of the Report |
2.2 Report Description |
2.3 Market Scope & Segmentation |
2.4 Research Methodology |
2.5 Assumptions |
3 Sri Lanka Glass Reinforced Plastic Market Overview |
3.1 Sri Lanka Country Macro Economic Indicators |
3.2 Sri Lanka Glass Reinforced Plastic Market Revenues & Volume, 2022 & 2032F |
3.3 Sri Lanka Glass Reinforced Plastic Market - Industry Life Cycle |
3.4 Sri Lanka Glass Reinforced Plastic Market - Porter's Five Forces |
3.5 Sri Lanka Glass Reinforced Plastic Market Revenues & Volume Share, By Type, 2022 & 2032F |
3.6 Sri Lanka Glass Reinforced Plastic Market Revenues & Volume Share, By Method, 2022 & 2032F |
3.7 Sri Lanka Glass Reinforced Plastic Market Revenues & Volume Share, By Application, 2022 & 2032F |
3.8 Sri Lanka Glass Reinforced Plastic Market Revenues & Volume Share, By End-Use, 2022 & 2032F |
4 Sri Lanka Glass Reinforced Plastic Market Dynamics |
4.1 Impact Analysis |
4.2 Market Drivers |
4.2.1 Increasing demand for lightweight and corrosion-resistant materials in various industries |
4.2.2 Growing infrastructure development projects in Sri Lanka |
4.2.3 Rising focus on sustainable and environmentally friendly solutions |
4.3 Market Restraints |
4.3.1 Fluctuating raw material prices impacting production costs |
4.3.2 Lack of awareness and understanding about the benefits of glass reinforced plastic |
4.3.3 Limited availability of skilled labor for manufacturing and installation |
5 Sri Lanka Glass Reinforced Plastic Market Trends |
6 Sri Lanka Glass Reinforced Plastic Market, By Types |
6.1 Sri Lanka Glass Reinforced Plastic Market, By Type |
6.1.1 Overview and Analysis |
6.1.2 Sri Lanka Glass Reinforced Plastic Market Revenues & Volume, By Type, 2022-2032F |
6.1.3 Sri Lanka Glass Reinforced Plastic Market Revenues & Volume, By Epoxy, 2022-2032F |
6.1.4 Sri Lanka Glass Reinforced Plastic Market Revenues & Volume, By Polyester, 2022-2032F |
6.1.5 Sri Lanka Glass Reinforced Plastic Market Revenues & Volume, By Vinyl Ester, 2022-2032F |
6.1.6 Sri Lanka Glass Reinforced Plastic Market Revenues & Volume, By Polyurethane, 2022-2032F |
6.1.7 Sri Lanka Glass Reinforced Plastic Market Revenues & Volume, By Others, 2022-2032F |
6.2 Sri Lanka Glass Reinforced Plastic Market, By Method |
6.2.1 Overview and Analysis |
6.2.2 Sri Lanka Glass Reinforced Plastic Market Revenues & Volume, By Moulding Method, 2022-2032F |
6.2.3 Sri Lanka Glass Reinforced Plastic Market Revenues & Volume, By Pultrusion Method, 2022-2032F |
6.2.4 Sri Lanka Glass Reinforced Plastic Market Revenues & Volume, By Layup, 2022-2032F |
6.2.5 Sri Lanka Glass Reinforced Plastic Market Revenues & Volume, By Others, 2022-2032F |
6.3 Sri Lanka Glass Reinforced Plastic Market, By Application |
6.3.1 Overview and Analysis |
6.3.2 Sri Lanka Glass Reinforced Plastic Market Revenues & Volume, By Pipes and Tanks, 2022-2032F |
6.3.3 Sri Lanka Glass Reinforced Plastic Market Revenues & Volume, By Wind Power Turbines, 2022-2032F |
6.3.4 Sri Lanka Glass Reinforced Plastic Market Revenues & Volume, By Storage Containers, 2022-2032F |
6.3.5 Sri Lanka Glass Reinforced Plastic Market Revenues & Volume, By Roofs, 2022-2032F |
6.3.6 Sri Lanka Glass Reinforced Plastic Market Revenues & Volume, By Floor Gratings, 2022-2032F |
6.3.7 Sri Lanka Glass Reinforced Plastic Market Revenues & Volume, By Steps and Stairs, 2022-2032F |
6.3.8 Sri Lanka Glass Reinforced Plastic Market Revenues & Volume, By Others, 2022-2032F |
6.3.9 Sri Lanka Glass Reinforced Plastic Market Revenues & Volume, By Others, 2022-2032F |
6.4 Sri Lanka Glass Reinforced Plastic Market, By End-Use |
6.4.1 Overview and Analysis |
6.4.2 Sri Lanka Glass Reinforced Plastic Market Revenues & Volume, By Building and Construction, 2022-2032F |
6.4.3 Sri Lanka Glass Reinforced Plastic Market Revenues & Volume, By Transportation, 2022-2032F |
6.4.4 Sri Lanka Glass Reinforced Plastic Market Revenues & Volume, By Electrical and Electronics, 2022-2032F |
6.4.5 Sri Lanka Glass Reinforced Plastic Market Revenues & Volume, By Oil and Gas, 2022-2032F |
6.4.6 Sri Lanka Glass Reinforced Plastic Market Revenues & Volume, By Mining, 2022-2032F |
6.4.7 Sri Lanka Glass Reinforced Plastic Market Revenues & Volume, By Water and Wastewater, 2022-2032F |
7 Sri Lanka Glass Reinforced Plastic Market Import-Export Trade Statistics |
7.1 Sri Lanka Glass Reinforced Plastic Market Export to Major Countries |
7.2 Sri Lanka Glass Reinforced Plastic Market Imports from Major Countries |
8 Sri Lanka Glass Reinforced Plastic Market Key Performance Indicators |
8.1 Percentage increase in the adoption of glass reinforced plastic in key industries |
8.2 Number of infrastructure projects utilizing glass reinforced plastic materials |
8.3 Rate of growth in investments in research and development for glass reinforced plastic technologies |
9 Sri Lanka Glass Reinforced Plastic Market - Opportunity Assessment |
9.1 Sri Lanka Glass Reinforced Plastic Market Opportunity Assessment, By Type, 2022 & 2032F |
9.2 Sri Lanka Glass Reinforced Plastic Market Opportunity Assessment, By Method, 2022 & 2032F |
9.3 Sri Lanka Glass Reinforced Plastic Market Opportunity Assessment, By Application, 2022 & 2032F |
9.4 Sri Lanka Glass Reinforced Plastic Market Opportunity Assessment, By End-Use, 2022 & 2032F |
10 Sri Lanka Glass Reinforced Plastic Market - Competitive Landscape |
10.1 Sri Lanka Glass Reinforced Plastic Market Revenue Share, By Companies, 2025 |
10.2 Sri Lanka Glass Reinforced Plastic Market Competitive Benchmarking, By Operating and Technical Parameters |
11 Company Profiles |
12 Recommendations |
13 Disclaimer |
Global Go To Market Strategy - 2030
Export potential enables firms to identify high-growth global markets with greater confidence by combining advanced trade intelligence with a structured quantitative methodology. The framework analyzes emerging demand trends and country-level import patterns while integrating macroeconomic and trade datasets such as GDP and population forecasts, bilateral import–export flows, tariff structures, elasticity differentials between developed and developing economies, geographic distance, and import demand projections. Using weighted trade values from 2020–2024 as the base period to project country-to-country export potential for 2030, these inputs are operationalized through calculated drivers such as gravity model parameters, tariff impact factors, and projected GDP per-capita growth. Through an analysis of hidden potentials, demand hotspots, and market conditions that are most favorable to success, this method enables firms to focus on target countries, maximize returns, and global expansion with data, backed by accuracy.
By factoring in the projected importer demand gap that is currently unmet and could be potential opportunity, it identifies the potential for the Exporter (Country) among 190 countries, against the general trade analysis, which identifies the biggest importer or exporter.
To discover high-growth global markets and optimize your business strategy:
Click Here
Pricing
- Single User License$ 1,995
- Department License$ 2,400
- Site License$ 3,120
- Global License$ 3,795

Leadership Perspectives from Industry Events
Search
Thought Leadership and Analyst Meet


Our Clients
6WResearch In News
- India Air Conditioner Market Set for Strong Rebound in 2026 After Weather-Led Correction and GST-Driven Recovery: 6Wresearch
- ADAS in India: How Automatic Emergency Braking, Blind Spot Detection & Driver Monitoring are Transforming Road Safety
- Doha a strategic location for EV manufacturing hub: IPA Qatar
- Demand for luxury TVs surging in the GCC, says Samsung
- Empowering Growth: The Thriving Journey of Bangladesh’s Cable Industry
- Demand for luxury TVs surging in the GCC, says Samsung
Latest Reports
- Nicaragua RPG Gaming Market (2026-2032)
- New Zealand RPG Gaming Market (2026-2032)
- Netherlands RPG Gaming Market (2026-2032)
- Nauru RPG Gaming Market (2026-2032)
- Namibia RPG Gaming Market (2026-2032)
- Mozambique RPG Gaming Market (2026-2032)
- Montenegro RPG Gaming Market (2026-2032)
- Mongolia RPG Gaming Market (2026-2032)
- Monaco RPG Gaming Market (2026-2032)
- Micronesia RPG Gaming Market (2026-2032)
Industry Events and Analyst Meet

EV India Expo 2026

HIMTEX 2026

India Refining Summit 2026

India EV Show 2026

EV tech India Expo 2026
Whitepaper
- Middle East & Africa Commercial Security Market Click here to view more.
- Middle East & Africa Fire Safety Systems & Equipment Market Click here to view more.
- GCC Drone Market Click here to view more.
- Middle East Lighting Fixture Market Click here to view more.
- GCC Physical & Perimeter Security Market Click here to view more.