Sri Lanka Pantothenic Acid Market (2026-2032) Outlook | Companies, Industry, Value, Analysis, Size, Forecast, Growth, Trends, Share & Revenue
Market Forecast By Form (Powder, Tablets), By End Use (Pharmaceuticals, Nutritional &dietary Supplements, Animal Health & Nutrition, Infant Food & Supplements, Food & Beverages), By Source (Plants, Animals, Dairy Products), By Nature (Organic And , Inorganic) And Competitive Landscape
| Product Code: ETC337111 | Publication Date: Aug 2022 | Updated Date: Jul 2026 | Product Type: Market Research Report | |
| Publisher: 6Wresearch | Author: Vasudha | No. of Pages: 75 | No. of Figures: 35 | No. of Tables: 20 |
Sri Lanka Pantothenic Acid Market Size, Share & Growth Rate
The Sri Lanka Pantothenic Acid Market was estimated at USD 373 Million in 2025 and is projected to reach USD 523 Million by 2032, growing at a CAGR of 4.9% from 2026 to 2032. This growth is primarily fueled by the increasing consumer focus on health and wellness, leading to a surge in demand for dietary supplements and fortified food products. Additionally, the pharmaceutical and cosmetics sectors are leveraging the vitamin's properties, enhancing its relevance across multiple industries in Sri Lanka.
Sri Lanka Pantothenic Acid Market Year-wise Growth Rate and Key Drivers
This graph highlights how the Sri Lanka Pantothenic Acid Market has steadily grown over the years, supported by major growth factors.
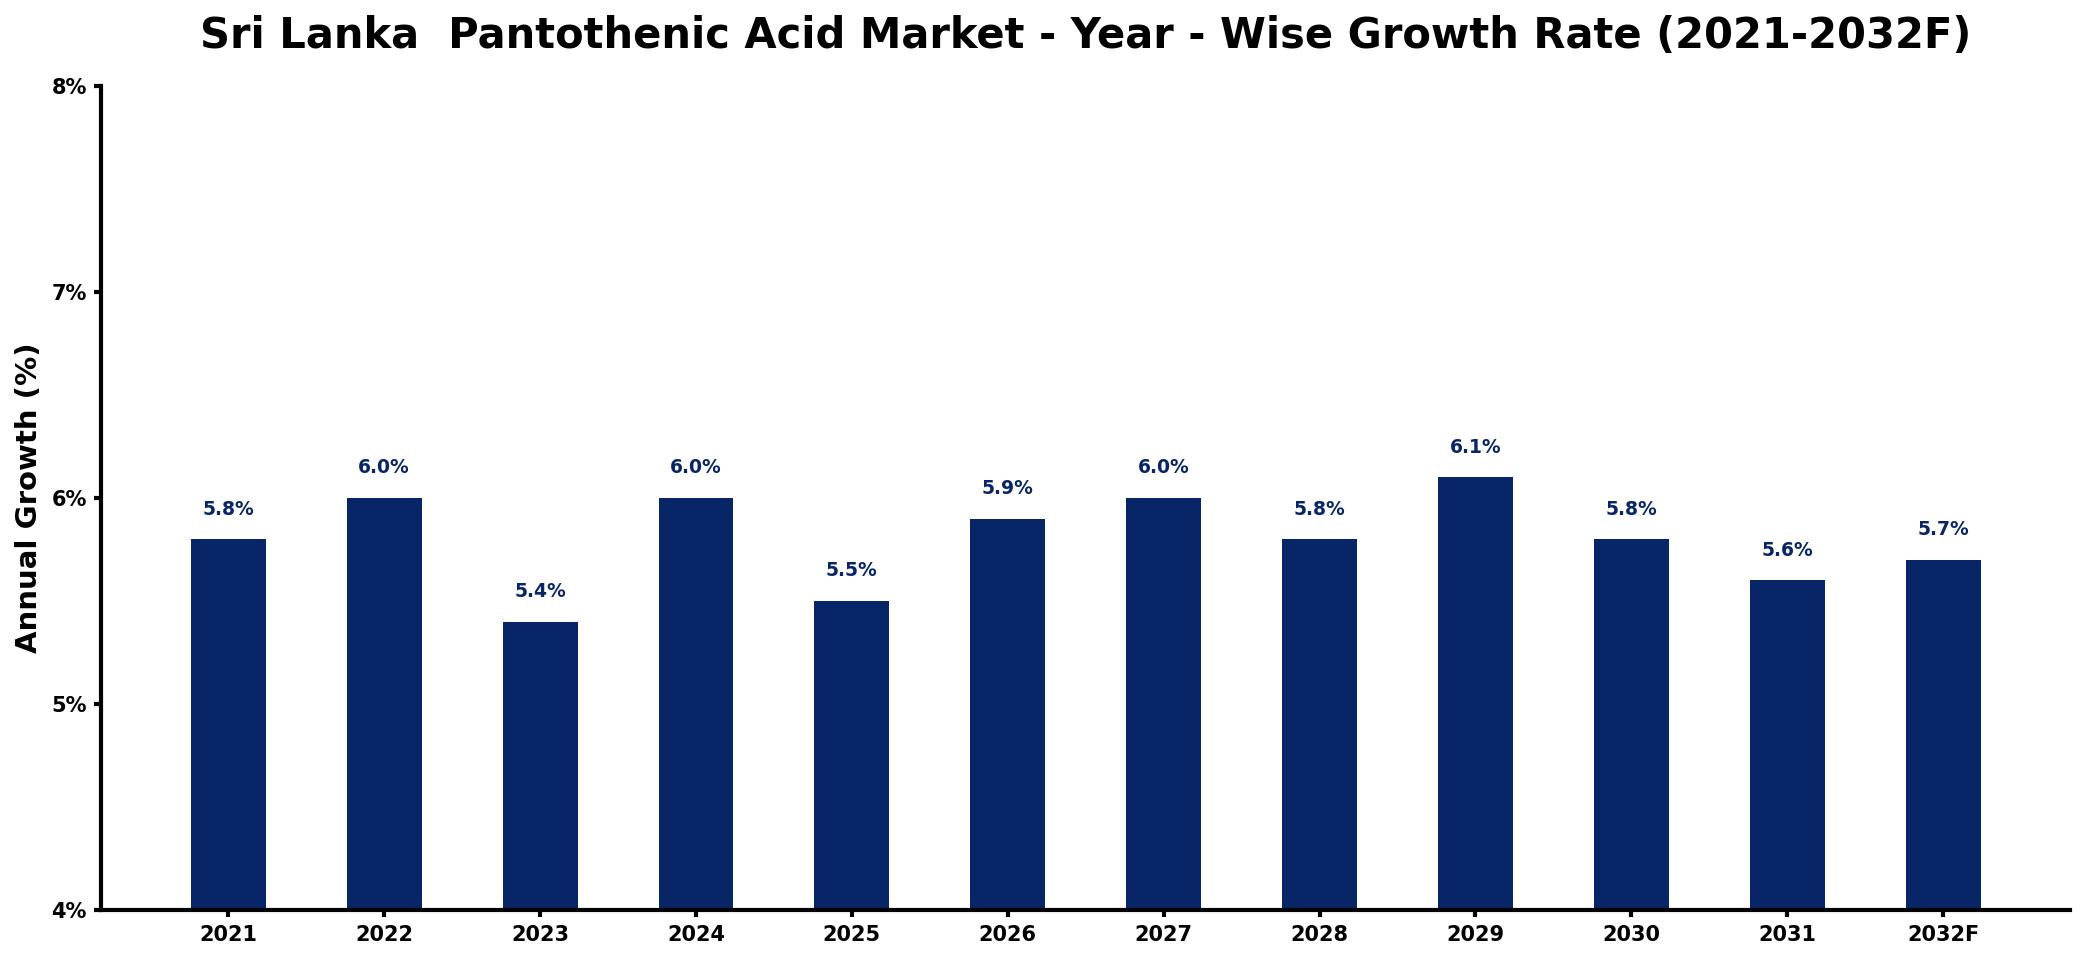
The table below presents the year‑wise growth rates along with the key drivers influencing the market
| Year | Growth Rate | Major Drivers |
| 2021 | 5.8% | Rising health consciousness among consumers |
| 2022 | 6.0% | Increased investment in dietary supplements |
| 2023 | 5.4% | Growing prevalence of nutritional deficiencies |
| 2024 | 6.0% | Expansion of health food stores |
| 2025 | 5.5% | Rising demand for functional foods |
| 2026 | 5.9% | Growth in online retail channels |
| 2027 | 6.0% | Increased consumer awareness of wellness |
| 2028 | 5.8% | Emergence of new dietary trends |
| 2029 | 6.1% | Rising popularity of preventive healthcare |
| 2030 | 5.8% | rising procurement volume requirements |
| 2031 | 5.6% | Increased focus on holistic health |
| 2032 | 5.7% | expanding industrial usage applications |
Note: Market size estimations and growth projections presented in this report are based on 6Wresearch's proprietary forecasting methodology, utilizing the latest available industry data, government publications, and primary research inputs.
Sri Lanka Pantothenic Acid Market Synopsis
The rising awareness about the health benefits of pantothenic acid is the strongest force shaping the market right now. As consumers become more health-conscious, they are actively seeking supplements that promise energy production, improved metabolism, and skin health, all of which pantothenic acid supports effectively.
Moreover, the significant incorporation of pantothenic acid in the beauty and personal care industries underscores its growing appeal. The moisturizing and healing properties of Vitamin B5 are making it a sought-after ingredient in skincare products, thereby expanding its market presence significantly.
Sri Lanka Pantothenic Acid Market Key Takeaways
- The Sri Lanka Pantothenic Acid Market is expected to grow significantly, driven by rising health awareness.
- Key applications in dietary supplements, pharmaceuticals, and cosmetics are propelling demand.
- Innovation in product formulations is enhancing market competitiveness and consumer appeal.
- The governments supportive trade policies encourage foreign investment in this sector.
- Strategic partnerships with local manufacturers offer promising investment opportunities.
Evaluation of Restraints in Sri Lanka Pantothenic Acid Market
Despite its promising growth trajectory, the Sri Lanka Pantothenic Acid market faces notable restraints. A primary concern is the limited consumer awareness and understanding of the benefits of pantothenic acid, which hampers its utilization in pharmaceuticals, cosmetics, and dietary products. Moreover, the sporadic availability of pantothenic acid products complicates distribution for manufacturers. Regulatory hurdles also contribute to the challenges, making compliance a necessary yet burdensome aspect for companies looking to expand their market presence.
Sri Lanka Pantothenic Acid Market Trends
Several trends are shaping the Sri Lanka Pantothenic Acid market. The increasing focus on personal care and wellness products is leading to a greater incorporation of Vitamin B5 in skincare and cosmetic formulations. Additionally, consumer preferences are shifting toward natural and organic ingredients, prompting manufacturers to innovate and create high-quality products infused with pantothenic acid. The rise in lifestyle-related health issues is also pushing individuals toward preventive healthcare measures, driving demand for dietary supplements that include pantothenic acid.
Sri Lanka Pantothenic Acid Market Opportunities
The Sri Lanka Pantothenic Acid market presents lucrative investment opportunities, particularly in the sectors of dietary supplements and fortified foods. The increasing consumer base seeking health-oriented products paves the way for new entrants to establish manufacturing and distribution channels. Collaborations with local pharmaceutical companies to develop specialized formulations can also lead to fruitful ventures. Additionally, tapping into the burgeoning beauty industry by providing pantothenic acid-infused skincare products can significantly enhance profitability.
Government Initiatives in the Sri Lanka Pantothenic Acid Market
While there are no specific government policies targeting the Pantothenic Acid market, Sri Lanka's broader trade policies and regulations apply. The country promotes a free-market economy with minimal trade barriers, which facilitates the import and distribution of pantothenic acid products. The government actively encourages foreign investment and trade through incentives, fostering a conducive environment for businesses in this sector.
Future Insights of the Sri Lanka Pantothenic Acid Market
Looking ahead to 2026-2032, the Sri Lanka Pantothenic Acid market is poised for steady growth. As consumer awareness of the vitamins health benefits continues to escalate, demand for dietary supplements, fortified foods, and skincare products is expected to surge. The increasing trend towards preventive healthcare and wellness will further stimulate market expansion. Innovations in product formulations and strategic marketing will play critical roles in enhancing market penetration and ensuring a competitive edge.
Sri Lanka Pantothenic Acid Market Latest Developments (2025 - 2026)
Recent developments in the Sri Lanka Pantothenic Acid market indicate a heightened focus on consumer education regarding the benefits of Vitamin B5. Manufacturers are launching awareness campaigns to inform potential customers about the health advantages of pantothenic acid, particularly its role in energy production and skin health. Additionally, collaborations between health food retailers and pharmaceutical firms are increasingly occurring to expand product offerings and improve distribution networks.
Sri Lanka Pantothenic Acid Market - Key Attractiveness of the Report
- 10 Years of Market Numbers
- Historical Data Starting from 2022 to 2025
- Base Year: 2025
- Forecast Data until 2032
- Key Performance Indicators Impacting the Market
- Major Upcoming Developments and Projects
Key Highlights of the Report:
- Sri Lanka Pantothenic Acid Market Outlook
- Market Size of Sri Lanka Pantothenic Acid Market, 2025
- Forecast of Sri Lanka Pantothenic Acid Market, 2032
- Historical Data and Forecast of Sri Lanka Pantothenic Acid Revenues & Volume for the Period 2022-2032F
- Sri Lanka Pantothenic Acid Market Trend Evolution
- Sri Lanka Pantothenic Acid Market Drivers and Challenges
- Sri Lanka Pantothenic Acid Price Trends
- Sri Lanka Pantothenic Acid Porter's Five Forces
- Sri Lanka Pantothenic Acid Industry Life Cycle
- Historical Data and Forecast of Sri Lanka Pantothenic Acid Market Revenues & Volume By Form for the Period 2022-2032F
- Historical Data and Forecast of Sri Lanka Pantothenic Acid Market Revenues & Volume By Powder for the Period 2022-2032F
- Historical Data and Forecast of Sri Lanka Pantothenic Acid Market Revenues & Volume By Tablets for the Period 2022-2032F
- Historical Data and Forecast of Sri Lanka Pantothenic Acid Market Revenues & Volume By End Use for the Period 2022-2032F
- Historical Data and Forecast of Sri Lanka Pantothenic Acid Market Revenues & Volume By Pharmaceuticals for the Period 2022-2032F
- Historical Data and Forecast of Sri Lanka Pantothenic Acid Market Revenues & Volume By Nutritional &dietary Supplements for the Period 2022-2032F
- Historical Data and Forecast of Sri Lanka Pantothenic Acid Market Revenues & Volume By Animal Health & Nutrition for the Period 2022-2032F
- Historical Data and Forecast of Sri Lanka Pantothenic Acid Market Revenues & Volume By Infant Food & Supplements for the Period 2022-2032F
- Historical Data and Forecast of Sri Lanka Pantothenic Acid Market Revenues & Volume By Food & Beverages for the Period 2022-2032F
- Historical Data and Forecast of Sri Lanka Pantothenic Acid Market Revenues & Volume By Source for the Period 2022-2032F
- Historical Data and Forecast of Sri Lanka Pantothenic Acid Market Revenues & Volume By Plants for the Period 2022-2032F
- Historical Data and Forecast of Sri Lanka Pantothenic Acid Market Revenues & Volume By Animals for the Period 2022-2032F
- Historical Data and Forecast of Sri Lanka Pantothenic Acid Market Revenues & Volume By Dairy Products for the Period 2022-2032F
- Historical Data and Forecast of Sri Lanka Pantothenic Acid Market Revenues & Volume By Nature for the Period 2022-2032F
- Historical Data and Forecast of Sri Lanka Pantothenic Acid Market Revenues & Volume By Organic And for the Period 2022-2032F
- Historical Data and Forecast of Sri Lanka Pantothenic Acid Market Revenues & Volume By Inorganic for the Period 2022-2032F
- Sri Lanka Pantothenic Acid Import Export Trade Statistics
- Market Opportunity Assessment By Form
- Market Opportunity Assessment By End Use
- Market Opportunity Assessment By Source
- Market Opportunity Assessment By Nature
- Sri Lanka Pantothenic Acid Top Companies Market Share
- Sri Lanka Pantothenic Acid Competitive Benchmarking By Technical and Operational Parameters
- Sri Lanka Pantothenic Acid Company Profiles
- Sri Lanka Pantothenic Acid Key Strategic Recommendations
Frequently Asked Questions About the Market Study (FAQs):
The market was estimated at USD 373 Million in 2025 and is expected to reach USD 523 Million by 2032, indicating a CAGR of 4.9% from 2026 to 2032.
Due to its moisturizing and healing properties, pantothenic acid is increasingly used in skincare formulations, making it a preferred ingredient in lotions and creams.
Rising health awareness, lifestyle-related health issues, and a growing focus on preventive healthcare are significantly driving the demand for dietary supplements containing pantothenic acid.
Companies face regulatory hurdles related to quality control and product labeling, which can impact market entry and expansion strategies in Sri Lanka.
Innovation in product formulations and strategic marketing is crucial, as it enhances competitiveness and addresses the evolving preferences of health-conscious consumers.
There are significant opportunities in manufacturing dietary supplements, fortified food products, and cosmetics, particularly through partnerships with local firms to enhance market reach.
6Wresearch actively monitors the Sri Lanka Pantothenic Acid Market and publishes its comprehensive annual report, highlighting emerging trends, growth drivers, revenue analysis, and forecast outlook. Our insights help businesses to make data-backed strategic decisions with ongoing market dynamics. Our analysts track relevent industries related to the Sri Lanka Pantothenic Acid Market, allowing our clients with actionable intelligence and reliable forecasts tailored to emerging regional needs.
Yes, we provide customisation as per your requirements. To learn more, feel free to contact us on sales@6wresearch.com
1 Executive Summary |
2 Introduction |
2.1 Key Highlights of the Report |
2.2 Report Description |
2.3 Market Scope & Segmentation |
2.4 Research Methodology |
2.5 Assumptions |
3 Sri Lanka Pantothenic Acid Market Overview |
3.1 Sri Lanka Country Macro Economic Indicators |
3.2 Sri Lanka Pantothenic Acid Market Revenues & Volume, 2022 & 2032F |
3.3 Sri Lanka Pantothenic Acid Market - Industry Life Cycle |
3.4 Sri Lanka Pantothenic Acid Market - Porter's Five Forces |
3.5 Sri Lanka Pantothenic Acid Market Revenues & Volume Share, By Form, 2022 & 2032F |
3.6 Sri Lanka Pantothenic Acid Market Revenues & Volume Share, By End Use, 2022 & 2032F |
3.7 Sri Lanka Pantothenic Acid Market Revenues & Volume Share, By Source , 2022 & 2032F |
3.8 Sri Lanka Pantothenic Acid Market Revenues & Volume Share, By Nature, 2022 & 2032F |
4 Sri Lanka Pantothenic Acid Market Dynamics |
4.1 Impact Analysis |
4.2 Market Drivers |
4.2.1 Growing awareness about the health benefits of pantothenic acid |
4.2.2 Increasing adoption of dietary supplements containing pantothenic acid |
4.2.3 Rise in demand for pantothenic acid in the pharmaceutical industry |
4.3 Market Restraints |
4.3.1 Price volatility of raw materials used in pantothenic acid production |
4.3.2 Regulatory challenges related to the manufacturing and marketing of pantothenic acid supplements |
5 Sri Lanka Pantothenic Acid Market Trends |
6 Sri Lanka Pantothenic Acid Market, By Types |
6.1 Sri Lanka Pantothenic Acid Market, By Form |
6.1.1 Overview and Analysis |
6.1.2 Sri Lanka Pantothenic Acid Market Revenues & Volume, By Form, 2022-2032F |
6.1.3 Sri Lanka Pantothenic Acid Market Revenues & Volume, By Powder, 2022-2032F |
6.1.4 Sri Lanka Pantothenic Acid Market Revenues & Volume, By Tablets, 2022-2032F |
6.2 Sri Lanka Pantothenic Acid Market, By End Use |
6.2.1 Overview and Analysis |
6.2.2 Sri Lanka Pantothenic Acid Market Revenues & Volume, By Pharmaceuticals, 2022-2032F |
6.2.3 Sri Lanka Pantothenic Acid Market Revenues & Volume, By Nutritional &dietary Supplements, 2022-2032F |
6.2.4 Sri Lanka Pantothenic Acid Market Revenues & Volume, By Animal Health & Nutrition, 2022-2032F |
6.2.5 Sri Lanka Pantothenic Acid Market Revenues & Volume, By Infant Food & Supplements, 2022-2032F |
6.2.6 Sri Lanka Pantothenic Acid Market Revenues & Volume, By Food & Beverages, 2022-2032F |
6.3 Sri Lanka Pantothenic Acid Market, By Source |
6.3.1 Overview and Analysis |
6.3.2 Sri Lanka Pantothenic Acid Market Revenues & Volume, By Plants, 2022-2032F |
6.3.3 Sri Lanka Pantothenic Acid Market Revenues & Volume, By Animals, 2022-2032F |
6.3.4 Sri Lanka Pantothenic Acid Market Revenues & Volume, By Dairy Products, 2022-2032F |
6.4 Sri Lanka Pantothenic Acid Market, By Nature |
6.4.1 Overview and Analysis |
6.4.2 Sri Lanka Pantothenic Acid Market Revenues & Volume, By Organic And , 2022-2032F |
6.4.3 Sri Lanka Pantothenic Acid Market Revenues & Volume, By Inorganic, 2022-2032F |
7 Sri Lanka Pantothenic Acid Market Import-Export Trade Statistics |
7.1 Sri Lanka Pantothenic Acid Market Export to Major Countries |
7.2 Sri Lanka Pantothenic Acid Market Imports from Major Countries |
8 Sri Lanka Pantothenic Acid Market Key Performance Indicators |
8.1 Percentage increase in the number of pantothenic acid supplement users in Sri Lanka |
8.2 Growth in the number of pharmaceutical products containing pantothenic acid |
8.3 Adoption rate of pantothenic acid-enriched food products in the Sri Lankan market |
9 Sri Lanka Pantothenic Acid Market - Opportunity Assessment |
9.1 Sri Lanka Pantothenic Acid Market Opportunity Assessment, By Form, 2022 & 2032F |
9.2 Sri Lanka Pantothenic Acid Market Opportunity Assessment, By End Use, 2022 & 2032F |
9.3 Sri Lanka Pantothenic Acid Market Opportunity Assessment, By Source , 2022 & 2032F |
9.4 Sri Lanka Pantothenic Acid Market Opportunity Assessment, By Nature, 2022 & 2032F |
10 Sri Lanka Pantothenic Acid Market - Competitive Landscape |
10.1 Sri Lanka Pantothenic Acid Market Revenue Share, By Companies, 2025 |
10.2 Sri Lanka Pantothenic Acid Market Competitive Benchmarking, By Operating and Technical Parameters |
11 Company Profiles |
12 Recommendations |
13 Disclaimer |
Global Go To Market Strategy - 2030
Export potential enables firms to identify high-growth global markets with greater confidence by combining advanced trade intelligence with a structured quantitative methodology. The framework analyzes emerging demand trends and country-level import patterns while integrating macroeconomic and trade datasets such as GDP and population forecasts, bilateral import–export flows, tariff structures, elasticity differentials between developed and developing economies, geographic distance, and import demand projections. Using weighted trade values from 2020–2024 as the base period to project country-to-country export potential for 2030, these inputs are operationalized through calculated drivers such as gravity model parameters, tariff impact factors, and projected GDP per-capita growth. Through an analysis of hidden potentials, demand hotspots, and market conditions that are most favorable to success, this method enables firms to focus on target countries, maximize returns, and global expansion with data, backed by accuracy.
By factoring in the projected importer demand gap that is currently unmet and could be potential opportunity, it identifies the potential for the Exporter (Country) among 190 countries, against the general trade analysis, which identifies the biggest importer or exporter.
To discover high-growth global markets and optimize your business strategy:
Click Here
Pricing
- Single User License$ 1,995
- Department License$ 2,400
- Site License$ 3,120
- Global License$ 3,795

Leadership Perspectives from Industry Events
Search
Thought Leadership and Analyst Meet


Our Clients
6WResearch In News
- India Air Conditioner Market Set for Strong Rebound in 2026 After Weather-Led Correction and GST-Driven Recovery: 6Wresearch
- ADAS in India: How Automatic Emergency Braking, Blind Spot Detection & Driver Monitoring are Transforming Road Safety
- Doha a strategic location for EV manufacturing hub: IPA Qatar
- Demand for luxury TVs surging in the GCC, says Samsung
- Empowering Growth: The Thriving Journey of Bangladesh’s Cable Industry
- Demand for luxury TVs surging in the GCC, says Samsung
Latest Reports
- Nicaragua RPG Gaming Market (2026-2032)
- New Zealand RPG Gaming Market (2026-2032)
- Netherlands RPG Gaming Market (2026-2032)
- Nauru RPG Gaming Market (2026-2032)
- Namibia RPG Gaming Market (2026-2032)
- Mozambique RPG Gaming Market (2026-2032)
- Montenegro RPG Gaming Market (2026-2032)
- Mongolia RPG Gaming Market (2026-2032)
- Monaco RPG Gaming Market (2026-2032)
- Micronesia RPG Gaming Market (2026-2032)
Industry Events and Analyst Meet

EV India Expo 2026

HIMTEX 2026

India Refining Summit 2026

India EV Show 2026

EV tech India Expo 2026
Whitepaper
- Middle East & Africa Commercial Security Market Click here to view more.
- Middle East & Africa Fire Safety Systems & Equipment Market Click here to view more.
- GCC Drone Market Click here to view more.
- Middle East Lighting Fixture Market Click here to view more.
- GCC Physical & Perimeter Security Market Click here to view more.