Sweden Baby Drinking Water Market (2026-2032) | Outlook, Industry, Restraints, Segments, Strategic Insights, Strategy, Companies, Challenges, Competition, Opportunities, Growth, Competitive, Analysis, Share, Forecast, Pricing Analysis, Demand, Supply, Value, Drivers, Segmentation, Size, Revenue, Trends, Consumer Insights, Investment Trends
Market Forecast By Product Type (Natural Spring Water, Mineral Water, Distilled Water, Purified Water, Alkaline Water), By Application (Hydration for Infants, Infant Formula Mixing, Bottle Sterilization, General Consumption, Immunity Boosting), By End User (Hospitals, Pediatric Clinics, Households, Daycare Centers, Maternity Homes), By Distribution Channel (Direct Sales, Online Sales, Retail Stores, Third-Party Sales, Pharmacies) And Competitive Landscape
| Product Code: ETC11223595 | Publication Date: Apr 2025 | Updated Date: Apr 2026 | Product Type: Market Research Report | |
| Publisher: 6Wresearch | Author: Bhawna Singh | No. of Pages: 65 | No. of Figures: 34 | No. of Tables: 19 |
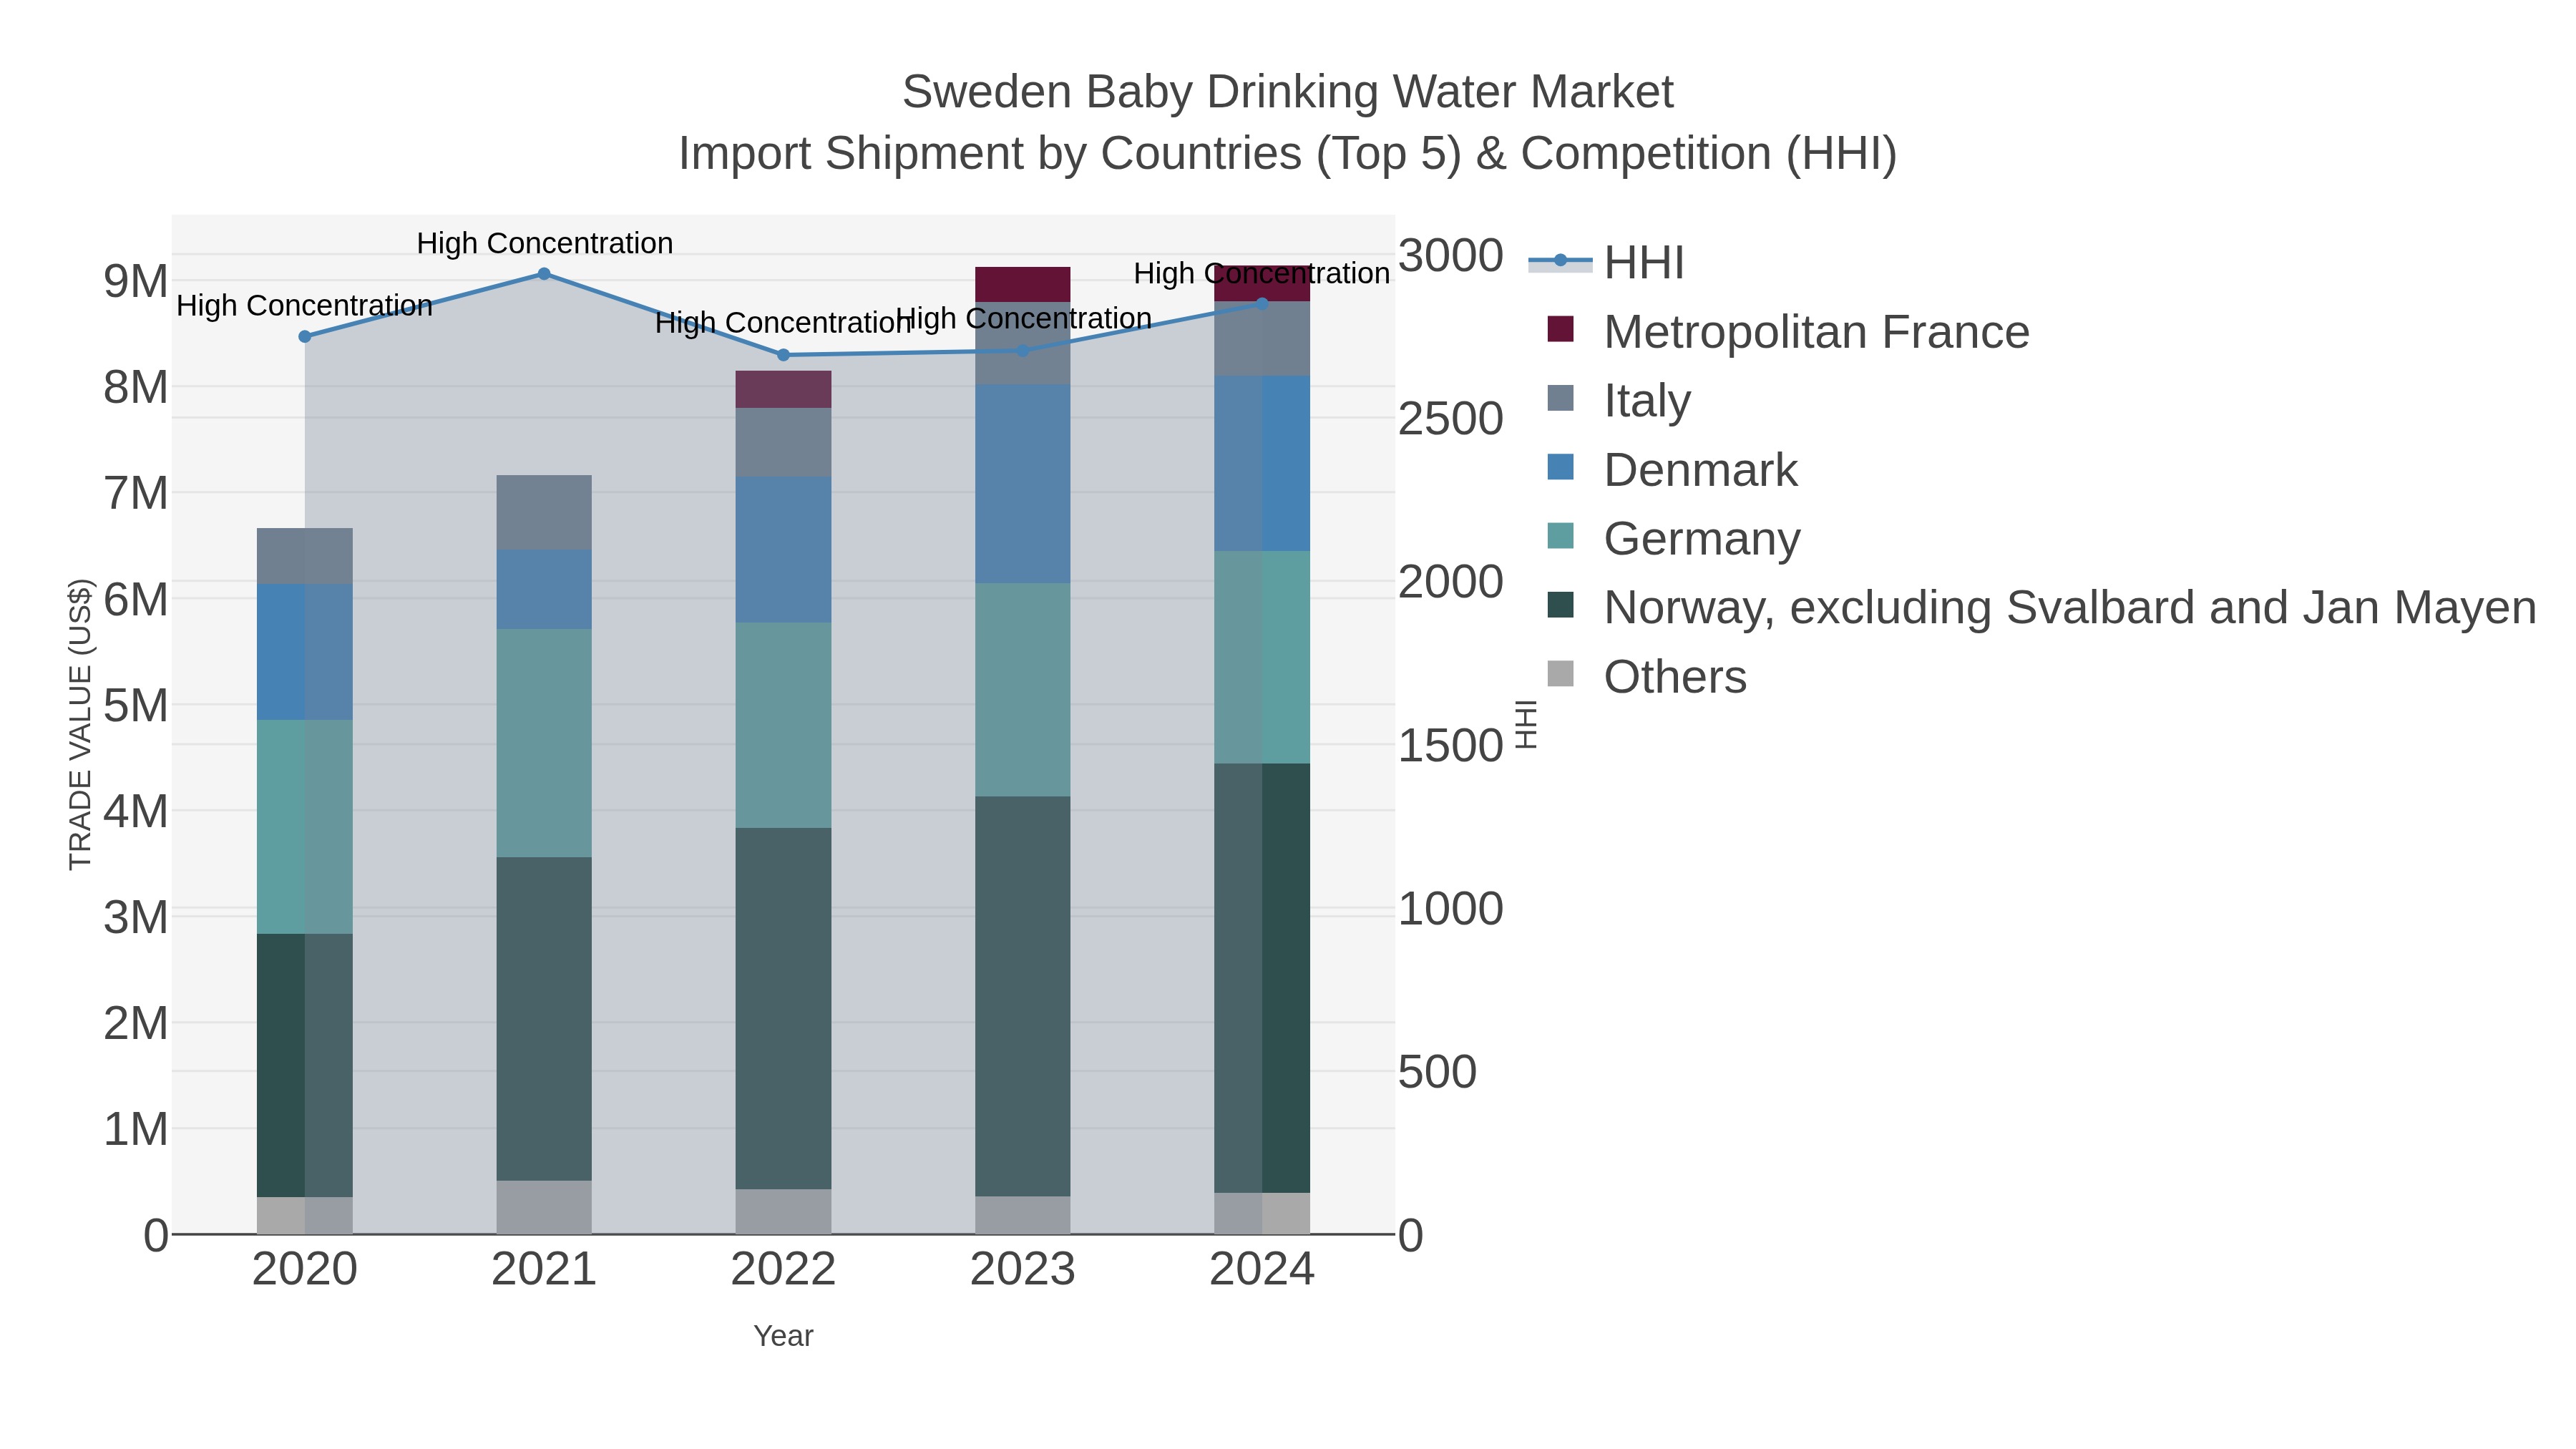
Sweden Baby Drinking Water Market Top 5 Importing Countries and Market Competition (HHI) Analysis
In 2024, Sweden continued to rely on imports of baby drinking water, with top exporters being Norway, Germany, Denmark, Italy, and Metropolitan France. Despite the high concentration of the Herfindahl-Hirschman Index (HHI) in the market, indicating limited competition, the industry saw steady growth with a Compound Annual Growth Rate (CAGR) of 8.21% from 2020 to 2024. The marginal growth rate of 0.16% from 2023 to 2024 suggests a stable market environment for baby drinking water imports in Sweden.
Key Highlights of the Report:
- Sweden Baby Drinking Water Market Outlook
- Market Size of Sweden Baby Drinking Water Market, 2025
- Forecast of Sweden Baby Drinking Water Market, 2032
- Historical Data and Forecast of Sweden Baby Drinking Water Revenues & Volume for the Period 2022 - 2032F
- Sweden Baby Drinking Water Market Trend Evolution
- Sweden Baby Drinking Water Market Drivers and Challenges
- Sweden Baby Drinking Water Price Trends
- Sweden Baby Drinking Water Porter's Five Forces
- Sweden Baby Drinking Water Industry Life Cycle
- Historical Data and Forecast of Sweden Baby Drinking Water Market Revenues & Volume By Product Type for the Period 2022 - 2032F
- Historical Data and Forecast of Sweden Baby Drinking Water Market Revenues & Volume By Natural Spring Water for the Period 2022 - 2032F
- Historical Data and Forecast of Sweden Baby Drinking Water Market Revenues & Volume By Mineral Water for the Period 2022 - 2032F
- Historical Data and Forecast of Sweden Baby Drinking Water Market Revenues & Volume By Distilled Water for the Period 2022 - 2032F
- Historical Data and Forecast of Sweden Baby Drinking Water Market Revenues & Volume By Purified Water for the Period 2022 - 2032F
- Historical Data and Forecast of Sweden Baby Drinking Water Market Revenues & Volume By Alkaline Water for the Period 2022 - 2032F
- Historical Data and Forecast of Sweden Baby Drinking Water Market Revenues & Volume By Application for the Period 2022 - 2032F
- Historical Data and Forecast of Sweden Baby Drinking Water Market Revenues & Volume By Hydration for Infants for the Period 2022 - 2032F
- Historical Data and Forecast of Sweden Baby Drinking Water Market Revenues & Volume By Infant Formula Mixing for the Period 2022 - 2032F
- Historical Data and Forecast of Sweden Baby Drinking Water Market Revenues & Volume By Bottle Sterilization for the Period 2022 - 2032F
- Historical Data and Forecast of Sweden Baby Drinking Water Market Revenues & Volume By General Consumption for the Period 2022 - 2032F
- Historical Data and Forecast of Sweden Baby Drinking Water Market Revenues & Volume By Immunity Boosting for the Period 2022 - 2032F
- Historical Data and Forecast of Sweden Baby Drinking Water Market Revenues & Volume By End User for the Period 2022 - 2032F
- Historical Data and Forecast of Sweden Baby Drinking Water Market Revenues & Volume By Hospitals for the Period 2022 - 2032F
- Historical Data and Forecast of Sweden Baby Drinking Water Market Revenues & Volume By Pediatric Clinics for the Period 2022 - 2032F
- Historical Data and Forecast of Sweden Baby Drinking Water Market Revenues & Volume By Households for the Period 2022 - 2032F
- Historical Data and Forecast of Sweden Baby Drinking Water Market Revenues & Volume By Daycare Centers for the Period 2022 - 2032F
- Historical Data and Forecast of Sweden Baby Drinking Water Market Revenues & Volume By Maternity Homes for the Period 2022 - 2032F
- Historical Data and Forecast of Sweden Baby Drinking Water Market Revenues & Volume By Distribution Channel for the Period 2022 - 2032F
- Historical Data and Forecast of Sweden Baby Drinking Water Market Revenues & Volume By Direct Sales for the Period 2022 - 2032F
- Historical Data and Forecast of Sweden Baby Drinking Water Market Revenues & Volume By Online Sales for the Period 2022 - 2032F
- Historical Data and Forecast of Sweden Baby Drinking Water Market Revenues & Volume By Retail Stores for the Period 2022 - 2032F
- Historical Data and Forecast of Sweden Baby Drinking Water Market Revenues & Volume By Third-Party Sales for the Period 2022 - 2032F
- Historical Data and Forecast of Sweden Baby Drinking Water Market Revenues & Volume By Pharmacies for the Period 2022 - 2032F
- Sweden Baby Drinking Water Import Export Trade Statistics
- Market Opportunity Assessment By Product Type
- Market Opportunity Assessment By Application
- Market Opportunity Assessment By End User
- Market Opportunity Assessment By Distribution Channel
- Sweden Baby Drinking Water Top Companies Market Share
- Sweden Baby Drinking Water Competitive Benchmarking By Technical and Operational Parameters
- Sweden Baby Drinking Water Company Profiles
- Sweden Baby Drinking Water Key Strategic Recommendations
Frequently Asked Questions About the Market Study (FAQs):
6Wresearch actively monitors the Sweden Baby Drinking Water Market and publishes its comprehensive annual report, highlighting emerging trends, growth drivers, revenue analysis, and forecast outlook. Our insights help businesses to make data-backed strategic decisions with ongoing market dynamics. Our analysts track relevent industries related to the Sweden Baby Drinking Water Market, allowing our clients with actionable intelligence and reliable forecasts tailored to emerging regional needs.
Yes, we provide customisation as per your requirements. To learn more, feel free to contact us on sales@6wresearch.com
1 Executive Summary |
2 Introduction |
2.1 Key Highlights of the Report |
2.2 Report Description |
2.3 Market Scope & Segmentation |
2.4 Research Methodology |
2.5 Assumptions |
3 Sweden Baby Drinking Water Market Overview |
3.1 Sweden Country Macro Economic Indicators |
3.2 Sweden Baby Drinking Water Market Revenues & Volume, 2022 & 2032F |
3.3 Sweden Baby Drinking Water Market - Industry Life Cycle |
3.4 Sweden Baby Drinking Water Market - Porter's Five Forces |
3.5 Sweden Baby Drinking Water Market Revenues & Volume Share, By Product Type, 2022 & 2032F |
3.6 Sweden Baby Drinking Water Market Revenues & Volume Share, By Application, 2022 & 2032F |
3.7 Sweden Baby Drinking Water Market Revenues & Volume Share, By End User, 2022 & 2032F |
3.8 Sweden Baby Drinking Water Market Revenues & Volume Share, By Distribution Channel, 2022 & 2032F |
4 Sweden Baby Drinking Water Market Dynamics |
4.1 Impact Analysis |
4.2 Market Drivers |
4.2.1 Increasing awareness about the importance of safe drinking water for babies' health |
4.2.2 Growing concerns about water quality and contamination |
4.2.3 Rising demand for convenient and portable water solutions for babies |
4.3 Market Restraints |
4.3.1 Stringent regulations and quality standards for baby drinking water |
4.3.2 Competition from other baby beverage options like formula milk and fruit juices |
5 Sweden Baby Drinking Water Market Trends |
6 Sweden Baby Drinking Water Market, By Types |
6.1 Sweden Baby Drinking Water Market, By Product Type |
6.1.1 Overview and Analysis |
6.1.2 Sweden Baby Drinking Water Market Revenues & Volume, By Product Type, 2022 - 2032F |
6.1.3 Sweden Baby Drinking Water Market Revenues & Volume, By Natural Spring Water, 2022 - 2032F |
6.1.4 Sweden Baby Drinking Water Market Revenues & Volume, By Mineral Water, 2022 - 2032F |
6.1.5 Sweden Baby Drinking Water Market Revenues & Volume, By Distilled Water, 2022 - 2032F |
6.1.6 Sweden Baby Drinking Water Market Revenues & Volume, By Purified Water, 2022 - 2032F |
6.1.7 Sweden Baby Drinking Water Market Revenues & Volume, By Alkaline Water, 2022 - 2032F |
6.2 Sweden Baby Drinking Water Market, By Application |
6.2.1 Overview and Analysis |
6.2.2 Sweden Baby Drinking Water Market Revenues & Volume, By Hydration for Infants, 2022 - 2032F |
6.2.3 Sweden Baby Drinking Water Market Revenues & Volume, By Infant Formula Mixing, 2022 - 2032F |
6.2.4 Sweden Baby Drinking Water Market Revenues & Volume, By Bottle Sterilization, 2022 - 2032F |
6.2.5 Sweden Baby Drinking Water Market Revenues & Volume, By General Consumption, 2022 - 2032F |
6.2.6 Sweden Baby Drinking Water Market Revenues & Volume, By Immunity Boosting, 2022 - 2032F |
6.3 Sweden Baby Drinking Water Market, By End User |
6.3.1 Overview and Analysis |
6.3.2 Sweden Baby Drinking Water Market Revenues & Volume, By Hospitals, 2022 - 2032F |
6.3.3 Sweden Baby Drinking Water Market Revenues & Volume, By Pediatric Clinics, 2022 - 2032F |
6.3.4 Sweden Baby Drinking Water Market Revenues & Volume, By Households, 2022 - 2032F |
6.3.5 Sweden Baby Drinking Water Market Revenues & Volume, By Daycare Centers, 2022 - 2032F |
6.3.6 Sweden Baby Drinking Water Market Revenues & Volume, By Maternity Homes, 2022 - 2032F |
6.4 Sweden Baby Drinking Water Market, By Distribution Channel |
6.4.1 Overview and Analysis |
6.4.2 Sweden Baby Drinking Water Market Revenues & Volume, By Direct Sales, 2022 - 2032F |
6.4.3 Sweden Baby Drinking Water Market Revenues & Volume, By Online Sales, 2022 - 2032F |
6.4.4 Sweden Baby Drinking Water Market Revenues & Volume, By Retail Stores, 2022 - 2032F |
6.4.5 Sweden Baby Drinking Water Market Revenues & Volume, By Third-Party Sales, 2022 - 2032F |
6.4.6 Sweden Baby Drinking Water Market Revenues & Volume, By Pharmacies, 2022 - 2032F |
7 Sweden Baby Drinking Water Market Import-Export Trade Statistics |
7.1 Sweden Baby Drinking Water Market Export to Major Countries |
7.2 Sweden Baby Drinking Water Market Imports from Major Countries |
8 Sweden Baby Drinking Water Market Key Performance Indicators |
8.1 Consumer trust and satisfaction levels with baby drinking water brands |
8.2 Number of new product innovations and launches in the baby drinking water segment |
8.3 Adoption rate of eco-friendly packaging solutions for baby drinking water |
9 Sweden Baby Drinking Water Market - Opportunity Assessment |
9.1 Sweden Baby Drinking Water Market Opportunity Assessment, By Product Type, 2022 & 2032F |
9.2 Sweden Baby Drinking Water Market Opportunity Assessment, By Application, 2022 & 2032F |
9.3 Sweden Baby Drinking Water Market Opportunity Assessment, By End User, 2022 & 2032F |
9.4 Sweden Baby Drinking Water Market Opportunity Assessment, By Distribution Channel, 2022 & 2032F |
10 Sweden Baby Drinking Water Market - Competitive Landscape |
10.1 Sweden Baby Drinking Water Market Revenue Share, By Companies, 2025 |
10.2 Sweden Baby Drinking Water Market Competitive Benchmarking, By Operating and Technical Parameters |
11 Company Profiles |
12 Recommendations |
13 Disclaimer |
Export potential assessment - trade Analytics for 2030
Export potential enables firms to identify high-growth global markets with greater confidence by combining advanced trade intelligence with a structured quantitative methodology. The framework analyzes emerging demand trends and country-level import patterns while integrating macroeconomic and trade datasets such as GDP and population forecasts, bilateral import–export flows, tariff structures, elasticity differentials between developed and developing economies, geographic distance, and import demand projections. Using weighted trade values from 2020–2024 as the base period to project country-to-country export potential for 2030, these inputs are operationalized through calculated drivers such as gravity model parameters, tariff impact factors, and projected GDP per-capita growth. Through an analysis of hidden potentials, demand hotspots, and market conditions that are most favorable to success, this method enables firms to focus on target countries, maximize returns, and global expansion with data, backed by accuracy.
By factoring in the projected importer demand gap that is currently unmet and could be potential opportunity, it identifies the potential for the Exporter (Country) among 190 countries, against the general trade analysis, which identifies the biggest importer or exporter.
To discover high-growth global markets and optimize your business strategy:
Click Here
Pricing
- Single User License$ 1,995
- Department License$ 2,400
- Site License$ 3,120
- Global License$ 3,795

Search
Thought Leadership and Analyst Meet


Our Clients
Latest Reports
- United Kingdom (UK) Outdoor Cooking Equipment Market (2026-2032) | Investment Opportunities, Outlook, Growth, Competition, Trends, Pricing, Demand, Insights, Challenges, Drivers, Size, Restraints, segmentation, Value, Share, Forecast, Companies, Analysis, Revenue, Strategy
- United Arab Emirates (UAE) Outdoor Cooking Equipment Market (2026-2032) | Challenges, Value, Restraints, Growth, Competition, Revenue, Trends, Outlook, Analysis, Drivers, Share, Investment Opportunities, Strategy, Demand, Companies, Forecast, Pricing, segmentation, Size, Insights
- Vietnam Outdoor Cooking Equipment Market (2026-2032) | Demand, Investment Opportunities, Growth, Pricing, Trends, Restraints, Competition, Outlook, Drivers, Strategy, Challenges, Revenue, Analysis, segmentation, Value, Size, Share, Insights, Companies, Forecast
- Venezuela Outdoor Cooking Equipment Market (2026-2032) | Challenges, Revenue, Demand, Value, Pricing, Strategy, Competition, Analysis, Companies, Insights, Growth, Outlook, Forecast, Size, Restraints, segmentation, Drivers, Trends, Investment Opportunities, Share
- Uganda Outdoor Cooking Equipment Market (2026-2032) | Drivers, Pricing, Challenges, Value, Growth, Companies, segmentation, Strategy, Analysis, Demand, Outlook, Size, Competition, Restraints, Revenue, Forecast, Investment Opportunities, Insights, Trends, Share
- Turkey Outdoor Cooking Equipment Market (2026-2032) | Size, Competition, Outlook, Strategy, Forecast, Drivers, Trends, Companies, Revenue, Growth, Analysis, segmentation, Insights, Pricing, Restraints, Demand, Investment Opportunities, Value, Share, Challenges
- Tunisia Outdoor Cooking Equipment Market (2026-2032) | Analysis, Share, Pricing, Trends, Size, Outlook, Revenue, segmentation, Demand, Insights, Investment Opportunities, Restraints, Growth, Forecast, Competition, Drivers, Challenges, Companies, Strategy, Value
- Thailand Outdoor Cooking Equipment Market (2026-2032) | Growth, Revenue, Insights, Companies, Drivers, Strategy, Forecast, Size, Analysis, segmentation, Trends, Challenges, Competition, Share, Investment Opportunities, Demand, Pricing, Value, Restraints, Outlook
- Tanzania Outdoor Cooking Equipment Market (2026-2032) | Share, Drivers, Forecast, Revenue, Growth, Outlook, Analysis, Investment Opportunities, Restraints, segmentation, Demand, Pricing, Size, Insights, Challenges, Competition, Companies, Value, Trends, Strategy
- Tajikistan Outdoor Cooking Equipment Market (2026-2032) | Value, Pricing, Companies, Share, Strategy, Revenue, Investment Opportunities, Demand, Forecast, Size, Competition, Challenges, Growth, Insights, Restraints, segmentation, Analysis, Trends, Drivers, Outlook
Industry Events and Analyst Meet

HIMTEX 2026

India Refining Summit 2026

India EV Show 2026

EV tech India Expo 2026

Auto Tech Asia 2026
Whitepaper
- Middle East & Africa Commercial Security Market Click here to view more.
- Middle East & Africa Fire Safety Systems & Equipment Market Click here to view more.
- GCC Drone Market Click here to view more.
- Middle East Lighting Fixture Market Click here to view more.
- GCC Physical & Perimeter Security Market Click here to view more.
6WResearch In News
- Doha a strategic location for EV manufacturing hub: IPA Qatar
- Demand for luxury TVs surging in the GCC, says Samsung
- Empowering Growth: The Thriving Journey of Bangladesh’s Cable Industry
- Demand for luxury TVs surging in the GCC, says Samsung
- Video call with a traditional healer? Once unthinkable, it’s now common in South Africa
- Intelligent Buildings To Smooth GCC’s Path To Net Zero