Sweden Optical Coherence Tomography Market (2026-2032) | Size, Growth, Supply, Restraints, Demand, Analysis, Segmentation, Revenue, Investment Trends, Challenges, Competitive, Companies, Forecast, Industry, Outlook, Strategy, Competition, Pricing Analysis, Consumer Insights, Drivers, Strategic Insights, Share, Segments, Value, Trends, Opportunities
Market Forecast By Type (Time-Domain OCT, Spectral-Domain OCT, Swept-Source OCT, Others), By Technology (Spectral-Domain OCT, Swept-Source OCT, Polarization-Sensitive OCT, Others), By Application (Ophthalmology, Cardiovascular Imaging, Dermatology, Oncology), By End User (Hospitals, Specialty Clinics, Research Institutes, Diagnostic Centers) And Competitive Landscape
| Product Code: ETC10710955 | Publication Date: Apr 2025 | Updated Date: Apr 2026 | Product Type: Market Research Report | |
| Publisher: 6Wresearch | Author: Bhawna Singh | No. of Pages: 65 | No. of Figures: 34 | No. of Tables: 19 |
Sweden Optical Coherence Tomography Market Size (2020-2030)
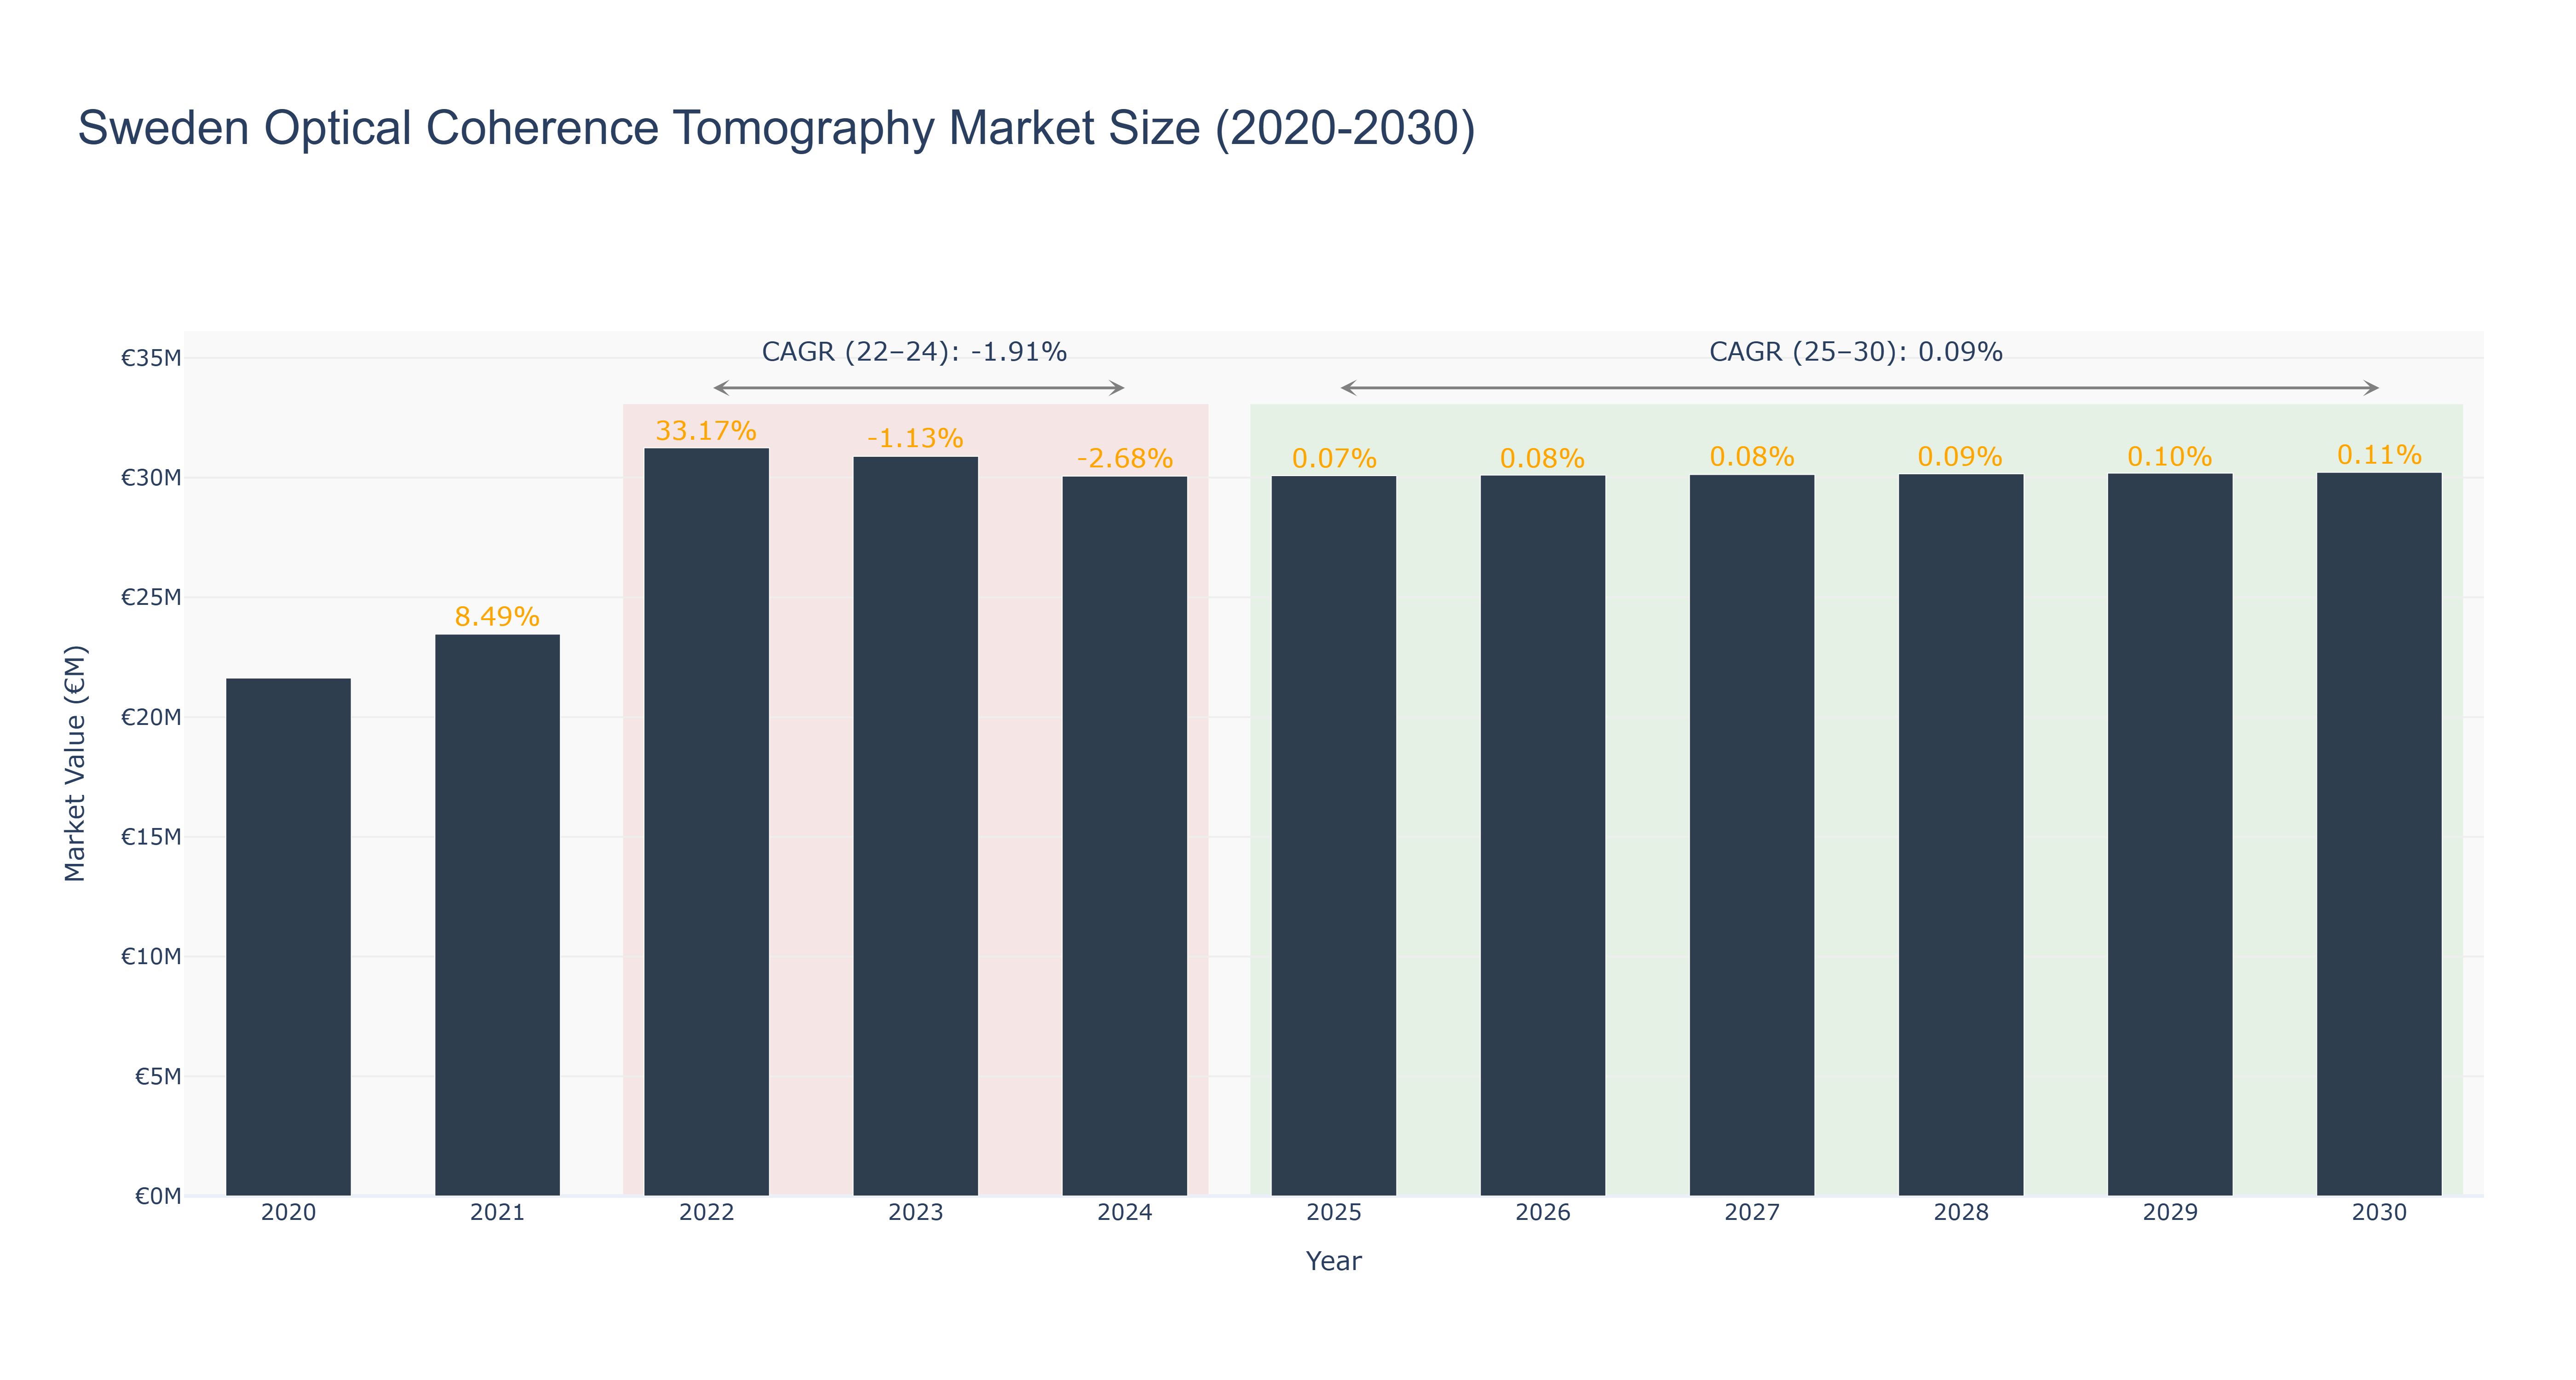
Sweden Optical Coherence Tomography Market has shown a mixed trend over the years. The peak market size of €31.25 million was observed in 2022, followed by a slight decline to €30.06 million in 2024. However, the market has stabilized since then, with a marginal increase to €30.08 million in 2025 and a steady growth trajectory forecasted up to 2030, reaching €30.22 million. The CAGR for 2022-24 was -1.91%, reflecting a temporary setback, while the CAGR for 2025-30 is projected at 0.09%, indicating a gradual recovery and growth phase. Industry drivers such as technological advancements in healthcare and increasing demand for non-invasive diagnostic tools are expected to support market expansion. Looking ahead, Sweden is set to launch a national healthcare initiative focusing on enhancing diagnostic imaging services, which could further boost the demand for Optical Coherence Tomography systems in the country.
Sweden Optical Coherence Tomography Market: Production & Trade Performance (2019-2025)
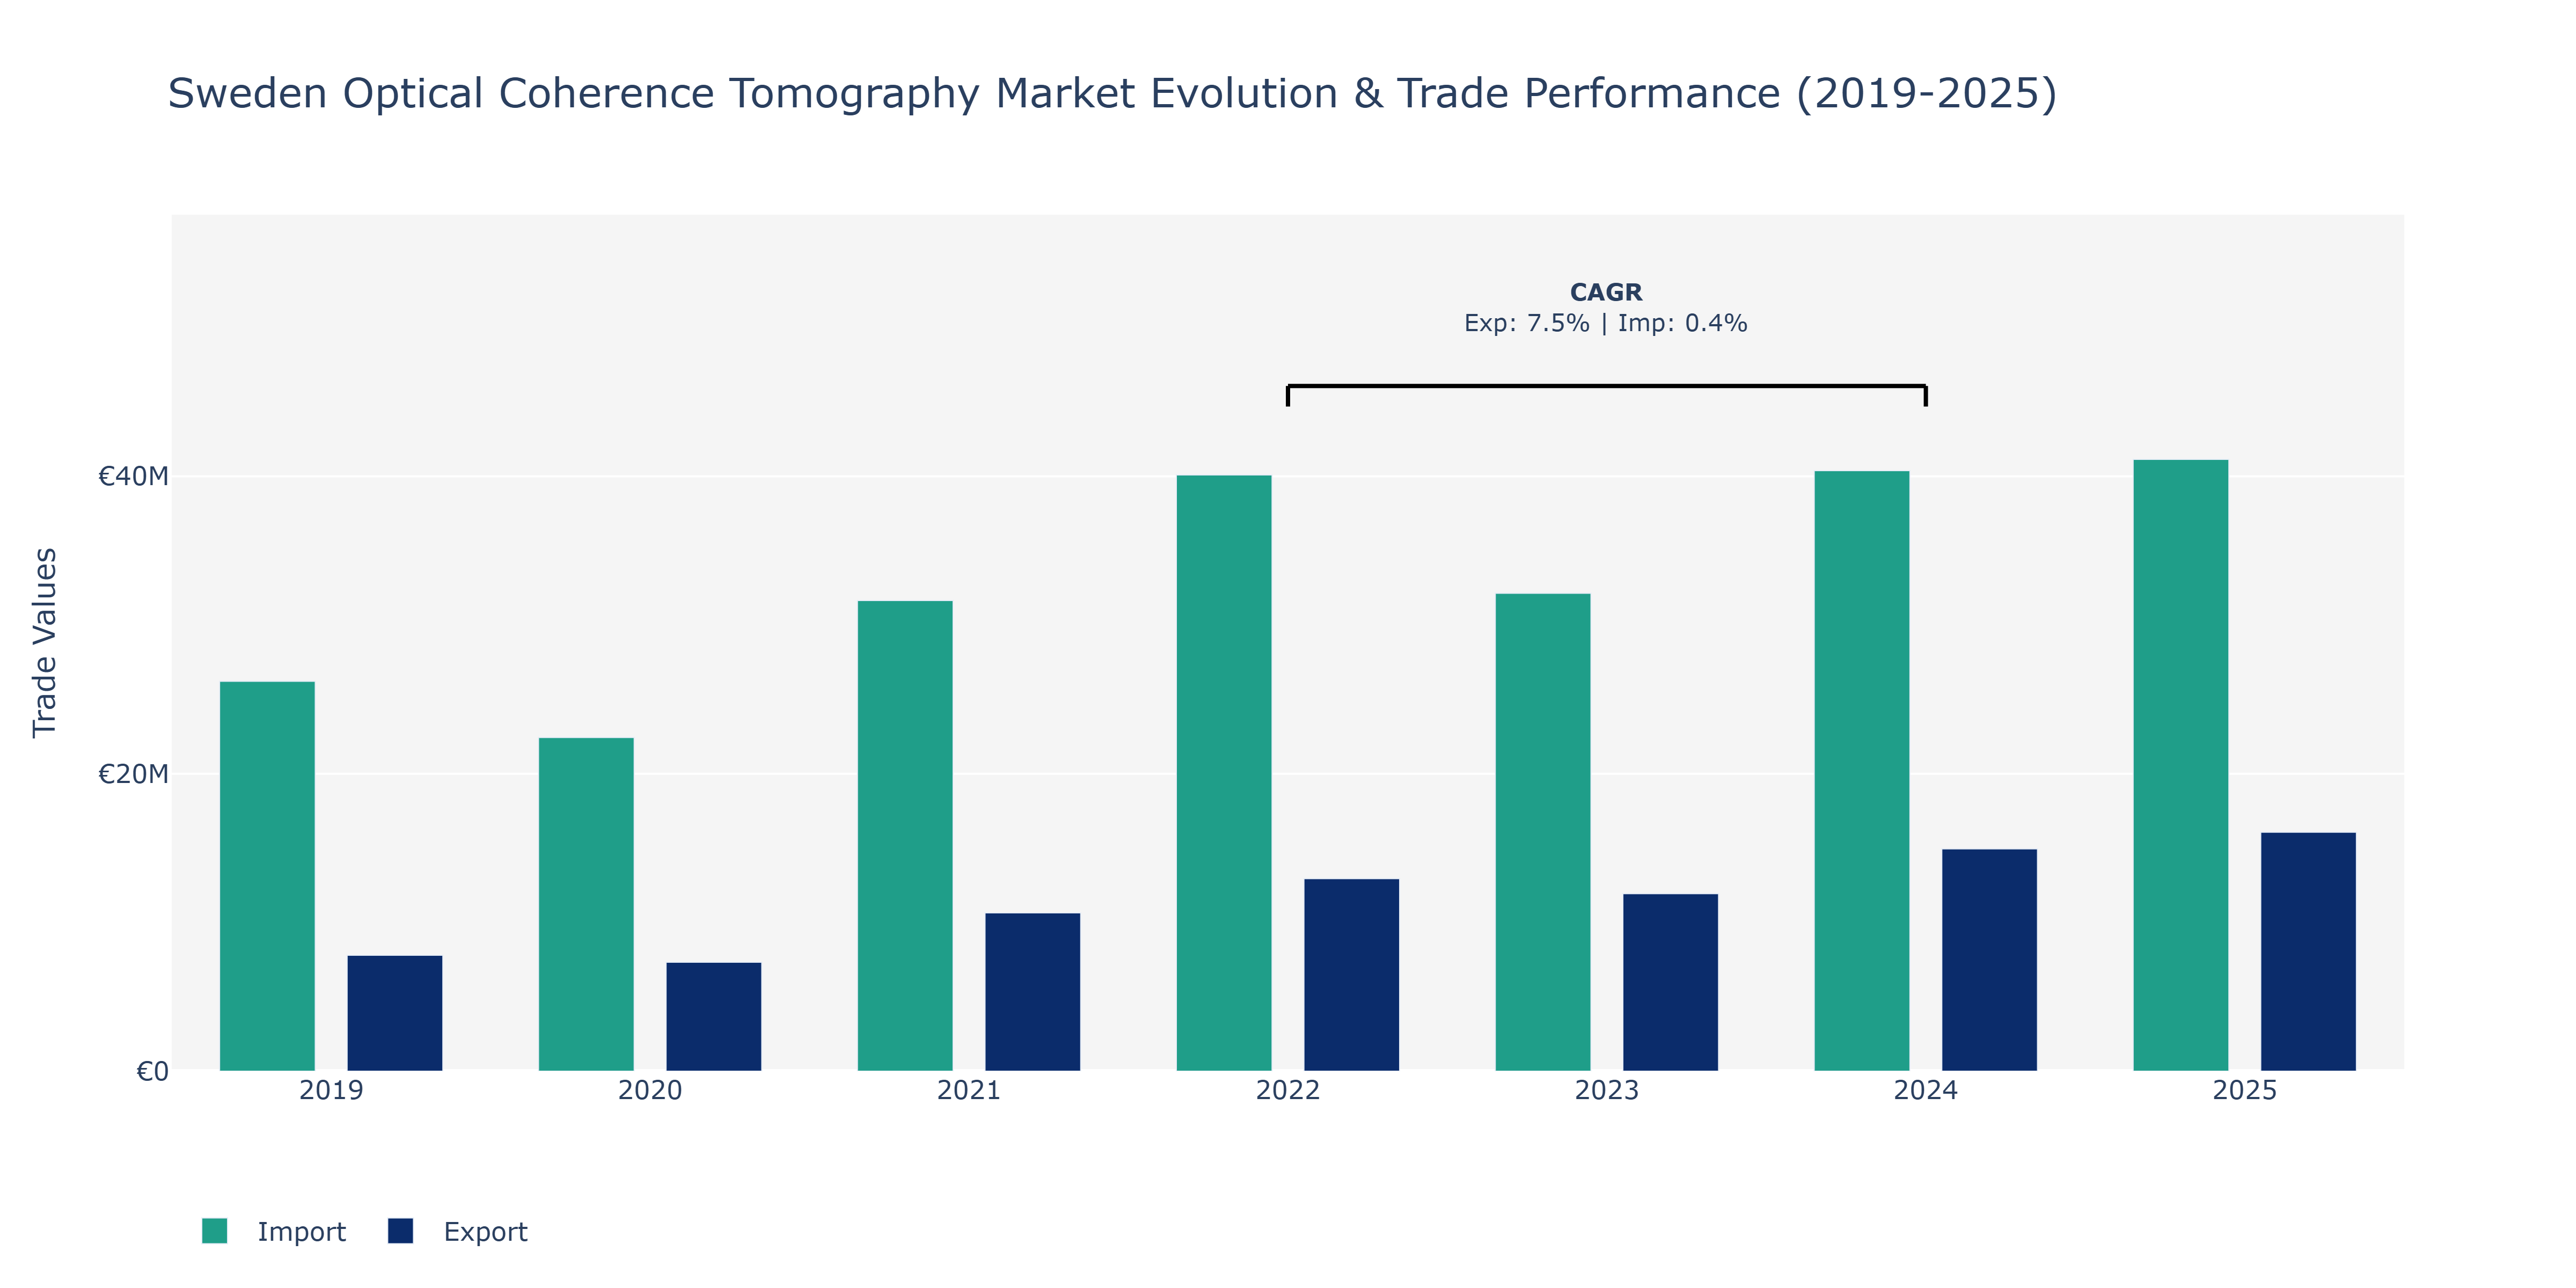
The Sweden Optical Coherence Tomography Market witnessed fluctuations in both Exports and Imports over the years. From 2019 to 2020, Exports decreased from €7.79 million to €7.33 million while Imports fell from €26.21 million to €22.44 million. The year 2021 marked a significant upturn in trade activity with Exports surging to €10.64 million and Imports reaching €31.64 million. This growth trend continued into 2022, with Exports climbing to €12.95 million and Imports to €40.09 million. However, in 2023, there was a slight decline in Exports to €11.93 million while Imports remained stable at €32.13 million. The peak points were observed in 2024 with Exports at €14.95 million and Imports at €40.38 million. The steady rise in Exports can be attributed to increased demand for advanced medical imaging technologies globally. On the other hand, the fluctuations in Imports may reflect changes in domestic consumption patterns and regulatory requirements impacting the procurement of optical coherence tomography equipment.
Key Highlights of the Report:
- Sweden Optical Coherence Tomography Market Outlook
- Market Size of Sweden Optical Coherence Tomography Market, 2025
- Forecast of Sweden Optical Coherence Tomography Market, 2032
- Historical Data and Forecast of Sweden Optical Coherence Tomography Revenues & Volume for the Period 2022 - 2032F
- Sweden Optical Coherence Tomography Market Trend Evolution
- Sweden Optical Coherence Tomography Market Drivers and Challenges
- Sweden Optical Coherence Tomography Price Trends
- Sweden Optical Coherence Tomography Porter's Five Forces
- Sweden Optical Coherence Tomography Industry Life Cycle
- Historical Data and Forecast of Sweden Optical Coherence Tomography Market Revenues & Volume By Type for the Period 2022 - 2032F
- Historical Data and Forecast of Sweden Optical Coherence Tomography Market Revenues & Volume By Time-Domain OCT for the Period 2022 - 2032F
- Historical Data and Forecast of Sweden Optical Coherence Tomography Market Revenues & Volume By Spectral-Domain OCT for the Period 2022 - 2032F
- Historical Data and Forecast of Sweden Optical Coherence Tomography Market Revenues & Volume By Swept-Source OCT for the Period 2022 - 2032F
- Historical Data and Forecast of Sweden Optical Coherence Tomography Market Revenues & Volume By Others for the Period 2022 - 2032F
- Historical Data and Forecast of Sweden Optical Coherence Tomography Market Revenues & Volume By Technology for the Period 2022 - 2032F
- Historical Data and Forecast of Sweden Optical Coherence Tomography Market Revenues & Volume By Spectral-Domain OCT for the Period 2022 - 2032F
- Historical Data and Forecast of Sweden Optical Coherence Tomography Market Revenues & Volume By Swept-Source OCT for the Period 2022 - 2032F
- Historical Data and Forecast of Sweden Optical Coherence Tomography Market Revenues & Volume By Polarization-Sensitive OCT for the Period 2022 - 2032F
- Historical Data and Forecast of Sweden Optical Coherence Tomography Market Revenues & Volume By Others for the Period 2022 - 2032F
- Historical Data and Forecast of Sweden Optical Coherence Tomography Market Revenues & Volume By Application for the Period 2022 - 2032F
- Historical Data and Forecast of Sweden Optical Coherence Tomography Market Revenues & Volume By Ophthalmology for the Period 2022 - 2032F
- Historical Data and Forecast of Sweden Optical Coherence Tomography Market Revenues & Volume By Cardiovascular Imaging for the Period 2022 - 2032F
- Historical Data and Forecast of Sweden Optical Coherence Tomography Market Revenues & Volume By Dermatology for the Period 2022 - 2032F
- Historical Data and Forecast of Sweden Optical Coherence Tomography Market Revenues & Volume By Oncology for the Period 2022 - 2032F
- Historical Data and Forecast of Sweden Optical Coherence Tomography Market Revenues & Volume By End User for the Period 2022 - 2032F
- Historical Data and Forecast of Sweden Optical Coherence Tomography Market Revenues & Volume By Hospitals for the Period 2022 - 2032F
- Historical Data and Forecast of Sweden Optical Coherence Tomography Market Revenues & Volume By Specialty Clinics for the Period 2022 - 2032F
- Historical Data and Forecast of Sweden Optical Coherence Tomography Market Revenues & Volume By Research Institutes for the Period 2022 - 2032F
- Historical Data and Forecast of Sweden Optical Coherence Tomography Market Revenues & Volume By Diagnostic Centers for the Period 2022 - 2032F
- Sweden Optical Coherence Tomography Import Export Trade Statistics
- Market Opportunity Assessment By Type
- Market Opportunity Assessment By Technology
- Market Opportunity Assessment By Application
- Market Opportunity Assessment By End User
- Sweden Optical Coherence Tomography Top Companies Market Share
- Sweden Optical Coherence Tomography Competitive Benchmarking By Technical and Operational Parameters
- Sweden Optical Coherence Tomography Company Profiles
- Sweden Optical Coherence Tomography Key Strategic Recommendations
Frequently Asked Questions About the Market Study (FAQs):
6Wresearch actively monitors the Sweden Optical Coherence Tomography Market and publishes its comprehensive annual report, highlighting emerging trends, growth drivers, revenue analysis, and forecast outlook. Our insights help businesses to make data-backed strategic decisions with ongoing market dynamics. Our analysts track relevent industries related to the Sweden Optical Coherence Tomography Market, allowing our clients with actionable intelligence and reliable forecasts tailored to emerging regional needs.
Yes, we provide customisation as per your requirements. To learn more, feel free to contact us on sales@6wresearch.com
1 Executive Summary |
2 Introduction |
2.1 Key Highlights of the Report |
2.2 Report Description |
2.3 Market Scope & Segmentation |
2.4 Research Methodology |
2.5 Assumptions |
3 Sweden Optical Coherence Tomography Market Overview |
3.1 Sweden Country Macro Economic Indicators |
3.2 Sweden Optical Coherence Tomography Market Revenues & Volume, 2022 & 2032F |
3.3 Sweden Optical Coherence Tomography Market - Industry Life Cycle |
3.4 Sweden Optical Coherence Tomography Market - Porter's Five Forces |
3.5 Sweden Optical Coherence Tomography Market Revenues & Volume Share, By Type, 2022 & 2032F |
3.6 Sweden Optical Coherence Tomography Market Revenues & Volume Share, By Technology, 2022 & 2032F |
3.7 Sweden Optical Coherence Tomography Market Revenues & Volume Share, By Application, 2022 & 2032F |
3.8 Sweden Optical Coherence Tomography Market Revenues & Volume Share, By End User, 2022 & 2032F |
4 Sweden Optical Coherence Tomography Market Dynamics |
4.1 Impact Analysis |
4.2 Market Drivers |
4.2.1 Increasing prevalence of eye diseases and disorders in Sweden |
4.2.2 Technological advancements in optical coherence tomography (OCT) systems |
4.2.3 Growing demand for minimally invasive diagnostic procedures |
4.3 Market Restraints |
4.3.1 High cost associated with OCT equipment and procedures |
4.3.2 Limited reimbursement policies for OCT scans in Sweden |
4.3.3 Lack of skilled professionals to operate and interpret OCT results |
5 Sweden Optical Coherence Tomography Market Trends |
6 Sweden Optical Coherence Tomography Market, By Types |
6.1 Sweden Optical Coherence Tomography Market, By Type |
6.1.1 Overview and Analysis |
6.1.2 Sweden Optical Coherence Tomography Market Revenues & Volume, By Type, 2022 - 2032F |
6.1.3 Sweden Optical Coherence Tomography Market Revenues & Volume, By Time-Domain OCT, 2022 - 2032F |
6.1.4 Sweden Optical Coherence Tomography Market Revenues & Volume, By Spectral-Domain OCT, 2022 - 2032F |
6.1.5 Sweden Optical Coherence Tomography Market Revenues & Volume, By Swept-Source OCT, 2022 - 2032F |
6.1.6 Sweden Optical Coherence Tomography Market Revenues & Volume, By Others, 2022 - 2032F |
6.2 Sweden Optical Coherence Tomography Market, By Technology |
6.2.1 Overview and Analysis |
6.2.2 Sweden Optical Coherence Tomography Market Revenues & Volume, By Spectral-Domain OCT, 2022 - 2032F |
6.2.3 Sweden Optical Coherence Tomography Market Revenues & Volume, By Swept-Source OCT, 2022 - 2032F |
6.2.4 Sweden Optical Coherence Tomography Market Revenues & Volume, By Polarization-Sensitive OCT, 2022 - 2032F |
6.2.5 Sweden Optical Coherence Tomography Market Revenues & Volume, By Others, 2022 - 2032F |
6.3 Sweden Optical Coherence Tomography Market, By Application |
6.3.1 Overview and Analysis |
6.3.2 Sweden Optical Coherence Tomography Market Revenues & Volume, By Ophthalmology, 2022 - 2032F |
6.3.3 Sweden Optical Coherence Tomography Market Revenues & Volume, By Cardiovascular Imaging, 2022 - 2032F |
6.3.4 Sweden Optical Coherence Tomography Market Revenues & Volume, By Dermatology, 2022 - 2032F |
6.3.5 Sweden Optical Coherence Tomography Market Revenues & Volume, By Oncology, 2022 - 2032F |
6.4 Sweden Optical Coherence Tomography Market, By End User |
6.4.1 Overview and Analysis |
6.4.2 Sweden Optical Coherence Tomography Market Revenues & Volume, By Hospitals, 2022 - 2032F |
6.4.3 Sweden Optical Coherence Tomography Market Revenues & Volume, By Specialty Clinics, 2022 - 2032F |
6.4.4 Sweden Optical Coherence Tomography Market Revenues & Volume, By Research Institutes, 2022 - 2032F |
6.4.5 Sweden Optical Coherence Tomography Market Revenues & Volume, By Diagnostic Centers, 2022 - 2032F |
7 Sweden Optical Coherence Tomography Market Import-Export Trade Statistics |
7.1 Sweden Optical Coherence Tomography Market Export to Major Countries |
7.2 Sweden Optical Coherence Tomography Market Imports from Major Countries |
8 Sweden Optical Coherence Tomography Market Key Performance Indicators |
8.1 Adoption rate of OCT technology in Swedish healthcare facilities |
8.2 Number of research and development initiatives focused on enhancing OCT technology |
8.3 Patient satisfaction scores related to OCT diagnostic accuracy and efficiency |
9 Sweden Optical Coherence Tomography Market - Opportunity Assessment |
9.1 Sweden Optical Coherence Tomography Market Opportunity Assessment, By Type, 2022 & 2032F |
9.2 Sweden Optical Coherence Tomography Market Opportunity Assessment, By Technology, 2022 & 2032F |
9.3 Sweden Optical Coherence Tomography Market Opportunity Assessment, By Application, 2022 & 2032F |
9.4 Sweden Optical Coherence Tomography Market Opportunity Assessment, By End User, 2022 & 2032F |
10 Sweden Optical Coherence Tomography Market - Competitive Landscape |
10.1 Sweden Optical Coherence Tomography Market Revenue Share, By Companies, 2025 |
10.2 Sweden Optical Coherence Tomography Market Competitive Benchmarking, By Operating and Technical Parameters |
11 Company Profiles |
12 Recommendations |
13 Disclaimer |
Global Go To Market Strategy - 2030
Export potential enables firms to identify high-growth global markets with greater confidence by combining advanced trade intelligence with a structured quantitative methodology. The framework analyzes emerging demand trends and country-level import patterns while integrating macroeconomic and trade datasets such as GDP and population forecasts, bilateral import–export flows, tariff structures, elasticity differentials between developed and developing economies, geographic distance, and import demand projections. Using weighted trade values from 2020–2024 as the base period to project country-to-country export potential for 2030, these inputs are operationalized through calculated drivers such as gravity model parameters, tariff impact factors, and projected GDP per-capita growth. Through an analysis of hidden potentials, demand hotspots, and market conditions that are most favorable to success, this method enables firms to focus on target countries, maximize returns, and global expansion with data, backed by accuracy.
By factoring in the projected importer demand gap that is currently unmet and could be potential opportunity, it identifies the potential for the Exporter (Country) among 190 countries, against the general trade analysis, which identifies the biggest importer or exporter.
To discover high-growth global markets and optimize your business strategy:
Click Here
Pricing
- Single User License$ 1,995
- Department License$ 2,400
- Site License$ 3,120
- Global License$ 3,795

Leadership Perspectives from Industry Events
Search
Thought Leadership and Analyst Meet


Our Clients
6WResearch In News
- Doha a strategic location for EV manufacturing hub: IPA Qatar
- Demand for luxury TVs surging in the GCC, says Samsung
- Empowering Growth: The Thriving Journey of Bangladesh’s Cable Industry
- Demand for luxury TVs surging in the GCC, says Samsung
- Video call with a traditional healer? Once unthinkable, it’s now common in South Africa
- Intelligent Buildings To Smooth GCC’s Path To Net Zero
Latest Reports
- New Zealand Aseptic Manufacturing Market (2026-2032)
- Netherlands Aseptic Manufacturing Market (2026-2032)
- Nauru Aseptic Manufacturing Market (2026-2032)
- Namibia Aseptic Manufacturing Market (2026-2032)
- Mozambique Aseptic Manufacturing Market (2026-2032)
- Montenegro Aseptic Manufacturing Market (2026-2032)
- Mongolia Aseptic Manufacturing Market (2026-2032)
- Monaco Aseptic Manufacturing Market (2026-2032)
- Micronesia Aseptic Manufacturing Market (2026-2032)
- Mauritius Aseptic Manufacturing Market (2026-2032)
Industry Events and Analyst Meet

HIMTEX 2026

India Refining Summit 2026

India EV Show 2026

EV tech India Expo 2026

Auto Tech Asia 2026
Whitepaper
- Middle East & Africa Commercial Security Market Click here to view more.
- Middle East & Africa Fire Safety Systems & Equipment Market Click here to view more.
- GCC Drone Market Click here to view more.
- Middle East Lighting Fixture Market Click here to view more.
- GCC Physical & Perimeter Security Market Click here to view more.