Sweden Ricinoleic Acid Market (2026-2032) | Strategy, Trends, Drivers, Supply, Industry, Revenue, Companies, Strategic Insights, Segmentation, Consumer Insights, Forecast, Demand, Competitive, Opportunities, Challenges, Investment Trends, Analysis, Value, Competition, Restraints, Growth, Segments, Outlook, Share, Pricing Analysis, Size
Market Forecast By Type (Hydrogenated, Sulfated, Esterified, Polymerized, Derivatives), By Source (Castor Oil, Natural Oils, Synthetic, Vegetable-Based, Industrial Grade), By Application (Surfactants, Lubricants, Coatings, Bio-Based Plastics, Paints & Inks), By End-Use (Pharmaceuticals, Cosmetics, Chemicals, Food & Beverage, Automotive) And Competitive Landscape
| Product Code: ETC10448491 | Publication Date: Apr 2025 | Updated Date: Apr 2026 | Product Type: Market Research Report | |
| Publisher: 6Wresearch | Author: Bhawna Singh | No. of Pages: 65 | No. of Figures: 34 | No. of Tables: 19 |
Sweden Ricinoleic Acid Market Size (2020-2030)
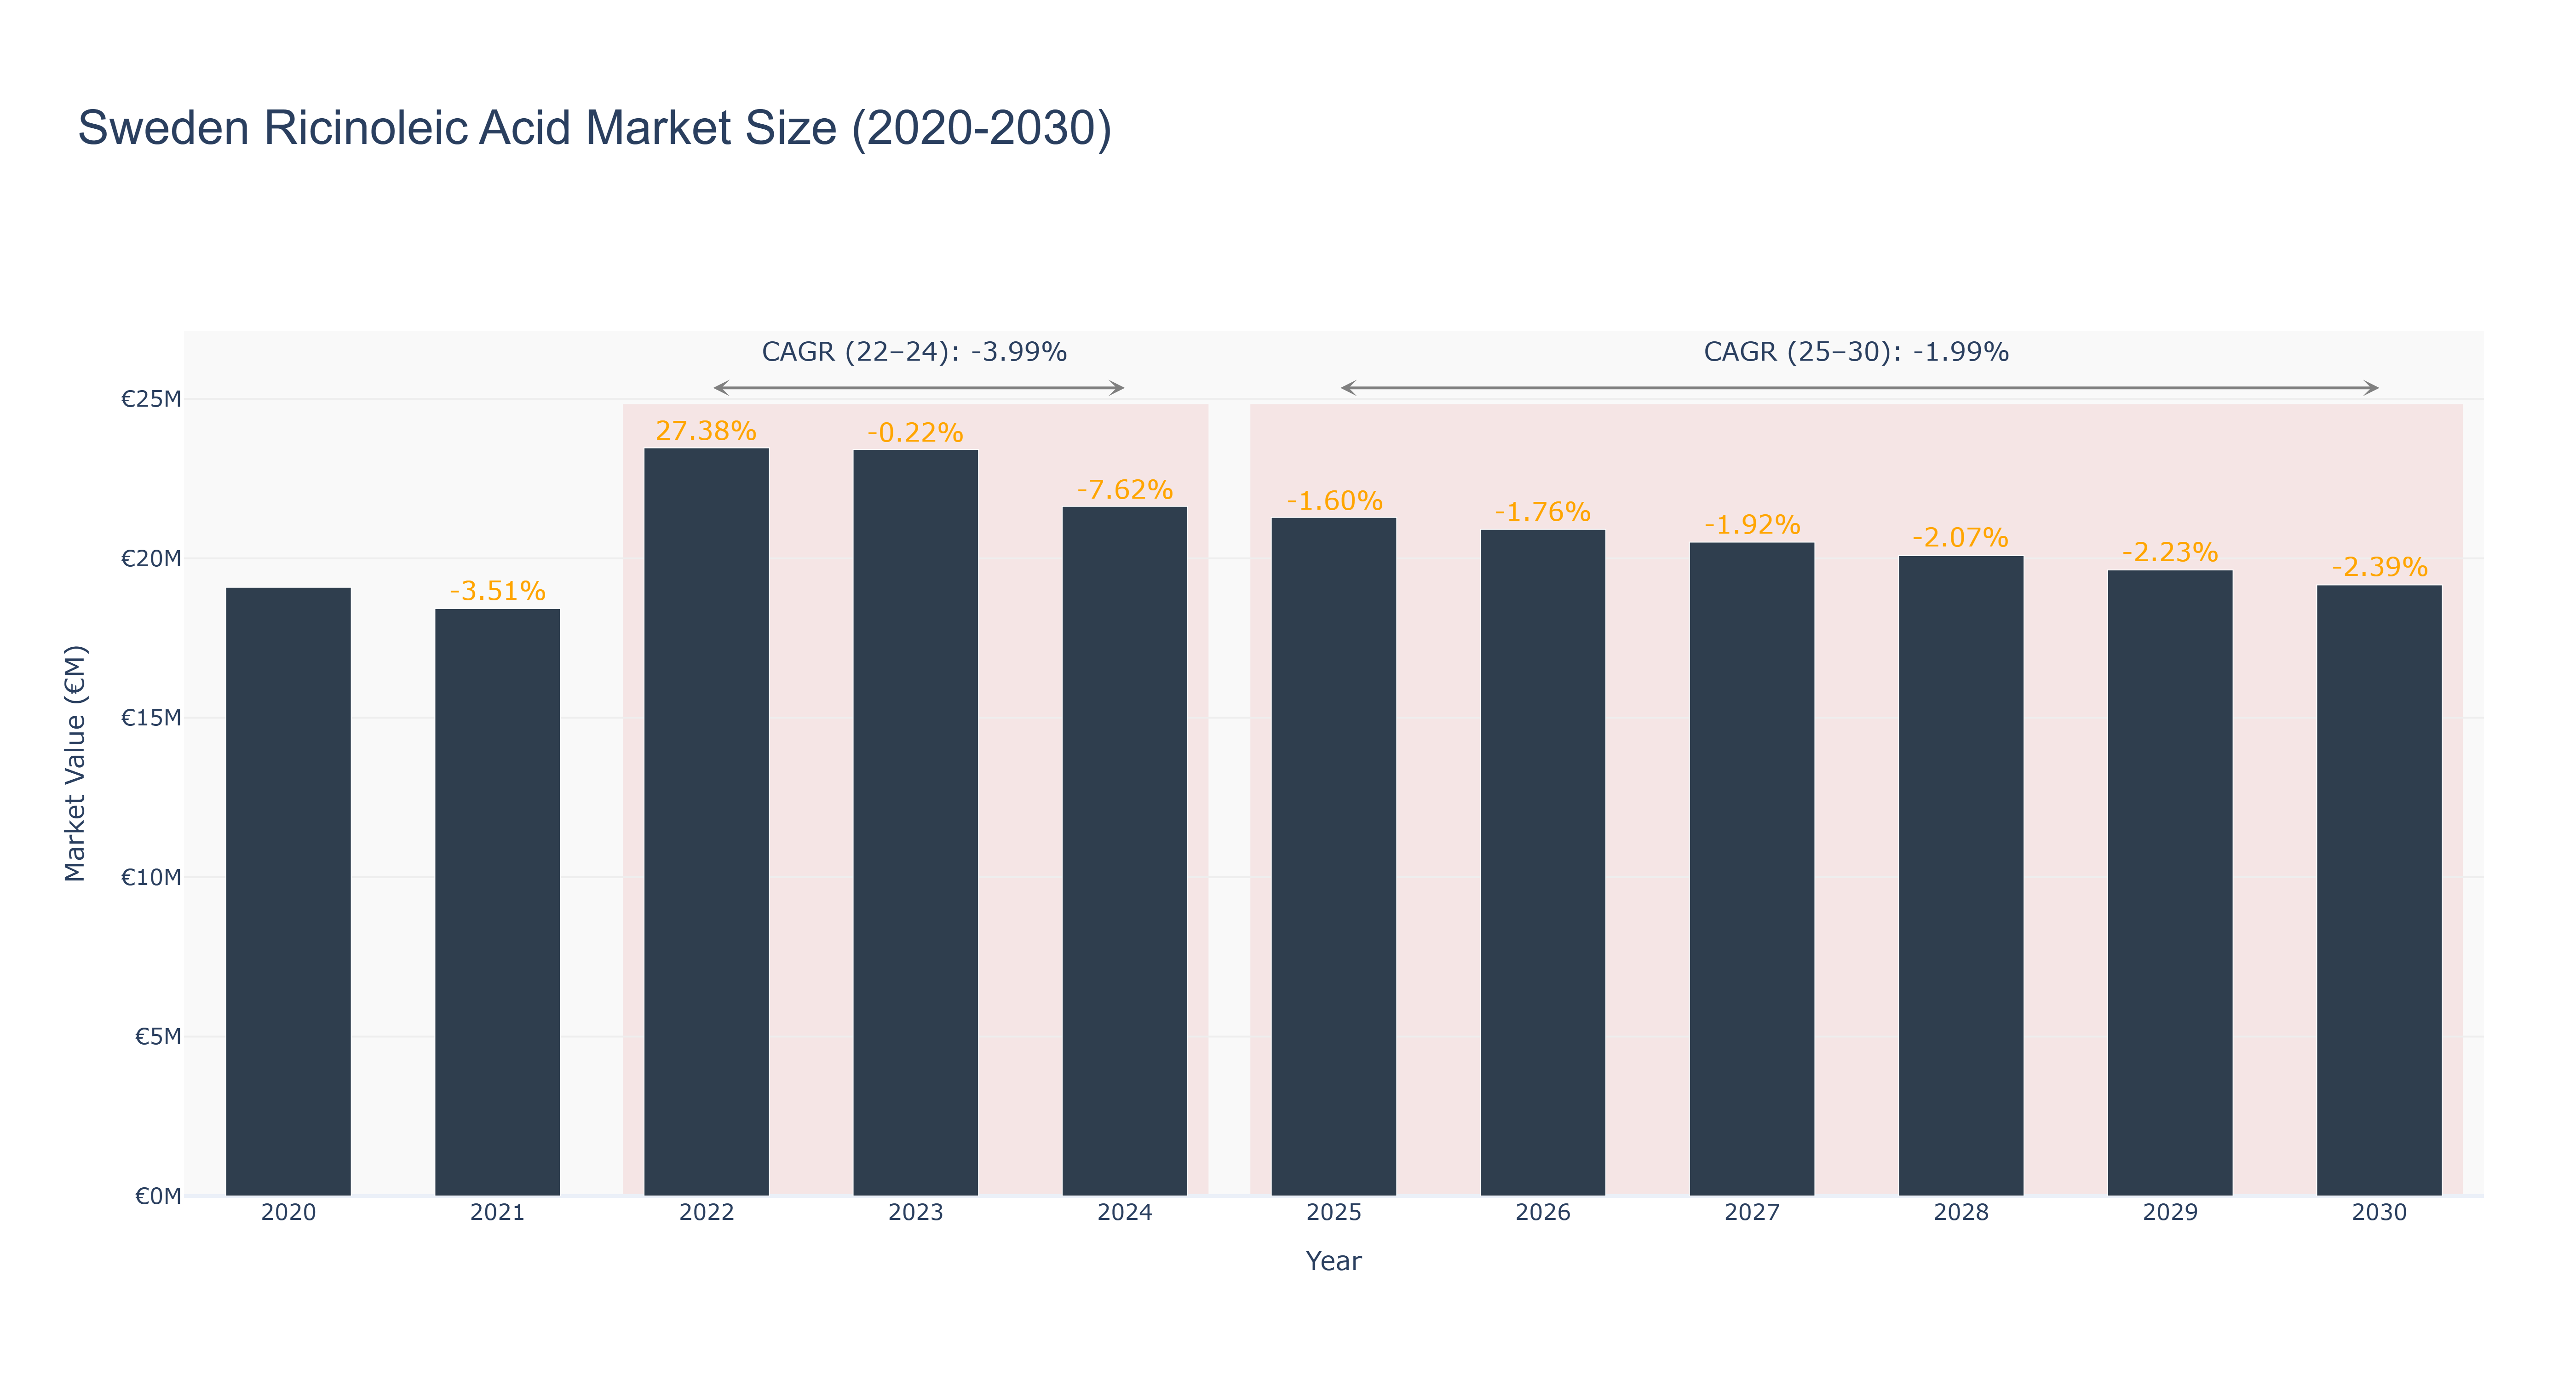
Sweden Ricinoleic Acid Market has seen fluctuations in market size over the years. The peak market size was €23.47 million in 2022, with a subsequent decline to €21.63 million in 2024. Forecasted market size shows a continuing downward trend, with an expected size of €19.17 million in 2030. The CAGR for the period 2022-24 was -3.99%, while for 2025-30 it is projected to be -1.99%. The market experienced a growth spike in 2022 due to increased demand for ricinoleic acid in various industries. The subsequent decline can be attributed to market saturation and competitive pressures. Looking ahead, Sweden is set to invest in sustainable production methods for ricinoleic acid, aiming to enhance market competitiveness and meet growing environmental regulations. Industry drivers include the demand for eco-friendly products and the expanding applications of ricinoleic acid in cosmetics and pharmaceuticals.
Sweden Ricinoleic Acid Market: Production & Trade Performance (2019-2025)
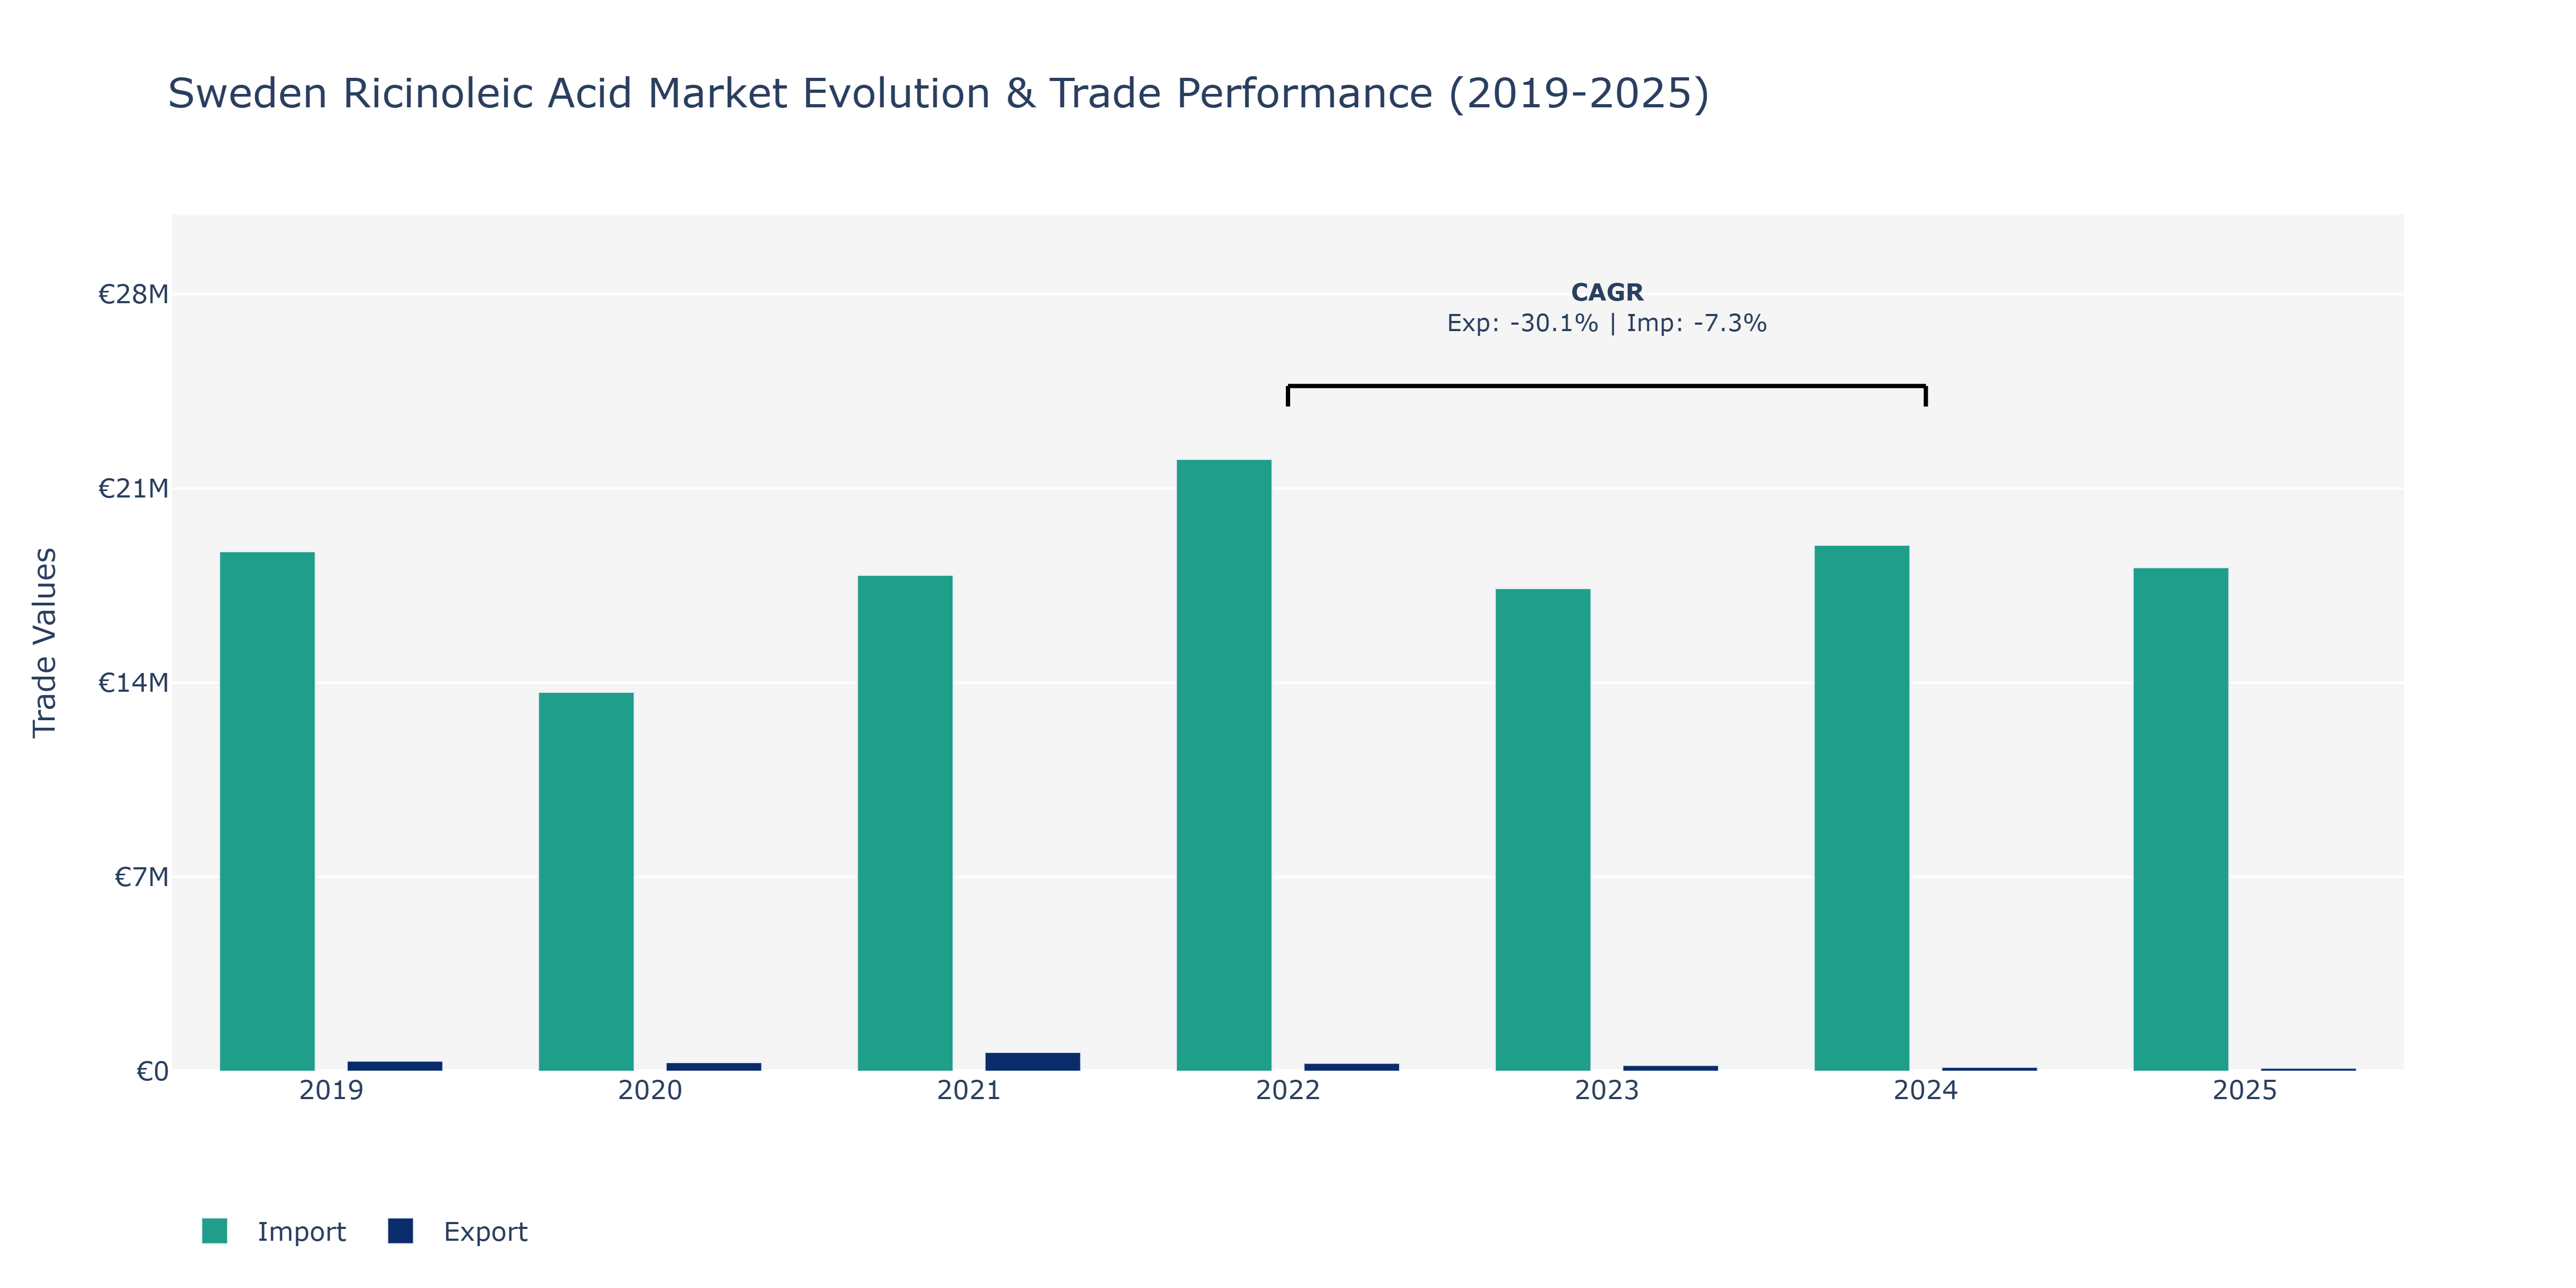
Between 2019 and 2025, the Sweden Ricinoleic Acid Market witnessed varying trends in exports and imports. Exports saw a notable decline from €360.42 thousand in 2019 to €107.34 thousand in 2025. This sharp decrease can be attributed to factors such as fluctuating global demand, changes in production capacity, and evolving trade policies impacting outbound shipments. Conversely, imports fluctuated over the period, reaching a peak of €22.05 million in 2022 before declining to €18.15 million in 2025. The dip in imports may be linked to shifts in sourcing strategies, price fluctuations of raw materials, and evolving supplier relationships within the market. The CAGR for exports from 2022 to 2024 stood at -30.13%, reflecting a challenging period for outbound trade, while imports experienced a milder CAGR of -7.29%. These dynamics suggest a complex interplay of domestic and international factors influencing the Sweden Ricinoleic Acid Market, necessitating strategic planning to navigate future uncertainties.
Key Highlights of the Report:
- Sweden Ricinoleic Acid Market Outlook
- Market Size of Sweden Ricinoleic Acid Market, 2025
- Forecast of Sweden Ricinoleic Acid Market, 2032
- Historical Data and Forecast of Sweden Ricinoleic Acid Revenues & Volume for the Period 2022 - 2032F
- Sweden Ricinoleic Acid Market Trend Evolution
- Sweden Ricinoleic Acid Market Drivers and Challenges
- Sweden Ricinoleic Acid Price Trends
- Sweden Ricinoleic Acid Porter's Five Forces
- Sweden Ricinoleic Acid Industry Life Cycle
- Historical Data and Forecast of Sweden Ricinoleic Acid Market Revenues & Volume By Type for the Period 2022 - 2032F
- Historical Data and Forecast of Sweden Ricinoleic Acid Market Revenues & Volume By Hydrogenated for the Period 2022 - 2032F
- Historical Data and Forecast of Sweden Ricinoleic Acid Market Revenues & Volume By Sulfated for the Period 2022 - 2032F
- Historical Data and Forecast of Sweden Ricinoleic Acid Market Revenues & Volume By Esterified for the Period 2022 - 2032F
- Historical Data and Forecast of Sweden Ricinoleic Acid Market Revenues & Volume By Polymerized for the Period 2022 - 2032F
- Historical Data and Forecast of Sweden Ricinoleic Acid Market Revenues & Volume By Derivatives for the Period 2022 - 2032F
- Historical Data and Forecast of Sweden Ricinoleic Acid Market Revenues & Volume By Source for the Period 2022 - 2032F
- Historical Data and Forecast of Sweden Ricinoleic Acid Market Revenues & Volume By Castor Oil for the Period 2022 - 2032F
- Historical Data and Forecast of Sweden Ricinoleic Acid Market Revenues & Volume By Natural Oils for the Period 2022 - 2032F
- Historical Data and Forecast of Sweden Ricinoleic Acid Market Revenues & Volume By Synthetic for the Period 2022 - 2032F
- Historical Data and Forecast of Sweden Ricinoleic Acid Market Revenues & Volume By Vegetable-Based for the Period 2022 - 2032F
- Historical Data and Forecast of Sweden Ricinoleic Acid Market Revenues & Volume By Industrial Grade for the Period 2022 - 2032F
- Historical Data and Forecast of Sweden Ricinoleic Acid Market Revenues & Volume By Application for the Period 2022 - 2032F
- Historical Data and Forecast of Sweden Ricinoleic Acid Market Revenues & Volume By Surfactants for the Period 2022 - 2032F
- Historical Data and Forecast of Sweden Ricinoleic Acid Market Revenues & Volume By Lubricants for the Period 2022 - 2032F
- Historical Data and Forecast of Sweden Ricinoleic Acid Market Revenues & Volume By Coatings for the Period 2022 - 2032F
- Historical Data and Forecast of Sweden Ricinoleic Acid Market Revenues & Volume By Bio-Based Plastics for the Period 2022 - 2032F
- Historical Data and Forecast of Sweden Ricinoleic Acid Market Revenues & Volume By Paints & Inks for the Period 2022 - 2032F
- Historical Data and Forecast of Sweden Ricinoleic Acid Market Revenues & Volume By End-Use for the Period 2022 - 2032F
- Historical Data and Forecast of Sweden Ricinoleic Acid Market Revenues & Volume By Pharmaceuticals for the Period 2022 - 2032F
- Historical Data and Forecast of Sweden Ricinoleic Acid Market Revenues & Volume By Cosmetics for the Period 2022 - 2032F
- Historical Data and Forecast of Sweden Ricinoleic Acid Market Revenues & Volume By Chemicals for the Period 2022 - 2032F
- Historical Data and Forecast of Sweden Ricinoleic Acid Market Revenues & Volume By Food & Beverage for the Period 2022 - 2032F
- Historical Data and Forecast of Sweden Ricinoleic Acid Market Revenues & Volume By Automotive for the Period 2022 - 2032F
- Sweden Ricinoleic Acid Import Export Trade Statistics
- Market Opportunity Assessment By Type
- Market Opportunity Assessment By Source
- Market Opportunity Assessment By Application
- Market Opportunity Assessment By End-Use
- Sweden Ricinoleic Acid Top Companies Market Share
- Sweden Ricinoleic Acid Competitive Benchmarking By Technical and Operational Parameters
- Sweden Ricinoleic Acid Company Profiles
- Sweden Ricinoleic Acid Key Strategic Recommendations
Frequently Asked Questions About the Market Study (FAQs):
6Wresearch actively monitors the Sweden Ricinoleic Acid Market and publishes its comprehensive annual report, highlighting emerging trends, growth drivers, revenue analysis, and forecast outlook. Our insights help businesses to make data-backed strategic decisions with ongoing market dynamics. Our analysts track relevent industries related to the Sweden Ricinoleic Acid Market, allowing our clients with actionable intelligence and reliable forecasts tailored to emerging regional needs.
Yes, we provide customisation as per your requirements. To learn more, feel free to contact us on sales@6wresearch.com
1 Executive Summary |
2 Introduction |
2.1 Key Highlights of the Report |
2.2 Report Description |
2.3 Market Scope & Segmentation |
2.4 Research Methodology |
2.5 Assumptions |
3 Sweden Ricinoleic Acid Market Overview |
3.1 Sweden Country Macro Economic Indicators |
3.2 Sweden Ricinoleic Acid Market Revenues & Volume, 2022 & 2032F |
3.3 Sweden Ricinoleic Acid Market - Industry Life Cycle |
3.4 Sweden Ricinoleic Acid Market - Porter's Five Forces |
3.5 Sweden Ricinoleic Acid Market Revenues & Volume Share, By Type, 2022 & 2032F |
3.6 Sweden Ricinoleic Acid Market Revenues & Volume Share, By Source, 2022 & 2032F |
3.7 Sweden Ricinoleic Acid Market Revenues & Volume Share, By Application, 2022 & 2032F |
3.8 Sweden Ricinoleic Acid Market Revenues & Volume Share, By End-Use, 2022 & 2032F |
4 Sweden Ricinoleic Acid Market Dynamics |
4.1 Impact Analysis |
4.2 Market Drivers |
4.2.1 Increasing demand for natural and organic products in the personal care and cosmetics industry |
4.2.2 Growing awareness about the benefits of ricinoleic acid in various applications such as pharmaceuticals, lubricants, and agriculture |
4.2.3 Government initiatives promoting the use of bio-based products and sustainable sourcing practices |
4.3 Market Restraints |
4.3.1 Price volatility of castor oil, from which ricinoleic acid is derived, impacting the overall cost of production |
4.3.2 Limited availability of castor bean cultivation in Sweden, leading to dependence on imports for raw materials |
4.3.3 Regulatory challenges related to the production and marketing of bio-based products in the region |
5 Sweden Ricinoleic Acid Market Trends |
6 Sweden Ricinoleic Acid Market, By Types |
6.1 Sweden Ricinoleic Acid Market, By Type |
6.1.1 Overview and Analysis |
6.1.2 Sweden Ricinoleic Acid Market Revenues & Volume, By Type, 2022 - 2032F |
6.1.3 Sweden Ricinoleic Acid Market Revenues & Volume, By Hydrogenated, 2022 - 2032F |
6.1.4 Sweden Ricinoleic Acid Market Revenues & Volume, By Sulfated, 2022 - 2032F |
6.1.5 Sweden Ricinoleic Acid Market Revenues & Volume, By Esterified, 2022 - 2032F |
6.1.6 Sweden Ricinoleic Acid Market Revenues & Volume, By Polymerized, 2022 - 2032F |
6.1.7 Sweden Ricinoleic Acid Market Revenues & Volume, By Derivatives, 2022 - 2032F |
6.2 Sweden Ricinoleic Acid Market, By Source |
6.2.1 Overview and Analysis |
6.2.2 Sweden Ricinoleic Acid Market Revenues & Volume, By Castor Oil, 2022 - 2032F |
6.2.3 Sweden Ricinoleic Acid Market Revenues & Volume, By Natural Oils, 2022 - 2032F |
6.2.4 Sweden Ricinoleic Acid Market Revenues & Volume, By Synthetic, 2022 - 2032F |
6.2.5 Sweden Ricinoleic Acid Market Revenues & Volume, By Vegetable-Based, 2022 - 2032F |
6.2.6 Sweden Ricinoleic Acid Market Revenues & Volume, By Industrial Grade, 2022 - 2032F |
6.3 Sweden Ricinoleic Acid Market, By Application |
6.3.1 Overview and Analysis |
6.3.2 Sweden Ricinoleic Acid Market Revenues & Volume, By Surfactants, 2022 - 2032F |
6.3.3 Sweden Ricinoleic Acid Market Revenues & Volume, By Lubricants, 2022 - 2032F |
6.3.4 Sweden Ricinoleic Acid Market Revenues & Volume, By Coatings, 2022 - 2032F |
6.3.5 Sweden Ricinoleic Acid Market Revenues & Volume, By Bio-Based Plastics, 2022 - 2032F |
6.3.6 Sweden Ricinoleic Acid Market Revenues & Volume, By Paints & Inks, 2022 - 2032F |
6.4 Sweden Ricinoleic Acid Market, By End-Use |
6.4.1 Overview and Analysis |
6.4.2 Sweden Ricinoleic Acid Market Revenues & Volume, By Pharmaceuticals, 2022 - 2032F |
6.4.3 Sweden Ricinoleic Acid Market Revenues & Volume, By Cosmetics, 2022 - 2032F |
6.4.4 Sweden Ricinoleic Acid Market Revenues & Volume, By Chemicals, 2022 - 2032F |
6.4.5 Sweden Ricinoleic Acid Market Revenues & Volume, By Food & Beverage, 2022 - 2032F |
6.4.6 Sweden Ricinoleic Acid Market Revenues & Volume, By Automotive, 2022 - 2032F |
7 Sweden Ricinoleic Acid Market Import-Export Trade Statistics |
7.1 Sweden Ricinoleic Acid Market Export to Major Countries |
7.2 Sweden Ricinoleic Acid Market Imports from Major Countries |
8 Sweden Ricinoleic Acid Market Key Performance Indicators |
8.1 Sustainability certifications obtained by ricinoleic acid manufacturers |
8.2 Research and development investments in innovative applications of ricinoleic acid |
8.3 Adoption rate of ricinoleic acid in new industries and product formulations |
9 Sweden Ricinoleic Acid Market - Opportunity Assessment |
9.1 Sweden Ricinoleic Acid Market Opportunity Assessment, By Type, 2022 & 2032F |
9.2 Sweden Ricinoleic Acid Market Opportunity Assessment, By Source, 2022 & 2032F |
9.3 Sweden Ricinoleic Acid Market Opportunity Assessment, By Application, 2022 & 2032F |
9.4 Sweden Ricinoleic Acid Market Opportunity Assessment, By End-Use, 2022 & 2032F |
10 Sweden Ricinoleic Acid Market - Competitive Landscape |
10.1 Sweden Ricinoleic Acid Market Revenue Share, By Companies, 2025 |
10.2 Sweden Ricinoleic Acid Market Competitive Benchmarking, By Operating and Technical Parameters |
11 Company Profiles |
12 Recommendations |
13 Disclaimer |
Export potential assessment - trade Analytics for 2030
Export potential enables firms to identify high-growth global markets with greater confidence by combining advanced trade intelligence with a structured quantitative methodology. The framework analyzes emerging demand trends and country-level import patterns while integrating macroeconomic and trade datasets such as GDP and population forecasts, bilateral import–export flows, tariff structures, elasticity differentials between developed and developing economies, geographic distance, and import demand projections. Using weighted trade values from 2020–2024 as the base period to project country-to-country export potential for 2030, these inputs are operationalized through calculated drivers such as gravity model parameters, tariff impact factors, and projected GDP per-capita growth. Through an analysis of hidden potentials, demand hotspots, and market conditions that are most favorable to success, this method enables firms to focus on target countries, maximize returns, and global expansion with data, backed by accuracy.
By factoring in the projected importer demand gap that is currently unmet and could be potential opportunity, it identifies the potential for the Exporter (Country) among 190 countries, against the general trade analysis, which identifies the biggest importer or exporter.
To discover high-growth global markets and optimize your business strategy:
Click Here
Pricing
- Single User License$ 1,995
- Department License$ 2,400
- Site License$ 3,120
- Global License$ 3,795

Thought Leadership
Search
Thought Leadership and Analyst Meet


Our Clients
Latest Reports
- New Zealand Aseptic Manufacturing Market (2026-2032)
- Netherlands Aseptic Manufacturing Market (2026-2032)
- Nauru Aseptic Manufacturing Market (2026-2032)
- Namibia Aseptic Manufacturing Market (2026-2032)
- Mozambique Aseptic Manufacturing Market (2026-2032)
- Montenegro Aseptic Manufacturing Market (2026-2032)
- Mongolia Aseptic Manufacturing Market (2026-2032)
- Monaco Aseptic Manufacturing Market (2026-2032)
- Micronesia Aseptic Manufacturing Market (2026-2032)
- Mauritius Aseptic Manufacturing Market (2026-2032)
Industry Events and Analyst Meet

HIMTEX 2026

India Refining Summit 2026

India EV Show 2026

EV tech India Expo 2026

Auto Tech Asia 2026
Whitepaper
- Middle East & Africa Commercial Security Market Click here to view more.
- Middle East & Africa Fire Safety Systems & Equipment Market Click here to view more.
- GCC Drone Market Click here to view more.
- Middle East Lighting Fixture Market Click here to view more.
- GCC Physical & Perimeter Security Market Click here to view more.
6WResearch In News
- Doha a strategic location for EV manufacturing hub: IPA Qatar
- Demand for luxury TVs surging in the GCC, says Samsung
- Empowering Growth: The Thriving Journey of Bangladesh’s Cable Industry
- Demand for luxury TVs surging in the GCC, says Samsung
- Video call with a traditional healer? Once unthinkable, it’s now common in South Africa
- Intelligent Buildings To Smooth GCC’s Path To Net Zero