Tanzania Cobalt sulphate Market (2025-2031) | Trends, Companies, Growth, Share, Segmentation, Revenue, Industry, Value, Analysis, Size, Outlook & Forecast
Market Forecast By Type (Battery, Pigment), By Application (Super Alloy, Hard Facing/ HSS & Other Alloy, Magnet, Hard Material, Catalyst, Color, Battery, Others) And Competitive Landscape
| Product Code: ETC4762982 | Publication Date: Nov 2023 | Updated Date: Sep 2025 | Product Type: Market Research Report | |
| Publisher: 6Wresearch | Author: Sachin Kumar Rai | No. of Pages: 60 | No. of Figures: 30 | No. of Tables: 5 |
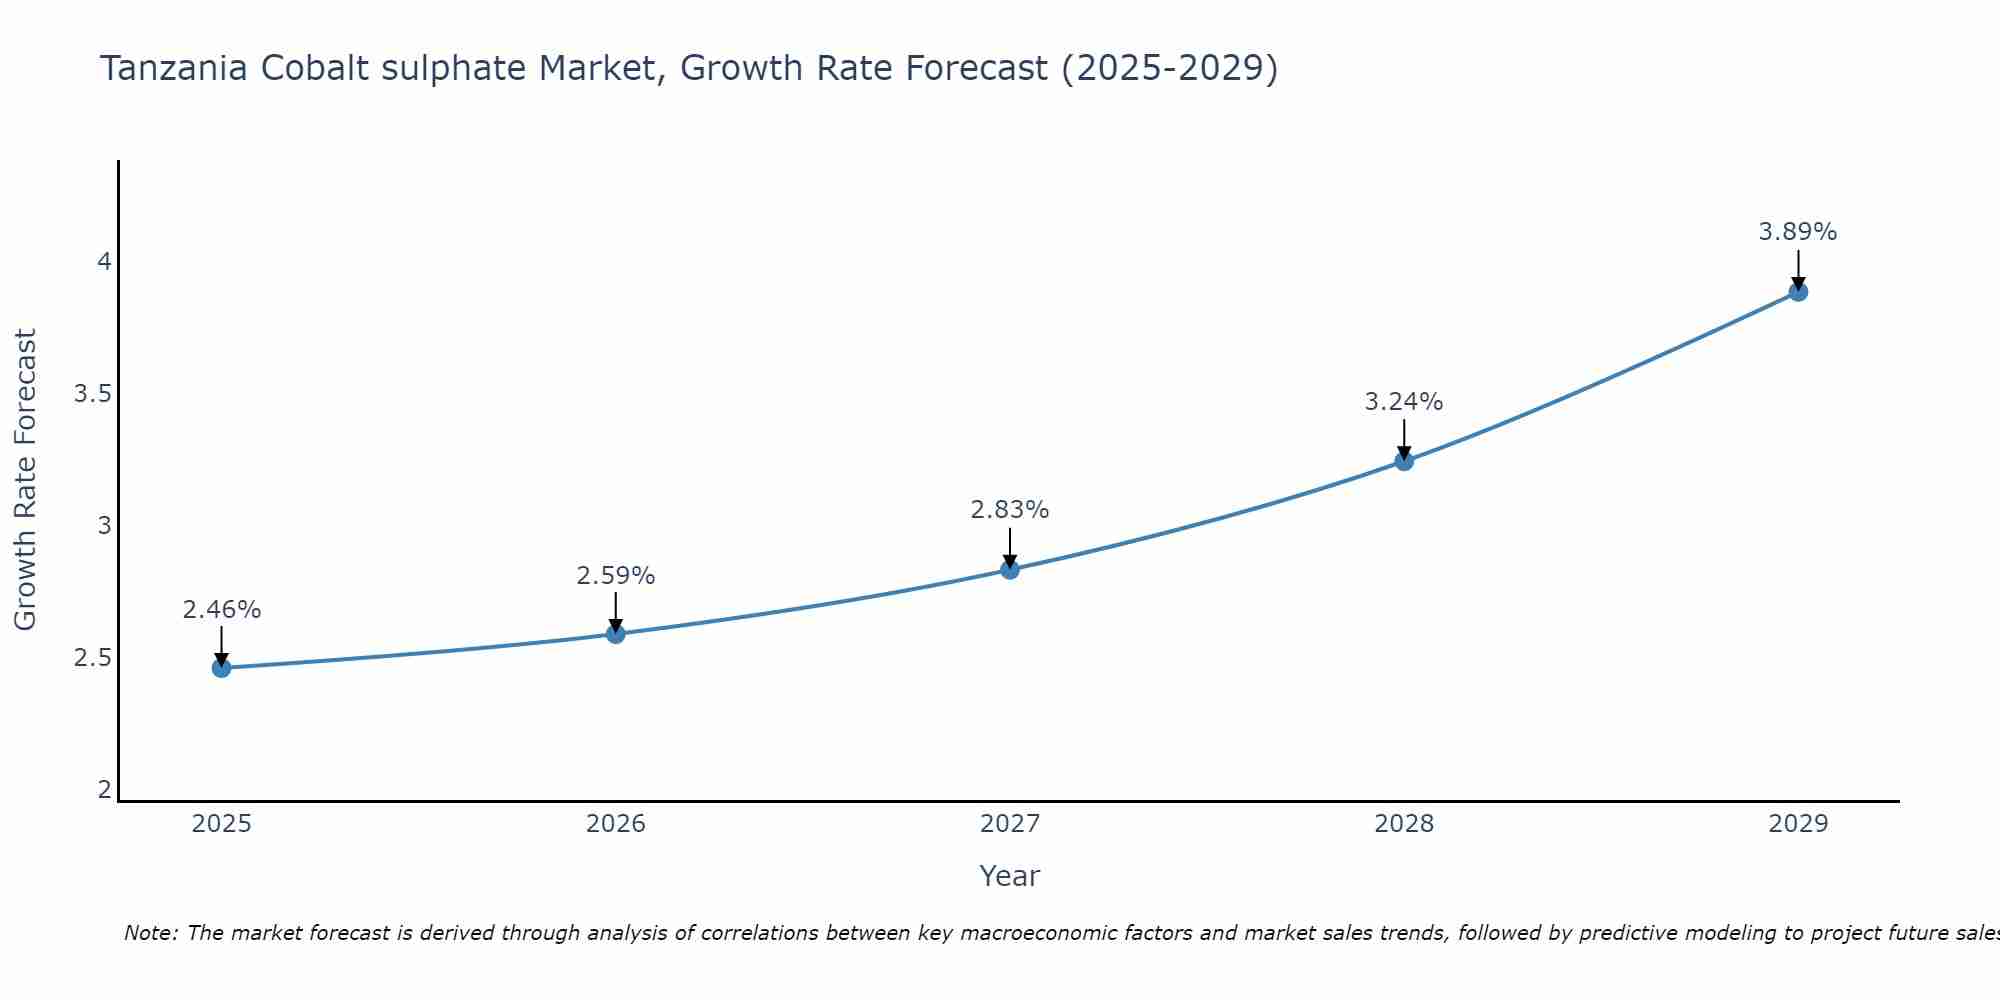
Tanzania Cobalt sulphate Market Size Growth Rate
The Tanzania Cobalt sulphate Market is likely to experience consistent growth rate gains over the period 2025 to 2029. From 2.46% in 2025, the growth rate steadily ascends to 3.89% in 2029.
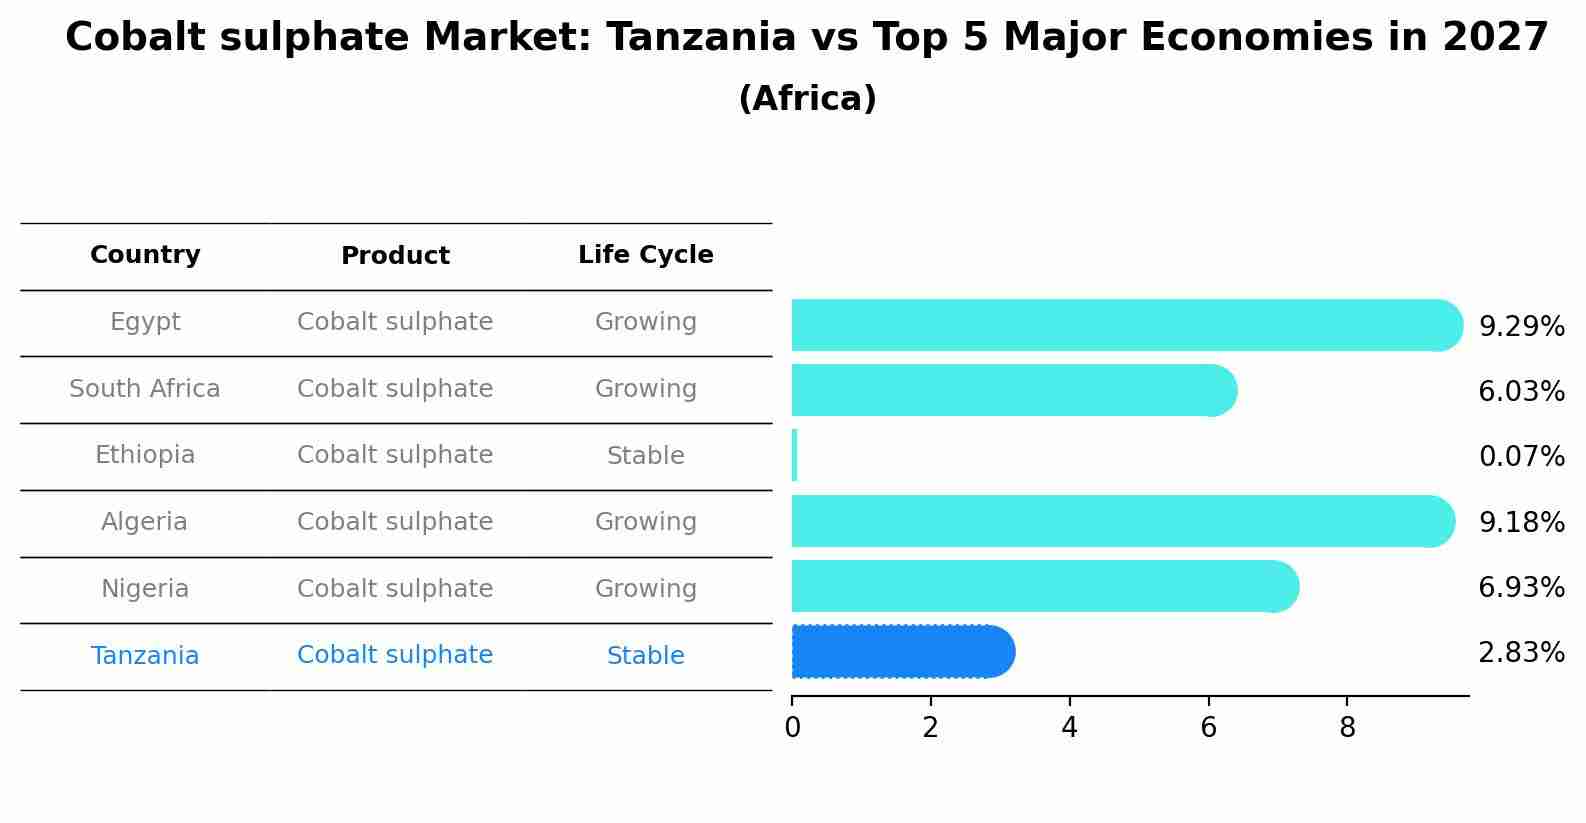
Cobalt sulphate Market: Tanzania vs Top 5 Major Economies in 2027 (Africa)
By 2027, the Cobalt sulphate market in Tanzania is anticipated to reach a growth rate of 2.83%, as part of an increasingly competitive Africa region, where Egypt remains at the forefront, supported by South Africa, Ethiopia, Algeria and Nigeria, driving innovations and market adoption across sectors.
Tanzania Cobalt sulphate Market Overview
Similar to cobalt sulfate, the Tanzania cobalt sulphate market caters to global demand for refined cobalt products. Factors such as mining regulations, environmental policies, and technological advancements impact market dynamics.
Drivers of the market
In Tanzania, the Cobalt Sulphate market is experiencing growth driven by its extensive use in lithium-ion battery production. Cobalt sulfate is essential for stabilizing battery performance and enhancing energy storage capacity, making it indispensable for electric vehicles and portable electronic devices. The market is also influenced by increasing investments in renewable energy storage solutions, where cobalt sulfate plays a critical role. Additionally, advancements in cobalt sulfate production processes and sustainable mining practices contribute to its market sustainability and growth.
Challenges of the market
The Tanzania Cobalt Sulphate market encounters challenges related to competitive pricing against global suppliers and fluctuating demand from downstream industries. Market players must navigate regulatory complexities and ensure compliance with stringent quality standards. Additionally, optimizing production efficiency and managing logistics amidst infrastructure limitations remain pivotal for sustained market growth.
Government Policy of the market
Tanzania regulates the production and export of cobalt sulfate to ensure compliance with environmental standards and to maximize local economic benefits. Government policies may include licensing requirements, environmental impact assessments, and export quotas to manage resources sustainably.
Key Highlights of the Report:
- Tanzania Cobalt sulphate Market Outlook
- Market Size of Tanzania Cobalt sulphate Market, 2024
- Forecast of Tanzania Cobalt sulphate Market, 2031
- Historical Data and Forecast of Tanzania Cobalt sulphate Revenues & Volume for the Period 2021-2031
- Tanzania Cobalt sulphate Market Trend Evolution
- Tanzania Cobalt sulphate Market Drivers and Challenges
- Tanzania Cobalt sulphate Price Trends
- Tanzania Cobalt sulphate Porter`s Five Forces
- Tanzania Cobalt sulphate Industry Life Cycle
- Historical Data and Forecast of Tanzania Cobalt sulphate Market Revenues & Volume By Type for the Period 2021-2031
- Historical Data and Forecast of Tanzania Cobalt sulphate Market Revenues & Volume By Battery for the Period 2021-2031
- Historical Data and Forecast of Tanzania Cobalt sulphate Market Revenues & Volume By Pigment for the Period 2021-2031
- Historical Data and Forecast of Tanzania Cobalt sulphate Market Revenues & Volume By Application for the Period 2021-2031
- Historical Data and Forecast of Tanzania Cobalt sulphate Market Revenues & Volume By Super Alloy for the Period 2021-2031
- Historical Data and Forecast of Tanzania Cobalt sulphate Market Revenues & Volume By Hard Facing/ HSS & Other Alloy for the Period 2021-2031
- Historical Data and Forecast of Tanzania Cobalt sulphate Market Revenues & Volume By Magnet for the Period 2021-2031
- Historical Data and Forecast of Tanzania Cobalt sulphate Market Revenues & Volume By Hard Material for the Period 2021-2031
- Historical Data and Forecast of Tanzania Cobalt sulphate Market Revenues & Volume By Catalyst for the Period 2021-2031
- Historical Data and Forecast of Tanzania Cobalt sulphate Market Revenues & Volume By Color for the Period 2021-2031
- Historical Data and Forecast of Tanzania Cobalt sulphate Market Revenues & Volume By Battery for the Period 2021-2031
- Historical Data and Forecast of Tanzania Cobalt sulphate Market Revenues & Volume By Others for the Period 2021-2031
- Tanzania Cobalt sulphate Import Export Trade Statistics
- Market Opportunity Assessment By Type
- Market Opportunity Assessment By Application
- Tanzania Cobalt sulphate Top Companies Market Share
- Tanzania Cobalt sulphate Competitive Benchmarking By Technical and Operational Parameters
- Tanzania Cobalt sulphate Company Profiles
- Tanzania Cobalt sulphate Key Strategic Recommendations
Frequently Asked Questions About the Market Study (FAQs):
6Wresearch actively monitors the Tanzania Cobalt sulphate Market and publishes its comprehensive annual report, highlighting emerging trends, growth drivers, revenue analysis, and forecast outlook. Our insights help businesses to make data-backed strategic decisions with ongoing market dynamics. Our analysts track relevent industries related to the Tanzania Cobalt sulphate Market, allowing our clients with actionable intelligence and reliable forecasts tailored to emerging regional needs.
Yes, we provide customisation as per your requirements. To learn more, feel free to contact us on sales@6wresearch.com
1 Executive Summary |
2 Introduction |
2.1 Key Highlights of the Report |
2.2 Report Description |
2.3 Market Scope & Segmentation |
2.4 Research Methodology |
2.5 Assumptions |
3 Tanzania Cobalt sulphate Market Overview |
3.1 Tanzania Country Macro Economic Indicators |
3.2 Tanzania Cobalt sulphate Market Revenues & Volume, 2021 & 2031F |
3.3 Tanzania Cobalt sulphate Market - Industry Life Cycle |
3.4 Tanzania Cobalt sulphate Market - Porter's Five Forces |
3.5 Tanzania Cobalt sulphate Market Revenues & Volume Share, By Type, 2021 & 2031F |
3.6 Tanzania Cobalt sulphate Market Revenues & Volume Share, By Application, 2021 & 2031F |
4 Tanzania Cobalt sulphate Market Dynamics |
4.1 Impact Analysis |
4.2 Market Drivers |
4.2.1 Increasing demand for electric vehicles globally, which use cobalt sulphate in their batteries |
4.2.2 Growing focus on renewable energy sources, leading to higher demand for cobalt sulphate in energy storage solutions |
4.2.3 Technological advancements in cobalt sulphate production processes, improving efficiency and lowering costs |
4.3 Market Restraints |
4.3.1 Fluctuating prices of cobalt metal, impacting the overall cost of cobalt sulphate production |
4.3.2 Environmental concerns related to cobalt mining and processing, leading to stricter regulations |
4.3.3 Competition from alternative materials for battery production, affecting the demand for cobalt sulphate |
5 Tanzania Cobalt sulphate Market Trends |
6 Tanzania Cobalt sulphate Market Segmentations |
6.1 Tanzania Cobalt sulphate Market, By Type |
6.1.1 Overview and Analysis |
6.1.2 Tanzania Cobalt sulphate Market Revenues & Volume, By Battery, 2021-2031F |
6.1.3 Tanzania Cobalt sulphate Market Revenues & Volume, By Pigment, 2021-2031F |
6.2 Tanzania Cobalt sulphate Market, By Application |
6.2.1 Overview and Analysis |
6.2.2 Tanzania Cobalt sulphate Market Revenues & Volume, By Super Alloy, 2021-2031F |
6.2.3 Tanzania Cobalt sulphate Market Revenues & Volume, By Hard Facing/ HSS & Other Alloy, 2021-2031F |
6.2.4 Tanzania Cobalt sulphate Market Revenues & Volume, By Magnet, 2021-2031F |
6.2.5 Tanzania Cobalt sulphate Market Revenues & Volume, By Hard Material, 2021-2031F |
6.2.6 Tanzania Cobalt sulphate Market Revenues & Volume, By Catalyst, 2021-2031F |
6.2.7 Tanzania Cobalt sulphate Market Revenues & Volume, By Color, 2021-2031F |
6.2.8 Tanzania Cobalt sulphate Market Revenues & Volume, By Others, 2021-2031F |
6.2.9 Tanzania Cobalt sulphate Market Revenues & Volume, By Others, 2021-2031F |
7 Tanzania Cobalt sulphate Market Import-Export Trade Statistics |
7.1 Tanzania Cobalt sulphate Market Export to Major Countries |
7.2 Tanzania Cobalt sulphate Market Imports from Major Countries |
8 Tanzania Cobalt sulphate Market Key Performance Indicators |
8.1 Cobalt prices on the global market |
8.2 Adoption rate of electric vehicles in key markets |
8.3 Investment in renewable energy projects in Tanzania |
8.4 Research and development expenditure in cobalt sulphate production technologies |
8.5 Environmental compliance metrics for cobalt mining and processing operations |
9 Tanzania Cobalt sulphate Market - Opportunity Assessment |
9.1 Tanzania Cobalt sulphate Market Opportunity Assessment, By Type, 2021 & 2031F |
9.2 Tanzania Cobalt sulphate Market Opportunity Assessment, By Application, 2021 & 2031F |
10 Tanzania Cobalt sulphate Market - Competitive Landscape |
10.1 Tanzania Cobalt sulphate Market Revenue Share, By Companies, 2024 |
10.2 Tanzania Cobalt sulphate Market Competitive Benchmarking, By Operating and Technical Parameters |
11 Company Profiles |
12 Recommendations | 13 Disclaimer |
Global Go To Market Strategy - 2030
Export potential enables firms to identify high-growth global markets with greater confidence by combining advanced trade intelligence with a structured quantitative methodology. The framework analyzes emerging demand trends and country-level import patterns while integrating macroeconomic and trade datasets such as GDP and population forecasts, bilateral import–export flows, tariff structures, elasticity differentials between developed and developing economies, geographic distance, and import demand projections. Using weighted trade values from 2020–2024 as the base period to project country-to-country export potential for 2030, these inputs are operationalized through calculated drivers such as gravity model parameters, tariff impact factors, and projected GDP per-capita growth. Through an analysis of hidden potentials, demand hotspots, and market conditions that are most favorable to success, this method enables firms to focus on target countries, maximize returns, and global expansion with data, backed by accuracy.
By factoring in the projected importer demand gap that is currently unmet and could be potential opportunity, it identifies the potential for the Exporter (Country) among 190 countries, against the general trade analysis, which identifies the biggest importer or exporter.
To discover high-growth global markets and optimize your business strategy:
Click Here
Pricing
- Single User License$ 1,995
- Department License$ 2,400
- Site License$ 3,120
- Global License$ 3,795

Leadership Perspectives from Industry Events
Search
Thought Leadership and Analyst Meet


Our Clients
6WResearch In News
- India Export Attractiveness Tracker 2026
- India Air Conditioner Market Set for Strong Rebound in 2026 After Weather-Led Correction and GST-Driven Recovery: 6Wresearch
- ADAS in India: How Automatic Emergency Braking, Blind Spot Detection & Driver Monitoring are Transforming Road Safety
- Doha a strategic location for EV manufacturing hub: IPA Qatar
- Demand for luxury TVs surging in the GCC, says Samsung
- Empowering Growth: The Thriving Journey of Bangladesh’s Cable Industry
Latest Reports
- Nicaragua RPG Gaming Market (2026-2032)
- New Zealand RPG Gaming Market (2026-2032)
- Netherlands RPG Gaming Market (2026-2032)
- Nauru RPG Gaming Market (2026-2032)
- Namibia RPG Gaming Market (2026-2032)
- Mozambique RPG Gaming Market (2026-2032)
- Montenegro RPG Gaming Market (2026-2032)
- Mongolia RPG Gaming Market (2026-2032)
- Monaco RPG Gaming Market (2026-2032)
- Micronesia RPG Gaming Market (2026-2032)
Industry Events and Analyst Meet

EV India Expo 2026

HIMTEX 2026

India Refining Summit 2026

India EV Show 2026

EV tech India Expo 2026
Whitepaper
- Middle East & Africa Commercial Security Market Click here to view more.
- Middle East & Africa Fire Safety Systems & Equipment Market Click here to view more.
- GCC Drone Market Click here to view more.
- Middle East Lighting Fixture Market Click here to view more.
- GCC Physical & Perimeter Security Market Click here to view more.