Tanzania Electronic Chemicals and Materials Market (2025-2031) Outlook | Size, Trends, Revenue, Value, Share, Growth, Forecast, Industry, Companies & Analysis
Market Forecast By Type (Specialty Gases, CMP Slurries, Conductive Polymers, Photoresist Chemicals, Low K Dielectrics, Wet Chemicals, Silicon Wafers, PCB Laminates), By Application (Semiconductors, Integrated Circuits, Printed Circuit Boards, Others) And Competitive Landscape
| Product Code: ETC4475516 | Publication Date: Jul 2023 | Updated Date: Nov 2025 | Product Type: Report | |
| Publisher: 6Wresearch | Author: Ravi Bhandari | No. of Pages: 85 | No. of Figures: 45 | No. of Tables: 25 |
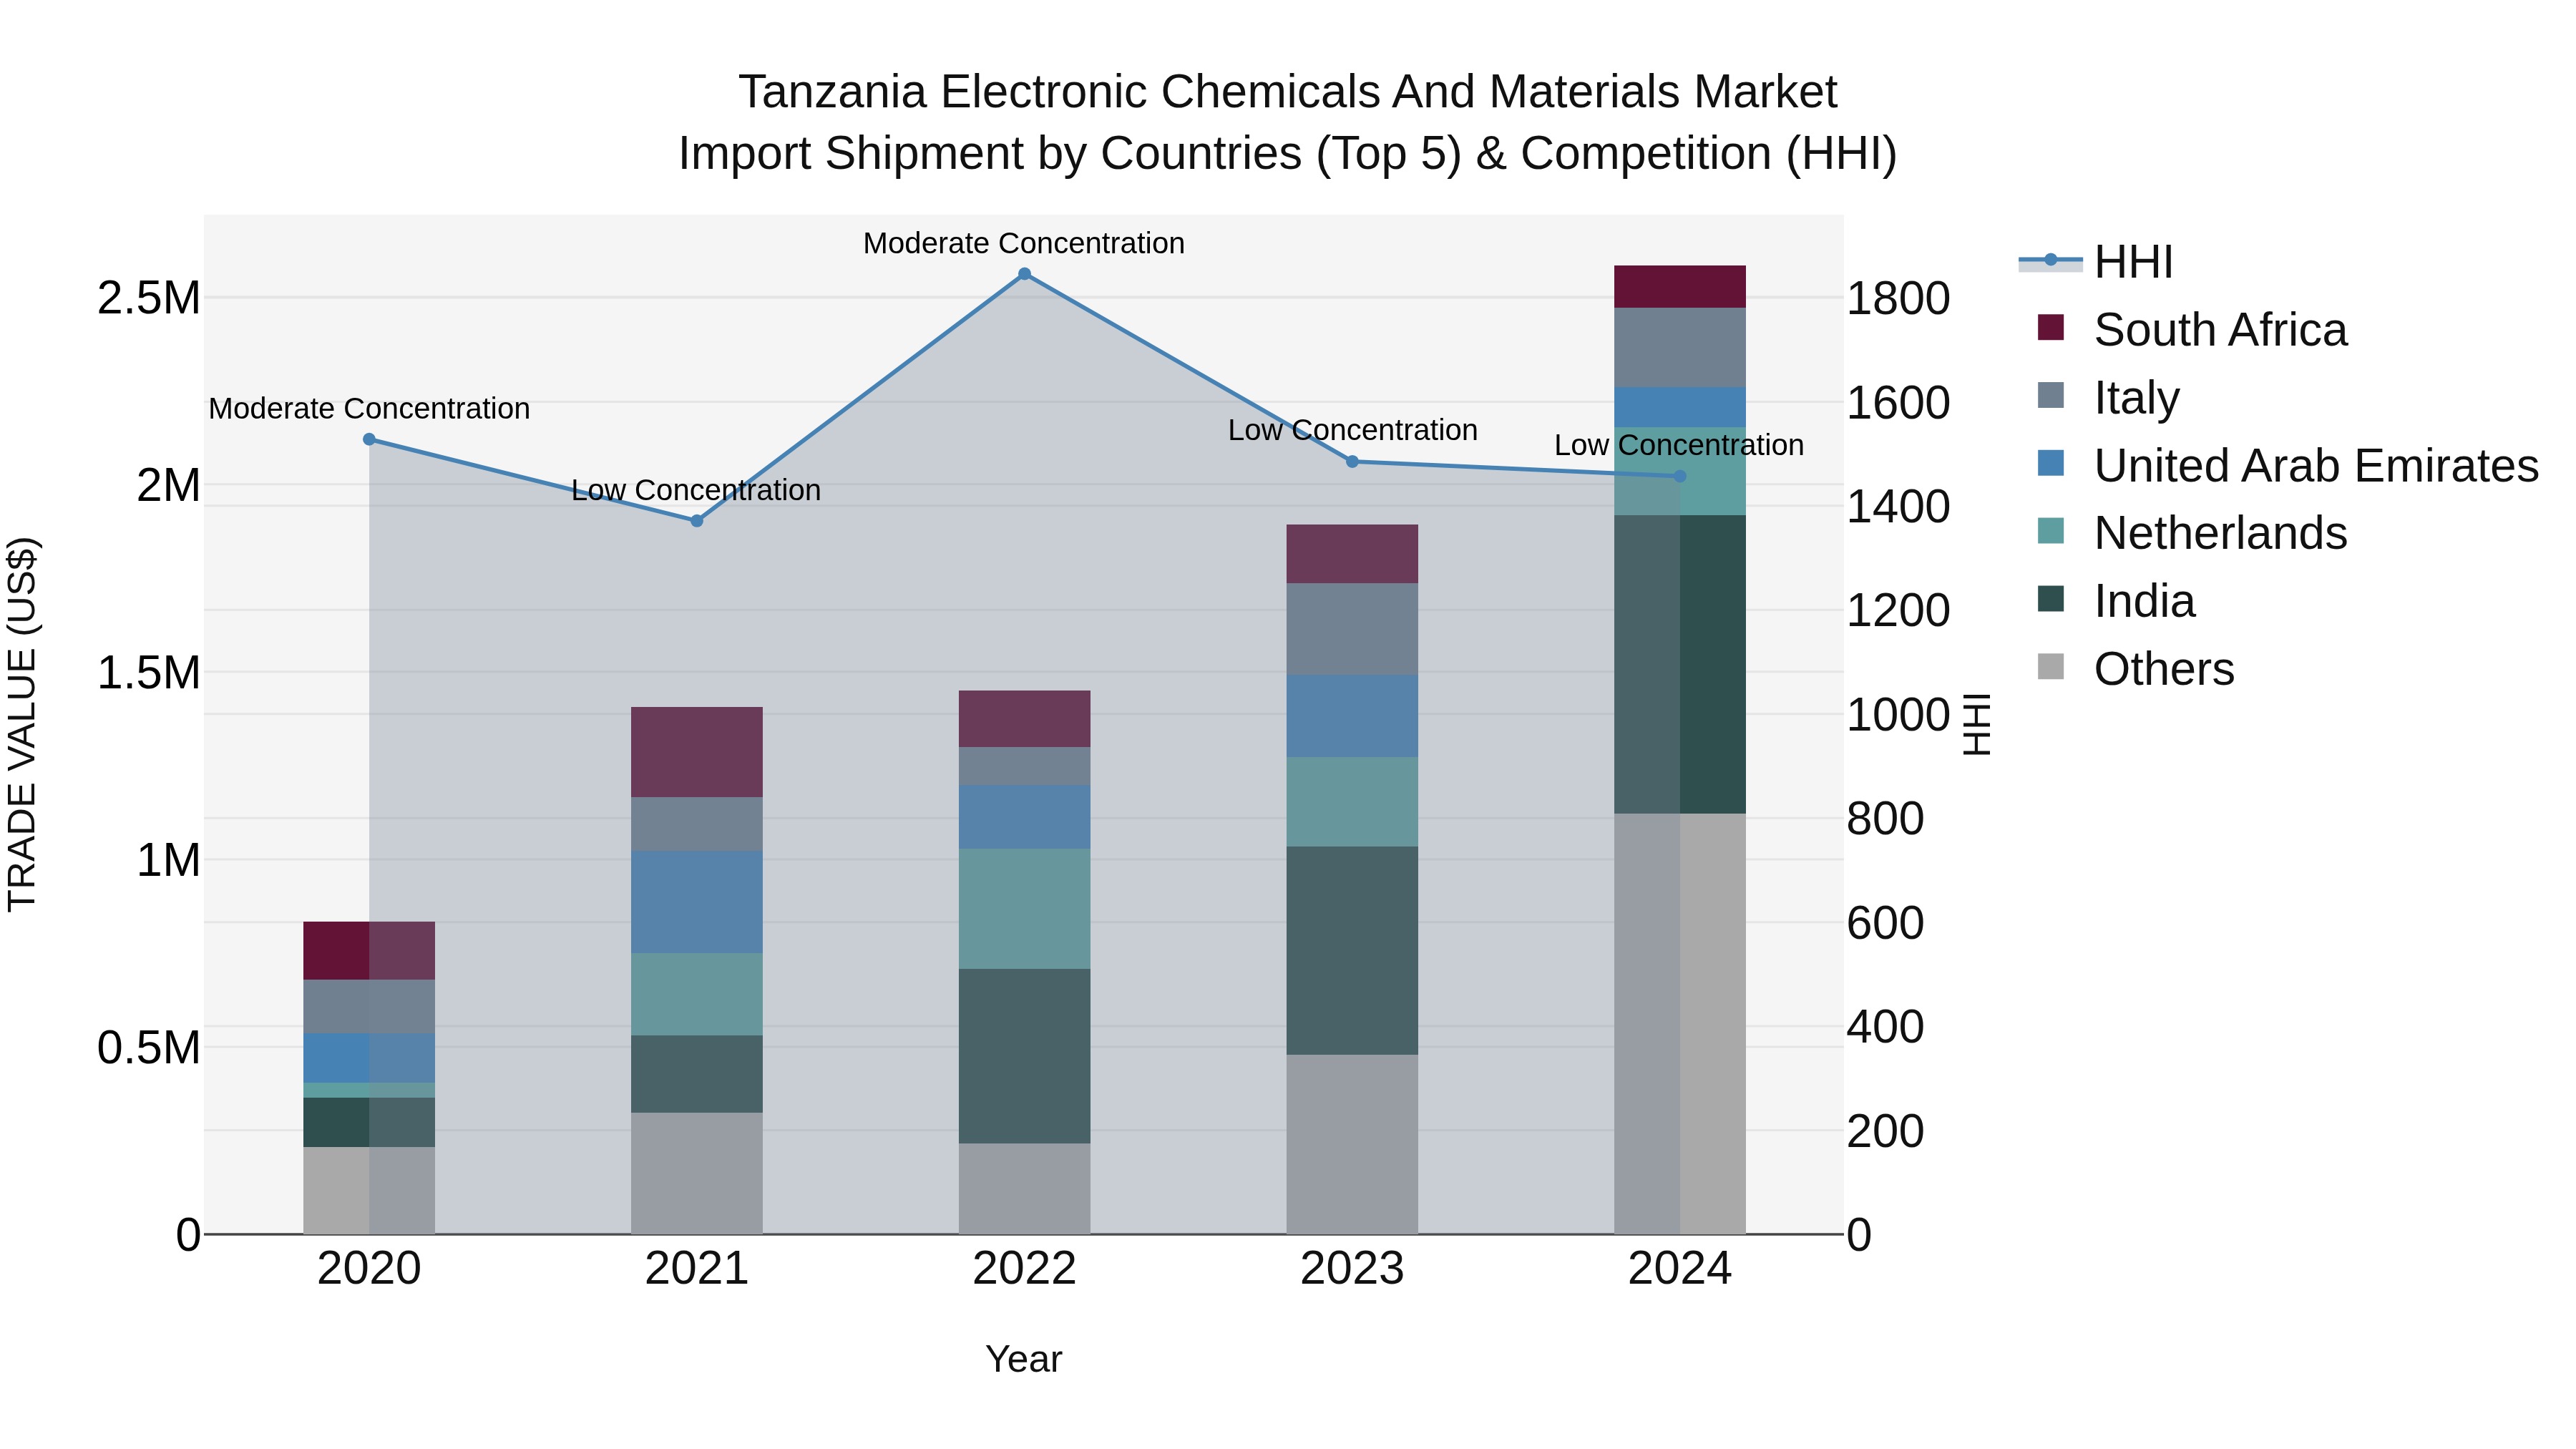
Tanzania Electronic Chemicals and Materials Market: Top 5 Importing Countries and Market Competition (HHI) Analysis
Tanzania`s electronic chemicals and materials import market in 2024 saw a significant rise in shipments, with key exporters being India, China, Netherlands, Kuwait, and Italy. The low Herfindahl-Hirschman Index (HHI) concentration indicates a diverse import market. The impressive compound annual growth rate (CAGR) of 32.69% from 2020 to 2024 highlights the sector`s expansion. Furthermore, the growth rate of 36.52% from 2023 to 2024 signals continued momentum and opportunities for both domestic businesses and international suppliers in Tanzania`s electronic chemicals and materials market.
Tanzania Electronic Chemicals and Materials Market Overview
The Tanzania Electronic Chemicals and Materials Market is experiencing steady growth driven by increasing demand for electronic components in sectors such as telecommunications, automotive, and consumer electronics. Key players in the market are focusing on developing advanced materials to meet the evolving technological requirements, such as high-performance semiconductors, printed circuit boards, and photovoltaic cells. The market is also witnessing a rise in investments in research and development activities to enhance product offerings and cater to diverse applications. Additionally, the emphasis on environmental sustainability and regulatory compliance is prompting manufacturers to adopt eco-friendly processes and materials. Overall, the Tanzania Electronic Chemicals and Materials Market is poised for further expansion with opportunities arising from the growing electronics industry and technological advancements.
Tanzania Electronic Chemicals and Materials Market Trends and Opportunities
The Tanzania Electronic Chemicals and Materials Market is experiencing growth due to increasing demand for electronic devices and components in various industries such as telecommunications, automotive, and healthcare. The market is witnessing a trend towards the development of advanced materials with improved performance characteristics to meet the evolving requirements of electronic manufacturers. Opportunities exist for companies to innovate and offer environmentally friendly chemicals and materials to cater to the growing awareness of sustainability in the market. Additionally, the rise in investments in infrastructure development and the adoption of digital technologies in Tanzania present avenues for market expansion. Collaboration with local manufacturers and suppliers can also enhance market presence and competitiveness in the evolving landscape of the Tanzania Electronic Chemicals and Materials Market.
Tanzania Electronic Chemicals and Materials Market Challenges
In the Tanzania Electronic Chemicals and Materials Market, challenges primarily stem from limited infrastructure, including inadequate supply chain networks and transportation systems. This hinders the efficient distribution of electronic chemicals and materials to manufacturers, impacting the timely production of electronic devices. Furthermore, the market faces difficulties in terms of regulatory barriers and compliance requirements, which can add complexity and costs to businesses operating in the sector. Additionally, the lack of skilled labor and technical expertise poses a challenge in maintaining high-quality standards in the production processes. Overall, addressing these challenges will be crucial for the growth and sustainability of the Tanzania Electronic Chemicals and Materials Market.
Tanzania Electronic Chemicals and Materials Market Drivers
The Tanzania Electronic Chemicals and Materials Market is primarily driven by the increasing demand for electronic products across various industries including consumer electronics, automotive, and healthcare. With the rapid technological advancements and the growing adoption of smart devices, there is a rising need for high-quality electronic chemicals and materials to support the manufacturing processes. Furthermore, the expansion of the semiconductor industry and the development of new electronic components are fueling the market growth. Additionally, favorable government initiatives to promote the electronics manufacturing sector and the increasing investment in research and development activities are also contributing to the market expansion in Tanzania. Overall, the demand for electronic chemicals and materials is expected to continue rising due to the ongoing digitization trends and the growing reliance on electronic devices in the country.
Tanzania Electronic Chemicals and Materials Market Government Policies
The Tanzania government has implemented policies to promote the growth of the Electronic Chemicals and Materials Market. These policies focus on fostering innovation, encouraging foreign investment, and creating a conducive business environment for industry players. The government has emphasized the importance of research and development in the sector, offering incentives for companies to invest in new technologies and product development. Additionally, there are initiatives in place to support local manufacturers and promote domestic production of electronic chemicals and materials. Overall, the government is committed to driving the growth of the electronic chemicals and materials market in Tanzania through supportive policies and incentives for industry players.
Tanzania Electronic Chemicals and Materials Market Future Outlook
The Tanzania Electronic Chemicals and Materials Market is poised for significant growth in the coming years. Factors such as increasing demand for electronic components in various industries, expanding telecommunications sector, and rising investments in infrastructure development are expected to drive market expansion. Additionally, the growing adoption of advanced technologies like Internet of Things (IoT) and artificial intelligence will further fuel the demand for electronic chemicals and materials. The government`s initiatives to promote digitalization and technological advancements in the country will also contribute to the market growth. Overall, the Tanzania Electronic Chemicals and Materials Market is anticipated to experience robust growth opportunities in the foreseeable future.
Key Highlights of the Report:
- Tanzania Electronic Chemicals and Materials Market Outlook
- Market Size of Tanzania Electronic Chemicals and Materials Market, 2024
- Forecast of Tanzania Electronic Chemicals and Materials Market, 2031
- Historical Data and Forecast of Tanzania Electronic Chemicals and Materials Revenues & Volume for the Period 2021 - 2031
- Tanzania Electronic Chemicals and Materials Market Trend Evolution
- Tanzania Electronic Chemicals and Materials Market Drivers and Challenges
- Tanzania Electronic Chemicals and Materials Price Trends
- Tanzania Electronic Chemicals and Materials Porter's Five Forces
- Tanzania Electronic Chemicals and Materials Industry Life Cycle
- Historical Data and Forecast of Tanzania Electronic Chemicals and Materials Market Revenues & Volume By Type for the Period 2021 - 2031
- Historical Data and Forecast of Tanzania Electronic Chemicals and Materials Market Revenues & Volume By Specialty Gases for the Period 2021 - 2031
- Historical Data and Forecast of Tanzania Electronic Chemicals and Materials Market Revenues & Volume By CMP Slurries for the Period 2021 - 2031
- Historical Data and Forecast of Tanzania Electronic Chemicals and Materials Market Revenues & Volume By Conductive Polymers for the Period 2021 - 2031
- Historical Data and Forecast of Tanzania Electronic Chemicals and Materials Market Revenues & Volume By Photoresist Chemicals for the Period 2021 - 2031
- Historical Data and Forecast of Tanzania Electronic Chemicals and Materials Market Revenues & Volume By Low K Dielectrics for the Period 2021 - 2031
- Historical Data and Forecast of Tanzania Electronic Chemicals and Materials Market Revenues & Volume By Wet Chemicals for the Period 2021 - 2031
- Historical Data and Forecast of Tanzania Electronic Chemicals and Materials Market Revenues & Volume By Silicon Wafers for the Period 2021 - 2031
- Historical Data and Forecast of Tanzania Specialty Gases Electronic Chemicals and Materials Market Revenues & Volume By PCB Laminates for the Period 2021 - 2031
- Historical Data and Forecast of Tanzania Electronic Chemicals and Materials Market Revenues & Volume By Application for the Period 2021 - 2031
- Historical Data and Forecast of Tanzania Electronic Chemicals and Materials Market Revenues & Volume By Semiconductors for the Period 2021 - 2031
- Historical Data and Forecast of Tanzania Electronic Chemicals and Materials Market Revenues & Volume By Integrated Circuits for the Period 2021 - 2031
- Historical Data and Forecast of Tanzania Electronic Chemicals and Materials Market Revenues & Volume By Printed Circuit Boards for the Period 2021 - 2031
- Historical Data and Forecast of Tanzania Electronic Chemicals and Materials Market Revenues & Volume By Others for the Period 2021 - 2031
- Tanzania Electronic Chemicals and Materials Import Export Trade Statistics
- Market Opportunity Assessment By Type
- Market Opportunity Assessment By Application
- Tanzania Electronic Chemicals and Materials Top Companies Market Share
- Tanzania Electronic Chemicals and Materials Competitive Benchmarking By Technical and Operational Parameters
- Tanzania Electronic Chemicals and Materials Company Profiles
- Tanzania Electronic Chemicals and Materials Key Strategic Recommendations
Frequently Asked Questions About the Market Study (FAQs):
6Wresearch actively monitors the Tanzania Electronic Chemicals and Materials Market and publishes its comprehensive annual report, highlighting emerging trends, growth drivers, revenue analysis, and forecast outlook. Our insights help businesses to make data-backed strategic decisions with ongoing market dynamics. Our analysts track relevent industries related to the Tanzania Electronic Chemicals and Materials Market, allowing our clients with actionable intelligence and reliable forecasts tailored to emerging regional needs.
Yes, we provide customisation as per your requirements. To learn more, feel free to contact us on sales@6wresearch.com
1 Executive Summary |
2 Introduction |
2.1 Key Highlights of the Report |
2.2 Report Description |
2.3 Market Scope & Segmentation |
2.4 Research Methodology |
2.5 Assumptions |
3 Tanzania Electronic Chemicals and Materials Market Overview |
3.1 Tanzania Country Macro Economic Indicators |
3.2 Tanzania Electronic Chemicals and Materials Market Revenues & Volume, 2021 & 2031F |
3.3 Tanzania Electronic Chemicals and Materials Market - Industry Life Cycle |
3.4 Tanzania Electronic Chemicals and Materials Market - Porter's Five Forces |
3.5 Tanzania Electronic Chemicals and Materials Market Revenues & Volume Share, By Type, 2021 & 2031F |
3.6 Tanzania Electronic Chemicals and Materials Market Revenues & Volume Share, By Application, 2021 & 2031F |
4 Tanzania Electronic Chemicals and Materials Market Dynamics |
4.1 Impact Analysis |
4.2 Market Drivers |
4.2.1 Increasing adoption of electronic devices and components in various industries |
4.2.2 Growth of the electronics manufacturing sector in Tanzania |
4.2.3 Technological advancements leading to the development of new electronic chemicals and materials |
4.3 Market Restraints |
4.3.1 Limited availability of skilled workforce for the production and handling of electronic chemicals and materials |
4.3.2 Fluctuating prices of raw materials impacting the overall production cost |
4.3.3 Lack of awareness about the benefits and applications of electronic chemicals and materials among end-users |
5 Tanzania Electronic Chemicals and Materials Market Trends |
6 Tanzania Electronic Chemicals and Materials Market, By Types |
6.1 Tanzania Electronic Chemicals and Materials Market, By Type |
6.1.1 Overview and Analysis |
6.1.2 Tanzania Electronic Chemicals and Materials Market Revenues & Volume, By Type, 2021 - 2031F |
6.1.3 Tanzania Electronic Chemicals and Materials Market Revenues & Volume, By Specialty Gases, 2021 - 2031F |
6.1.4 Tanzania Electronic Chemicals and Materials Market Revenues & Volume, By CMP Slurries, 2021 - 2031F |
6.1.5 Tanzania Electronic Chemicals and Materials Market Revenues & Volume, By Conductive Polymers, 2021 - 2031F |
6.1.6 Tanzania Electronic Chemicals and Materials Market Revenues & Volume, By Photoresist Chemicals, 2021 - 2031F |
6.1.7 Tanzania Electronic Chemicals and Materials Market Revenues & Volume, By Low K Dielectrics, 2021 - 2031F |
6.1.8 Tanzania Electronic Chemicals and Materials Market Revenues & Volume, By Wet Chemicals, 2021 - 2031F |
6.1.9 Tanzania Electronic Chemicals and Materials Market Revenues & Volume, By PCB Laminates, 2021 - 2031F |
6.1.10 Tanzania Electronic Chemicals and Materials Market Revenues & Volume, By PCB Laminates, 2021 - 2031F |
6.2 Tanzania Electronic Chemicals and Materials Market, By Application |
6.2.1 Overview and Analysis |
6.2.2 Tanzania Electronic Chemicals and Materials Market Revenues & Volume, By Semiconductors, 2021 - 2031F |
6.2.3 Tanzania Electronic Chemicals and Materials Market Revenues & Volume, By Integrated Circuits, 2021 - 2031F |
6.2.4 Tanzania Electronic Chemicals and Materials Market Revenues & Volume, By Printed Circuit Boards, 2021 - 2031F |
6.2.5 Tanzania Electronic Chemicals and Materials Market Revenues & Volume, By Others, 2021 - 2031F |
7 Tanzania Electronic Chemicals and Materials Market Import-Export Trade Statistics |
7.1 Tanzania Electronic Chemicals and Materials Market Export to Major Countries |
7.2 Tanzania Electronic Chemicals and Materials Market Imports from Major Countries |
8 Tanzania Electronic Chemicals and Materials Market Key Performance Indicators |
8.1 Research and development investment in electronic chemicals and materials |
8.2 Adoption rate of eco-friendly electronic chemicals and materials |
8.3 Number of patents filed for innovative electronic chemicals and materials |
9 Tanzania Electronic Chemicals and Materials Market - Opportunity Assessment |
9.1 Tanzania Electronic Chemicals and Materials Market Opportunity Assessment, By Type, 2021 & 2031F |
9.2 Tanzania Electronic Chemicals and Materials Market Opportunity Assessment, By Application, 2021 & 2031F |
10 Tanzania Electronic Chemicals and Materials Market - Competitive Landscape |
10.1 Tanzania Electronic Chemicals and Materials Market Revenue Share, By Companies, 2024 |
10.2 Tanzania Electronic Chemicals and Materials Market Competitive Benchmarking, By Operating and Technical Parameters |
11 Company Profiles |
12 Recommendations |
13 Disclaimer |
Global Go To Market Strategy - 2030
Export potential enables firms to identify high-growth global markets with greater confidence by combining advanced trade intelligence with a structured quantitative methodology. The framework analyzes emerging demand trends and country-level import patterns while integrating macroeconomic and trade datasets such as GDP and population forecasts, bilateral import–export flows, tariff structures, elasticity differentials between developed and developing economies, geographic distance, and import demand projections. Using weighted trade values from 2020–2024 as the base period to project country-to-country export potential for 2030, these inputs are operationalized through calculated drivers such as gravity model parameters, tariff impact factors, and projected GDP per-capita growth. Through an analysis of hidden potentials, demand hotspots, and market conditions that are most favorable to success, this method enables firms to focus on target countries, maximize returns, and global expansion with data, backed by accuracy.
By factoring in the projected importer demand gap that is currently unmet and could be potential opportunity, it identifies the potential for the Exporter (Country) among 190 countries, against the general trade analysis, which identifies the biggest importer or exporter.
To discover high-growth global markets and optimize your business strategy:
Click Here
Pricing
- Single User License$ 1,995
- Department License$ 2,400
- Site License$ 3,120
- Global License$ 3,795

Leadership Perspectives from Industry Events
Search
Thought Leadership and Analyst Meet


Our Clients
6WResearch In News
- India Export Attractiveness Tracker 2026
- India Air Conditioner Market Set for Strong Rebound in 2026 After Weather-Led Correction and GST-Driven Recovery: 6Wresearch
- ADAS in India: How Automatic Emergency Braking, Blind Spot Detection & Driver Monitoring are Transforming Road Safety
- Doha a strategic location for EV manufacturing hub: IPA Qatar
- Demand for luxury TVs surging in the GCC, says Samsung
- Empowering Growth: The Thriving Journey of Bangladesh’s Cable Industry
Latest Reports
- Nicaragua RPG Gaming Market (2026-2032)
- New Zealand RPG Gaming Market (2026-2032)
- Netherlands RPG Gaming Market (2026-2032)
- Nauru RPG Gaming Market (2026-2032)
- Namibia RPG Gaming Market (2026-2032)
- Mozambique RPG Gaming Market (2026-2032)
- Montenegro RPG Gaming Market (2026-2032)
- Mongolia RPG Gaming Market (2026-2032)
- Monaco RPG Gaming Market (2026-2032)
- Micronesia RPG Gaming Market (2026-2032)
Industry Events and Analyst Meet

EV India Expo 2026

HIMTEX 2026

India Refining Summit 2026

India EV Show 2026

EV tech India Expo 2026
Whitepaper
- Middle East & Africa Commercial Security Market Click here to view more.
- Middle East & Africa Fire Safety Systems & Equipment Market Click here to view more.
- GCC Drone Market Click here to view more.
- Middle East Lighting Fixture Market Click here to view more.
- GCC Physical & Perimeter Security Market Click here to view more.