Tanzania Isocyanates Market (2025-2031) | Outlook, Share, Segmentation, Revenue, Growth, Trends, Value, Size, Companies, Forecast, Analysis & Industry
Market Forecast By Type (MDI, TDI, Aliphatic and Cycloaliphatic), By Application (Elastomers, Elastomers, Binders), By End-use (Automotive, Building & Construction, Electronics, Others) And Competitive Landscape
| Product Code: ETC4820970 | Publication Date: Nov 2023 | Updated Date: Sep 2025 | Product Type: Market Research Report | |
| Publisher: 6Wresearch | Author: Sachin Kumar Rai | No. of Pages: 60 | No. of Figures: 30 | No. of Tables: 5 |
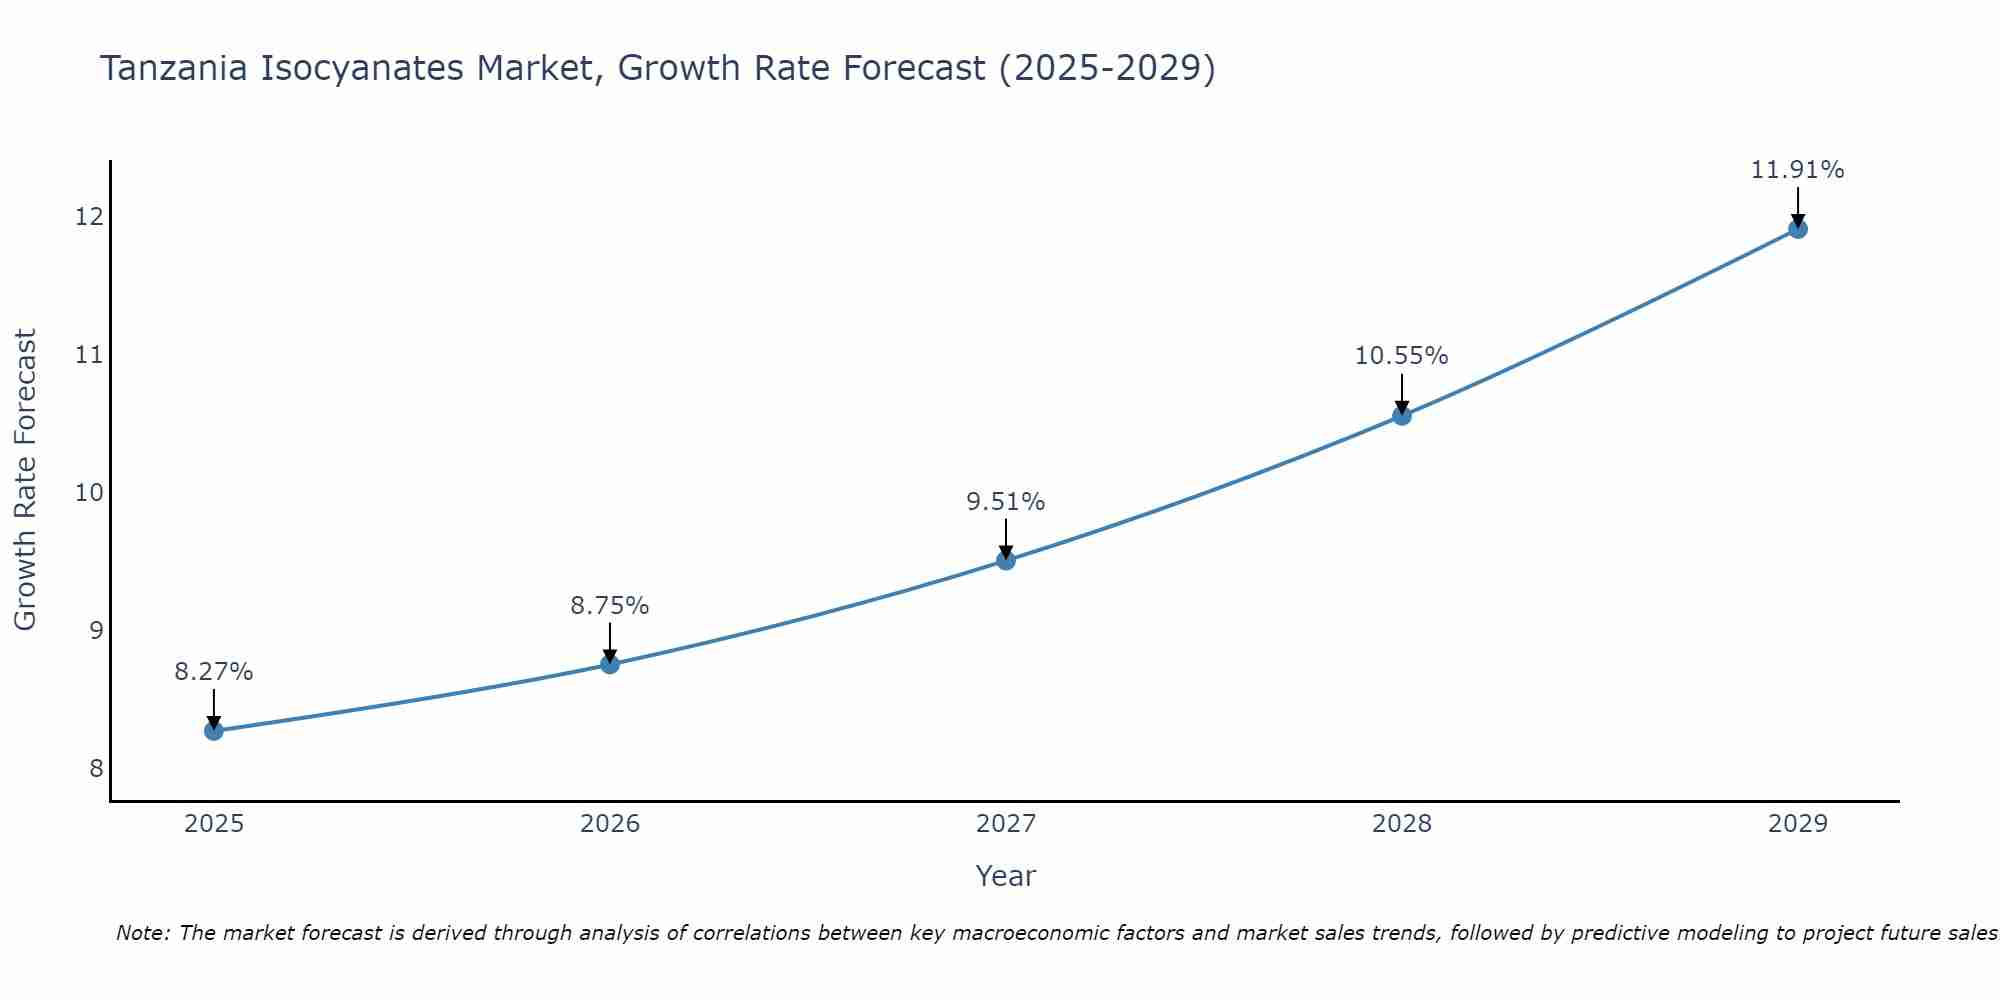
Tanzania Isocyanates Market Size Growth Rate
The Tanzania Isocyanates Market is poised for steady growth rate improvements from 2025 to 2029. The growth rate starts at 8.27% in 2025 and reaches 11.91% by 2029.
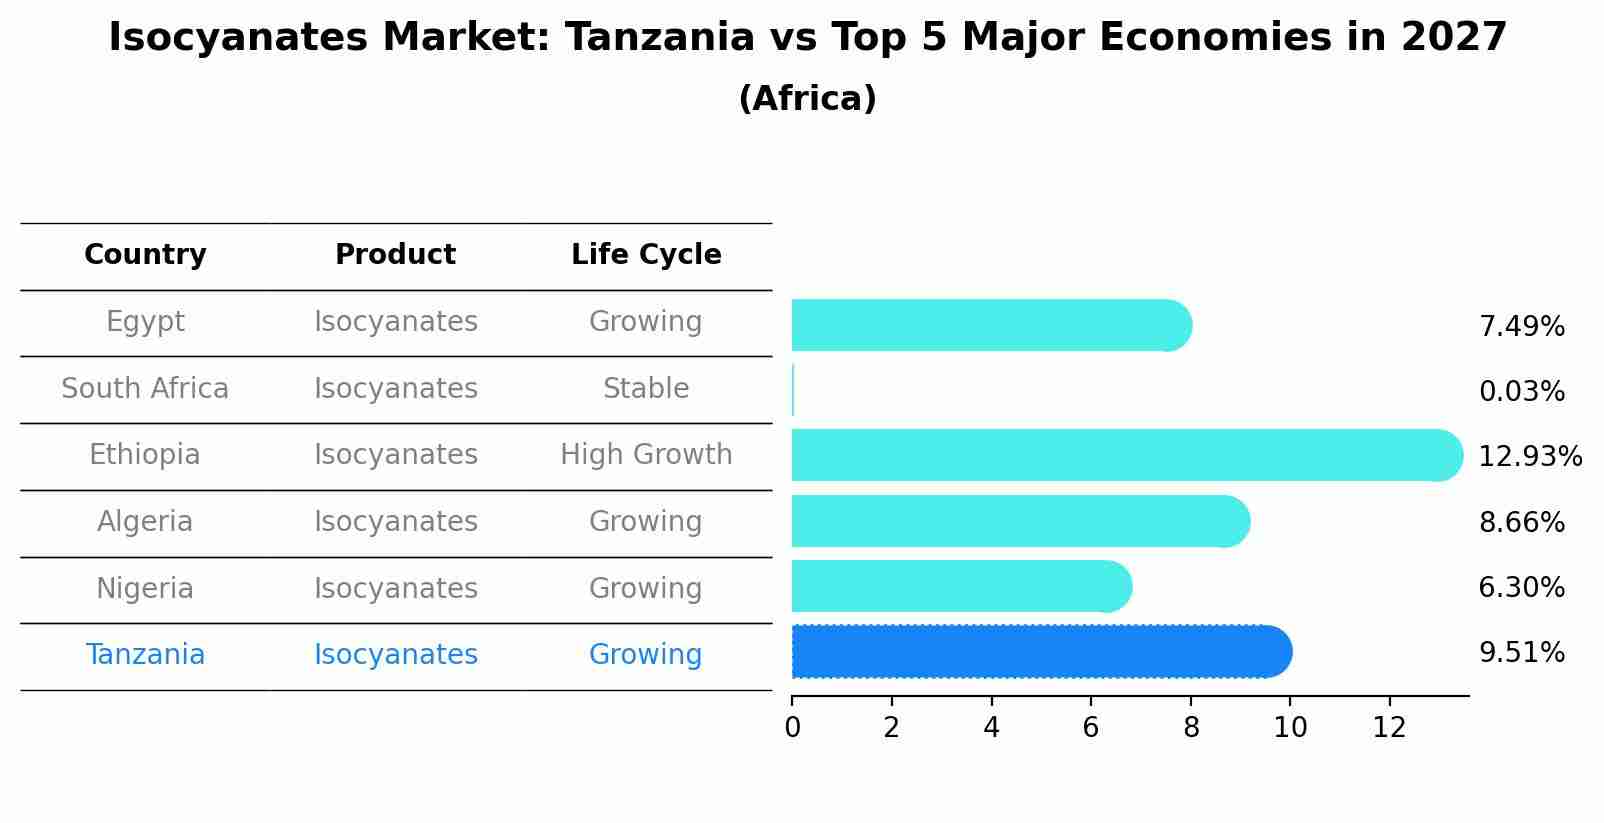
Isocyanates Market: Tanzania vs Top 5 Major Economies in 2027 (Africa)
The Isocyanates market in Tanzania is projected to grow at a growing growth rate of 9.51% by 2027, within the Africa region led by Egypt, along with other countries like South Africa, Ethiopia, Algeria and Nigeria, collectively shaping a dynamic and evolving market environment driven by innovation and increasing adoption of emerging technologies.
Tanzania Isocyanates Market Overview
The Isocyanates Market in Tanzania is characterized by the presence of various types of isocyanates, including TDI, MDI, and HDI, used in different applications. The market is driven by the demand for high-performance materials in construction, automotive, and electronics industries. The versatility of isocyanates in producing a wide range of polyurethane products is a key factor propelling market growth. Regulatory standards and innovations in safer and more efficient production methods are also influencing the market.
Drivers of the market
The Tanzania Isocyanates Market is driven by similar factors as the isocyanate market, with a focus on its applications in the production of polyurethane products. The growth of the construction and automotive industries, along with the increasing demand for durable and high-performance materials, supports market growth. The expansion of manufacturing activities in Tanzania further boosts the market.
Challenges of the market
Challenges in the Tanzania isocyanates market include supply chain disruptions, regulatory compliance requirements, and competitive pressures from global manufacturers. Dependence on imported raw materials and fluctuating market demand affect pricing dynamics and supply chain stability, necessitating strategic partnerships, supply chain resilience measures, and market diversification strategies to navigate challenges and capitalize on growth opportunities.
Government Policy of the market
Policies emphasize regulatory compliance in isocyanate handling and transportation, import-export regulations, and standards for product quality and safety, ensuring consumer protection and environmental sustainability in the market.
Key Highlights of the Report:
- Tanzania Isocyanates Market Outlook
- Market Size of Tanzania Isocyanates Market, 2024
- Forecast of Tanzania Isocyanates Market, 2031
- Historical Data and Forecast of Tanzania Isocyanates Revenues & Volume for the Period 2021-2031
- Tanzania Isocyanates Market Trend Evolution
- Tanzania Isocyanates Market Drivers and Challenges
- Tanzania Isocyanates Price Trends
- Tanzania Isocyanates Porter`s Five Forces
- Tanzania Isocyanates Industry Life Cycle
- Historical Data and Forecast of Tanzania Isocyanates Market Revenues & Volume By Type for the Period 2021-2031
- Historical Data and Forecast of Tanzania Isocyanates Market Revenues & Volume By MDI for the Period 2021-2031
- Historical Data and Forecast of Tanzania Isocyanates Market Revenues & Volume By TDI for the Period 2021-2031
- Historical Data and Forecast of Tanzania Isocyanates Market Revenues & Volume By Aliphatic and Cycloaliphatic for the Period 2021-2031
- Historical Data and Forecast of Tanzania Isocyanates Market Revenues & Volume By Application for the Period 2021-2031
- Historical Data and Forecast of Tanzania Isocyanates Market Revenues & Volume By Elastomers for the Period 2021-2031
- Historical Data and Forecast of Tanzania Isocyanates Market Revenues & Volume By Elastomers for the Period 2021-2031
- Historical Data and Forecast of Tanzania Isocyanates Market Revenues & Volume By Binders for the Period 2021-2031
- Historical Data and Forecast of Tanzania Isocyanates Market Revenues & Volume By End-use for the Period 2021-2031
- Historical Data and Forecast of Tanzania Isocyanates Market Revenues & Volume By Automotive for the Period 2021-2031
- Historical Data and Forecast of Tanzania Isocyanates Market Revenues & Volume By Building & Construction for the Period 2021-2031
- Historical Data and Forecast of Tanzania Isocyanates Market Revenues & Volume By Electronics for the Period 2021-2031
- Historical Data and Forecast of Tanzania Isocyanates Market Revenues & Volume By Others for the Period 2021-2031
- Tanzania Isocyanates Import Export Trade Statistics
- Market Opportunity Assessment By Type
- Market Opportunity Assessment By Application
- Market Opportunity Assessment By End-use
- Tanzania Isocyanates Top Companies Market Share
- Tanzania Isocyanates Competitive Benchmarking By Technical and Operational Parameters
- Tanzania Isocyanates Company Profiles
- Tanzania Isocyanates Key Strategic Recommendations
Frequently Asked Questions About the Market Study (FAQs):
6Wresearch actively monitors the Tanzania Isocyanates Market and publishes its comprehensive annual report, highlighting emerging trends, growth drivers, revenue analysis, and forecast outlook. Our insights help businesses to make data-backed strategic decisions with ongoing market dynamics. Our analysts track relevent industries related to the Tanzania Isocyanates Market, allowing our clients with actionable intelligence and reliable forecasts tailored to emerging regional needs.
Yes, we provide customisation as per your requirements. To learn more, feel free to contact us on sales@6wresearch.com
1 Executive Summary |
2 Introduction |
2.1 Key Highlights of the Report |
2.2 Report Description |
2.3 Market Scope & Segmentation |
2.4 Research Methodology |
2.5 Assumptions |
3 Tanzania Isocyanates Market Overview |
3.1 Tanzania Country Macro Economic Indicators |
3.2 Tanzania Isocyanates Market Revenues & Volume, 2021 & 2031F |
3.3 Tanzania Isocyanates Market - Industry Life Cycle |
3.4 Tanzania Isocyanates Market - Porter's Five Forces |
3.5 Tanzania Isocyanates Market Revenues & Volume Share, By Type, 2021 & 2031F |
3.6 Tanzania Isocyanates Market Revenues & Volume Share, By Application, 2021 & 2031F |
3.7 Tanzania Isocyanates Market Revenues & Volume Share, By End-use, 2021 & 2031F |
4 Tanzania Isocyanates Market Dynamics |
4.1 Impact Analysis |
4.2 Market Drivers |
4.2.1 Increasing demand for polyurethane products in various industries such as construction, automotive, and furniture. |
4.2.2 Growth in the construction sector and infrastructure development projects in Tanzania. |
4.2.3 Rising investments in industrial activities and manufacturing sectors in the country. |
4.3 Market Restraints |
4.3.1 Volatility in raw material prices, especially for key feedstocks used in isocyanates production. |
4.3.2 Stringent regulations and environmental concerns related to the use of isocyanates. |
4.3.3 Competition from alternative materials and substitutes impacting the market growth. |
5 Tanzania Isocyanates Market Trends |
6 Tanzania Isocyanates Market Segmentations |
6.1 Tanzania Isocyanates Market, By Type |
6.1.1 Overview and Analysis |
6.1.2 Tanzania Isocyanates Market Revenues & Volume, By MDI, 2021-2031F |
6.1.3 Tanzania Isocyanates Market Revenues & Volume, By TDI, 2021-2031F |
6.1.4 Tanzania Isocyanates Market Revenues & Volume, By Aliphatic and Cycloaliphatic, 2021-2031F |
6.2 Tanzania Isocyanates Market, By Application |
6.2.1 Overview and Analysis |
6.2.2 Tanzania Isocyanates Market Revenues & Volume, By Elastomers, 2021-2031F |
6.2.3 Tanzania Isocyanates Market Revenues & Volume, By Elastomers, 2021-2031F |
6.2.4 Tanzania Isocyanates Market Revenues & Volume, By Binders, 2021-2031F |
6.3 Tanzania Isocyanates Market, By End-use |
6.3.1 Overview and Analysis |
6.3.2 Tanzania Isocyanates Market Revenues & Volume, By Automotive, 2021-2031F |
6.3.3 Tanzania Isocyanates Market Revenues & Volume, By Building & Construction, 2021-2031F |
6.3.4 Tanzania Isocyanates Market Revenues & Volume, By Electronics, 2021-2031F |
6.3.5 Tanzania Isocyanates Market Revenues & Volume, By Others, 2021-2031F |
7 Tanzania Isocyanates Market Import-Export Trade Statistics |
7.1 Tanzania Isocyanates Market Export to Major Countries |
7.2 Tanzania Isocyanates Market Imports from Major Countries |
8 Tanzania Isocyanates Market Key Performance Indicators |
8.1 Average selling price of isocyanates in Tanzania. |
8.2 Capacity utilization rate of isocyanates production facilities. |
8.3 Number of new product developments or innovations in the isocyanates market. |
8.4 Percentage of market share held by local manufacturers in the Tanzania isocyanates market. |
8.5 Rate of adoption of polyurethane products in key end-use industries. |
9 Tanzania Isocyanates Market - Opportunity Assessment |
9.1 Tanzania Isocyanates Market Opportunity Assessment, By Type, 2021 & 2031F |
9.2 Tanzania Isocyanates Market Opportunity Assessment, By Application, 2021 & 2031F |
9.3 Tanzania Isocyanates Market Opportunity Assessment, By End-use, 2021 & 2031F |
10 Tanzania Isocyanates Market - Competitive Landscape |
10.1 Tanzania Isocyanates Market Revenue Share, By Companies, 2024 |
10.2 Tanzania Isocyanates Market Competitive Benchmarking, By Operating and Technical Parameters |
11 Company Profiles |
12 Recommendations | 13 Disclaimer |
Global Go To Market Strategy - 2030
Export potential enables firms to identify high-growth global markets with greater confidence by combining advanced trade intelligence with a structured quantitative methodology. The framework analyzes emerging demand trends and country-level import patterns while integrating macroeconomic and trade datasets such as GDP and population forecasts, bilateral import–export flows, tariff structures, elasticity differentials between developed and developing economies, geographic distance, and import demand projections. Using weighted trade values from 2020–2024 as the base period to project country-to-country export potential for 2030, these inputs are operationalized through calculated drivers such as gravity model parameters, tariff impact factors, and projected GDP per-capita growth. Through an analysis of hidden potentials, demand hotspots, and market conditions that are most favorable to success, this method enables firms to focus on target countries, maximize returns, and global expansion with data, backed by accuracy.
By factoring in the projected importer demand gap that is currently unmet and could be potential opportunity, it identifies the potential for the Exporter (Country) among 190 countries, against the general trade analysis, which identifies the biggest importer or exporter.
To discover high-growth global markets and optimize your business strategy:
Click Here
Pricing
- Single User License$ 1,995
- Department License$ 2,400
- Site License$ 3,120
- Global License$ 3,795

Leadership Perspectives from Industry Events
Search
Thought Leadership and Analyst Meet


Our Clients
6WResearch In News
- India Export Attractiveness Tracker 2026
- India Air Conditioner Market Set for Strong Rebound in 2026 After Weather-Led Correction and GST-Driven Recovery: 6Wresearch
- ADAS in India: How Automatic Emergency Braking, Blind Spot Detection & Driver Monitoring are Transforming Road Safety
- Doha a strategic location for EV manufacturing hub: IPA Qatar
- Demand for luxury TVs surging in the GCC, says Samsung
- Empowering Growth: The Thriving Journey of Bangladesh’s Cable Industry
Latest Reports
- Nicaragua RPG Gaming Market (2026-2032)
- New Zealand RPG Gaming Market (2026-2032)
- Netherlands RPG Gaming Market (2026-2032)
- Nauru RPG Gaming Market (2026-2032)
- Namibia RPG Gaming Market (2026-2032)
- Mozambique RPG Gaming Market (2026-2032)
- Montenegro RPG Gaming Market (2026-2032)
- Mongolia RPG Gaming Market (2026-2032)
- Monaco RPG Gaming Market (2026-2032)
- Micronesia RPG Gaming Market (2026-2032)
Industry Events and Analyst Meet

EV India Expo 2026

HIMTEX 2026

India Refining Summit 2026

India EV Show 2026

EV tech India Expo 2026
Whitepaper
- Middle East & Africa Commercial Security Market Click here to view more.
- Middle East & Africa Fire Safety Systems & Equipment Market Click here to view more.
- GCC Drone Market Click here to view more.
- Middle East Lighting Fixture Market Click here to view more.
- GCC Physical & Perimeter Security Market Click here to view more.