Tanzania Recloser Market Outlook (2018-2024) | Revenue, Value, COVID-19 IMPACT, Size, Growth, Companies, Analysis, Industry, Share, Trends & Forecast
Market Forecast By Voltage Rating (< 27 KV And 27 KV & Above), By Insulation Type (Gas, Vacuum And Others), By Applications (Power Distribution And Industrial), By End Users (Distribution Utilities And Others Including Railway And Industrial), And Competitive Landscape
| Product Code: ETC004634 | Publication Date: Jun 2022 | Product Type: Market Research Report | ||
| Publisher: 6Wresearch | Author: Ravi Bhandari | No. of Pages: 80 | No. of Figures: 14 | No. of Tables: 8 |
Tanzania Recloser market report comprehensively covers the market by voltage types, insulation types, applications, end-users, and countries. The Tanzania recloser market outlook report provides an unbiased and detailed analysis of the Tanzania recloser market trends, opportunities/high growth areas, and market drivers which would help the stakeholders to devise and align their market strategies according to the current and future market dynamics.
Tanzania Recloser Market Synopsis
Tanzania recloser market is anticipated to project substantial growth on account of expansion of the power sector. Additionally, construction of large-scale commercial projects, strengthening of non-oil sectors, as well as infrastructure development activities will further boost growth of the market over the coming years. However, the market witnessed slow growth during the outbreak of Covid-19 pandemic.
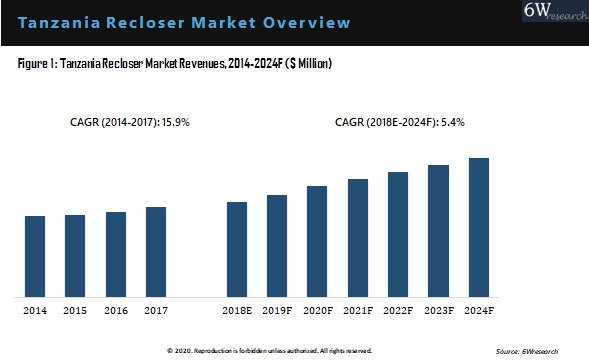
According to 6Wresearch, Tanzania Recloser market size grew at a CAGR of 5.4% during 2018-24. The Reclosers Market in Tanzania, is expected to render positive growth trend during the forecast period as the country plans to invest heavily in order to meet its soaring electricity demands and upgradation of its ageing energy infrastructure. The government has recently launched the natural gas powered, a 240 MW power generation capacity, Kinyerezi II plant that involves an investment of about $353.72 million. This in turn, is further expected to boost the reclosers market growth rate in Tanzania.
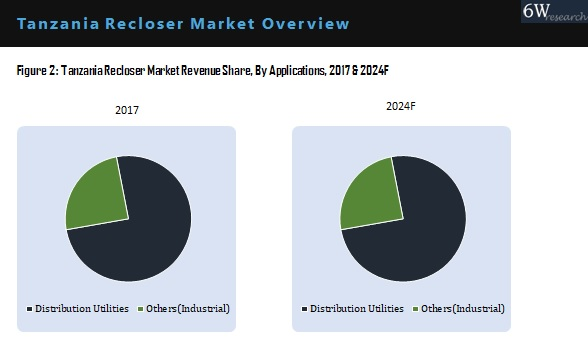
Market Analysis By Applications
The distribution utilities application acquired the highest revenue share in the overall Tanzania Recloser market. Additionally, other natural gas power plants are also under construction, to meet the energy demand in the country, which further reinforces the growth prospects for recloser market in Tanzania.
Key Attractiveness of the Report
- COVID-19 Impact on the Market.
- 6 Years Market Numbers.
- Estimated Data Starting from 2018 to 2024F.
- Base Year: 2017
- Forecast Data Until 2024F.
- Key Performance Indicators Impacting the Market.
- Major Upcoming Developments and Projects.
Key Highlights of the Report:
- Tanzania Recloser Market Overview
- Tanzania Recloser Market Outlook
- Tanzania Recloser Market Forecast
- Historical Data of Tanzania Recloser Market Revenues for the Period, 2014-2017
- Tanzania Recloser Market Size & Tanzania Recloser Market Forecast, until 2024
- Historical Data of Tanzania Recloser Market Revenues for the Period, 2014-2017
- Market Size & Forecast of Tanzania Recloser Market Revenues, until 2024
- Historical Data of Tanzania Recloser Market Revenues for the Period, 2014-2017
- Market Size & Forecast of Tanzania Recloser Market Revenues, until 2024
- Historical Data of Tanzania Recloser Market Revenues by Voltage Type for the Period, 2014-2017
- Market Size & Forecast of Tanzania Recloser Market Revenues, until 2024
- Historical Data of Tanzania Recloser Market Revenues by Voltage Type for the Period, 2014-2017
- Market Size & Forecast of Tanzania Recloser Market Revenues by Voltage Type, until 2024
- Historical Data of Tanzania Recloser Market Revenues by Voltage Type for the Period, 2014-2017
- Market Size & Forecast of Tanzania Recloser Market Revenues by Voltage Type, until 2024
- Historical Data of Tanzania Recloser Market Revenues by Voltage Type for the Period, 2014-2017
- Market Size & Forecast of Tanzania Recloser Market Revenues by Voltage Type, until 2024
- Market Drivers and Restraints
- Tanzania Recloser Market Trends and Developments
- Tanzania Recloser Market Overview on Competitive Landscape
- Tanzania Recloser Market Share, By Players
- Strategic Recommendations
Market Scope and Segmentation
Thereportprovides a detailed analysis of the following market segments:
- By Voltage Ratings
- < 27 KV
- 27 KV and Above
- By Insulation Types:
- Gas
- Vacuum
- Others
- By Applications:
- Power Distribution
- Industrial
- By End Users:
- Distribution Utilities
- Others (Railway and Industrial)
Frequently Asked Questions About the Market Study (FAQs):
6Wresearch actively monitors the Tanzania Recloser Market and publishes its comprehensive annual report, highlighting emerging trends, growth drivers, revenue analysis, and forecast outlook. Our insights help businesses to make data-backed strategic decisions with ongoing market dynamics. Our analysts track relevent industries related to the Tanzania Recloser Market, allowing our clients with actionable intelligence and reliable forecasts tailored to emerging regional needs.
Yes, we provide customisation as per your requirements. To learn more, feel free to contact us on sales@6wresearch.com
| 1. Executive Summary |
| 2. Introduction |
| 2.1. Report Description |
| 2.2. Key Highlights of the Report |
| 2.3. Market Scope & Segmentation |
| 2.4. Methodology Adopted and Key Data Points |
| 2.5. Assumptions |
| 3. Tanzania Recloser Market Overview |
| 3.1. Tanzania Recloser Market Revenues, 2014-2024F |
| 3.2. Tanzania Recloser Market Revenue Share, 2017 & 2024 |
| 3.3. Tanzania Recloser Market - Industry Life Cycle, 2017 |
| 3.4. Tanzania Recloser Market - Porter's Five Forces, 2017 |
| 4. Tanzania Recloser Market Dynamics |
| 4.1. Market Dynamics & Impact Analysis |
| 4.2. Market Drivers |
| 4.3. Market Restraints |
| 5. Tanzania Recloser Market Trends |
| 6. Tanzania Country Indicators |
| 6.1 Tanzania Recloser Market Overview |
| 6.2 Tanzania Recloser Market Revenues, 2014-2024 |
| 6.3 Tanzania Recloser Market Revenue Share, By Insulation, 2017 & 2024F |
| 6.4 Tanzania Recloser Market Revenue Share, By Voltage Rating, 2017 & 2024F |
| 6.5 Tanzania Recloser Market Revenue Share, By Applications, 2017 & 2024F |
| 6.6 Tanzania Recloser Market Revenues, By Insulation, 2014-2024 |
| 6.7 Tanzania Recloser Market Revenues, By Voltage, 2014-2024 |
| 6.8 Tanzania Recloser Market Revenues, By Applications, 2014-2024 |
| 7. Tanzania Recloser Market Key Performance Indicator |
| 7.1 Tanzania Construction Sector Outlook |
| 7.2 Tanzania Power Sector Overview |
| 8. Tanzania Recloser Market Opportunity Assessment |
| 8.1 Tanzania Recloser Market Opportunity Assessment, 2024 |
| 9. Competitive Landscape |
| 9.1 Tanzania Recloser Market Revenue Share, By Company, 2017 |
| 10. Company Profiles |
| 10.1. Schneider Electric SE |
| 10.2. ABB Ltd. |
| 10.3. Hubbell Incorporated |
| 10.4. Efacec Power Solutions, SA. |
| 10.5. Tavrida Electric AG |
| 10.6. Ghorit Electrical Co., Ltd |
| 10.7. Siemens AG |
| 10.8. NOJA Power Switchgear Pty Ltd |
| 10.9. G&W Electric Co. |
| 11. Strategic Recommendations |
| 12. Disclaimer |
| List of Figures |
| 1. Tanzania Recloser Market Revenue Share, By Insulation, 2017 & 2024F |
| 2. Tanzania Recloser Market Revenue Share, By Voltage Rating, 2017 & 2024F |
| 3. Tanzania Recloser Market Revenue Share, By Applications, 2017 & 2024F |
| 4. Tanzania Gas Insulated Load Break Switch Market Revenues, 2014-2024F ($ Million) |
| 5. Tanzania Vacuum Insulated Load Break Switch Market Revenues, 2014-2024F ($ Million) |
| 6. Tanzania Below 27kV Load Break Switch Market Revenues, 2014-2024F ($ Million) |
| 7. Tanzania Above 27 kV Load Break Switch Market Revenues, 2014-2024F ($ Million) |
| 8. Tanzania Recloser Market Revenues, By Power Distribution Applications, 2014-2024F ($ Million) |
| 9. Tanzania Recloser Market Revenues, By Industrial Applications, 2014-2024F ($ Million) |
| List of Tables |
| 1. Tanzania Upcoming Renewable Energy Sector Projects |
| 2. Tanzania Planned Transmission Interconnection Projects (380 KV) |
| 3. Tanzania Upcoming Oil & Gas Projects |
| 4. Upcoming Construction Projects |
Global Go To Market Strategy - 2030
Export potential enables firms to identify high-growth global markets with greater confidence by combining advanced trade intelligence with a structured quantitative methodology. The framework analyzes emerging demand trends and country-level import patterns while integrating macroeconomic and trade datasets such as GDP and population forecasts, bilateral import–export flows, tariff structures, elasticity differentials between developed and developing economies, geographic distance, and import demand projections. Using weighted trade values from 2020–2024 as the base period to project country-to-country export potential for 2030, these inputs are operationalized through calculated drivers such as gravity model parameters, tariff impact factors, and projected GDP per-capita growth. Through an analysis of hidden potentials, demand hotspots, and market conditions that are most favorable to success, this method enables firms to focus on target countries, maximize returns, and global expansion with data, backed by accuracy.
By factoring in the projected importer demand gap that is currently unmet and could be potential opportunity, it identifies the potential for the Exporter (Country) among 190 countries, against the general trade analysis, which identifies the biggest importer or exporter.
To discover high-growth global markets and optimize your business strategy:
Click Here
Pricing
- Single User License$ 1,995
- Department License$ 2,400
- Site License$ 3,120
- Global License$ 3,795

Leadership Perspectives from Industry Events
Search
Thought Leadership and Analyst Meet


Our Clients
6WResearch In News
- India Export Attractiveness Tracker 2026
- India Air Conditioner Market Set for Strong Rebound in 2026 After Weather-Led Correction and GST-Driven Recovery: 6Wresearch
- ADAS in India: How Automatic Emergency Braking, Blind Spot Detection & Driver Monitoring are Transforming Road Safety
- Doha a strategic location for EV manufacturing hub: IPA Qatar
- Demand for luxury TVs surging in the GCC, says Samsung
- Empowering Growth: The Thriving Journey of Bangladesh’s Cable Industry
Latest Reports
- Nicaragua RPG Gaming Market (2026-2032)
- New Zealand RPG Gaming Market (2026-2032)
- Netherlands RPG Gaming Market (2026-2032)
- Nauru RPG Gaming Market (2026-2032)
- Namibia RPG Gaming Market (2026-2032)
- Mozambique RPG Gaming Market (2026-2032)
- Montenegro RPG Gaming Market (2026-2032)
- Mongolia RPG Gaming Market (2026-2032)
- Monaco RPG Gaming Market (2026-2032)
- Micronesia RPG Gaming Market (2026-2032)
Industry Events and Analyst Meet

EV India Expo 2026

HIMTEX 2026

India Refining Summit 2026

India EV Show 2026

EV tech India Expo 2026
Whitepaper
- Middle East & Africa Commercial Security Market Click here to view more.
- Middle East & Africa Fire Safety Systems & Equipment Market Click here to view more.
- GCC Drone Market Click here to view more.
- Middle East Lighting Fixture Market Click here to view more.
- GCC Physical & Perimeter Security Market Click here to view more.