Togo Reverse Osmosis (RO) Membrane Market (2026-2032) | Segmentation, Industry, Analysis, Size, Trends, Share, Value, Outlook, Revenue, Forecast, Growth & Companies
Market Forecast By Type (Thin-film composite membranes, Cellulose based membranes), By End Use Industry (Water & Wastewater treatment, Industrial Processing), By Application (Desalination, Utility water treatment, Wastewater treatment & reuse, Process water), By Filter Module (Spiral Wound, Hollow Fiber, Tubular, Plate and Frame) And Competitive Landscape
| Product Code: ETC5752211 | Publication Date: Nov 2023 | Updated Date: Apr 2026 | Product Type: Market Research Report | |
| Publisher: 6Wresearch | Author: Ravi Bhandari | No. of Pages: 60 | No. of Figures: 30 | No. of Tables: 5 |
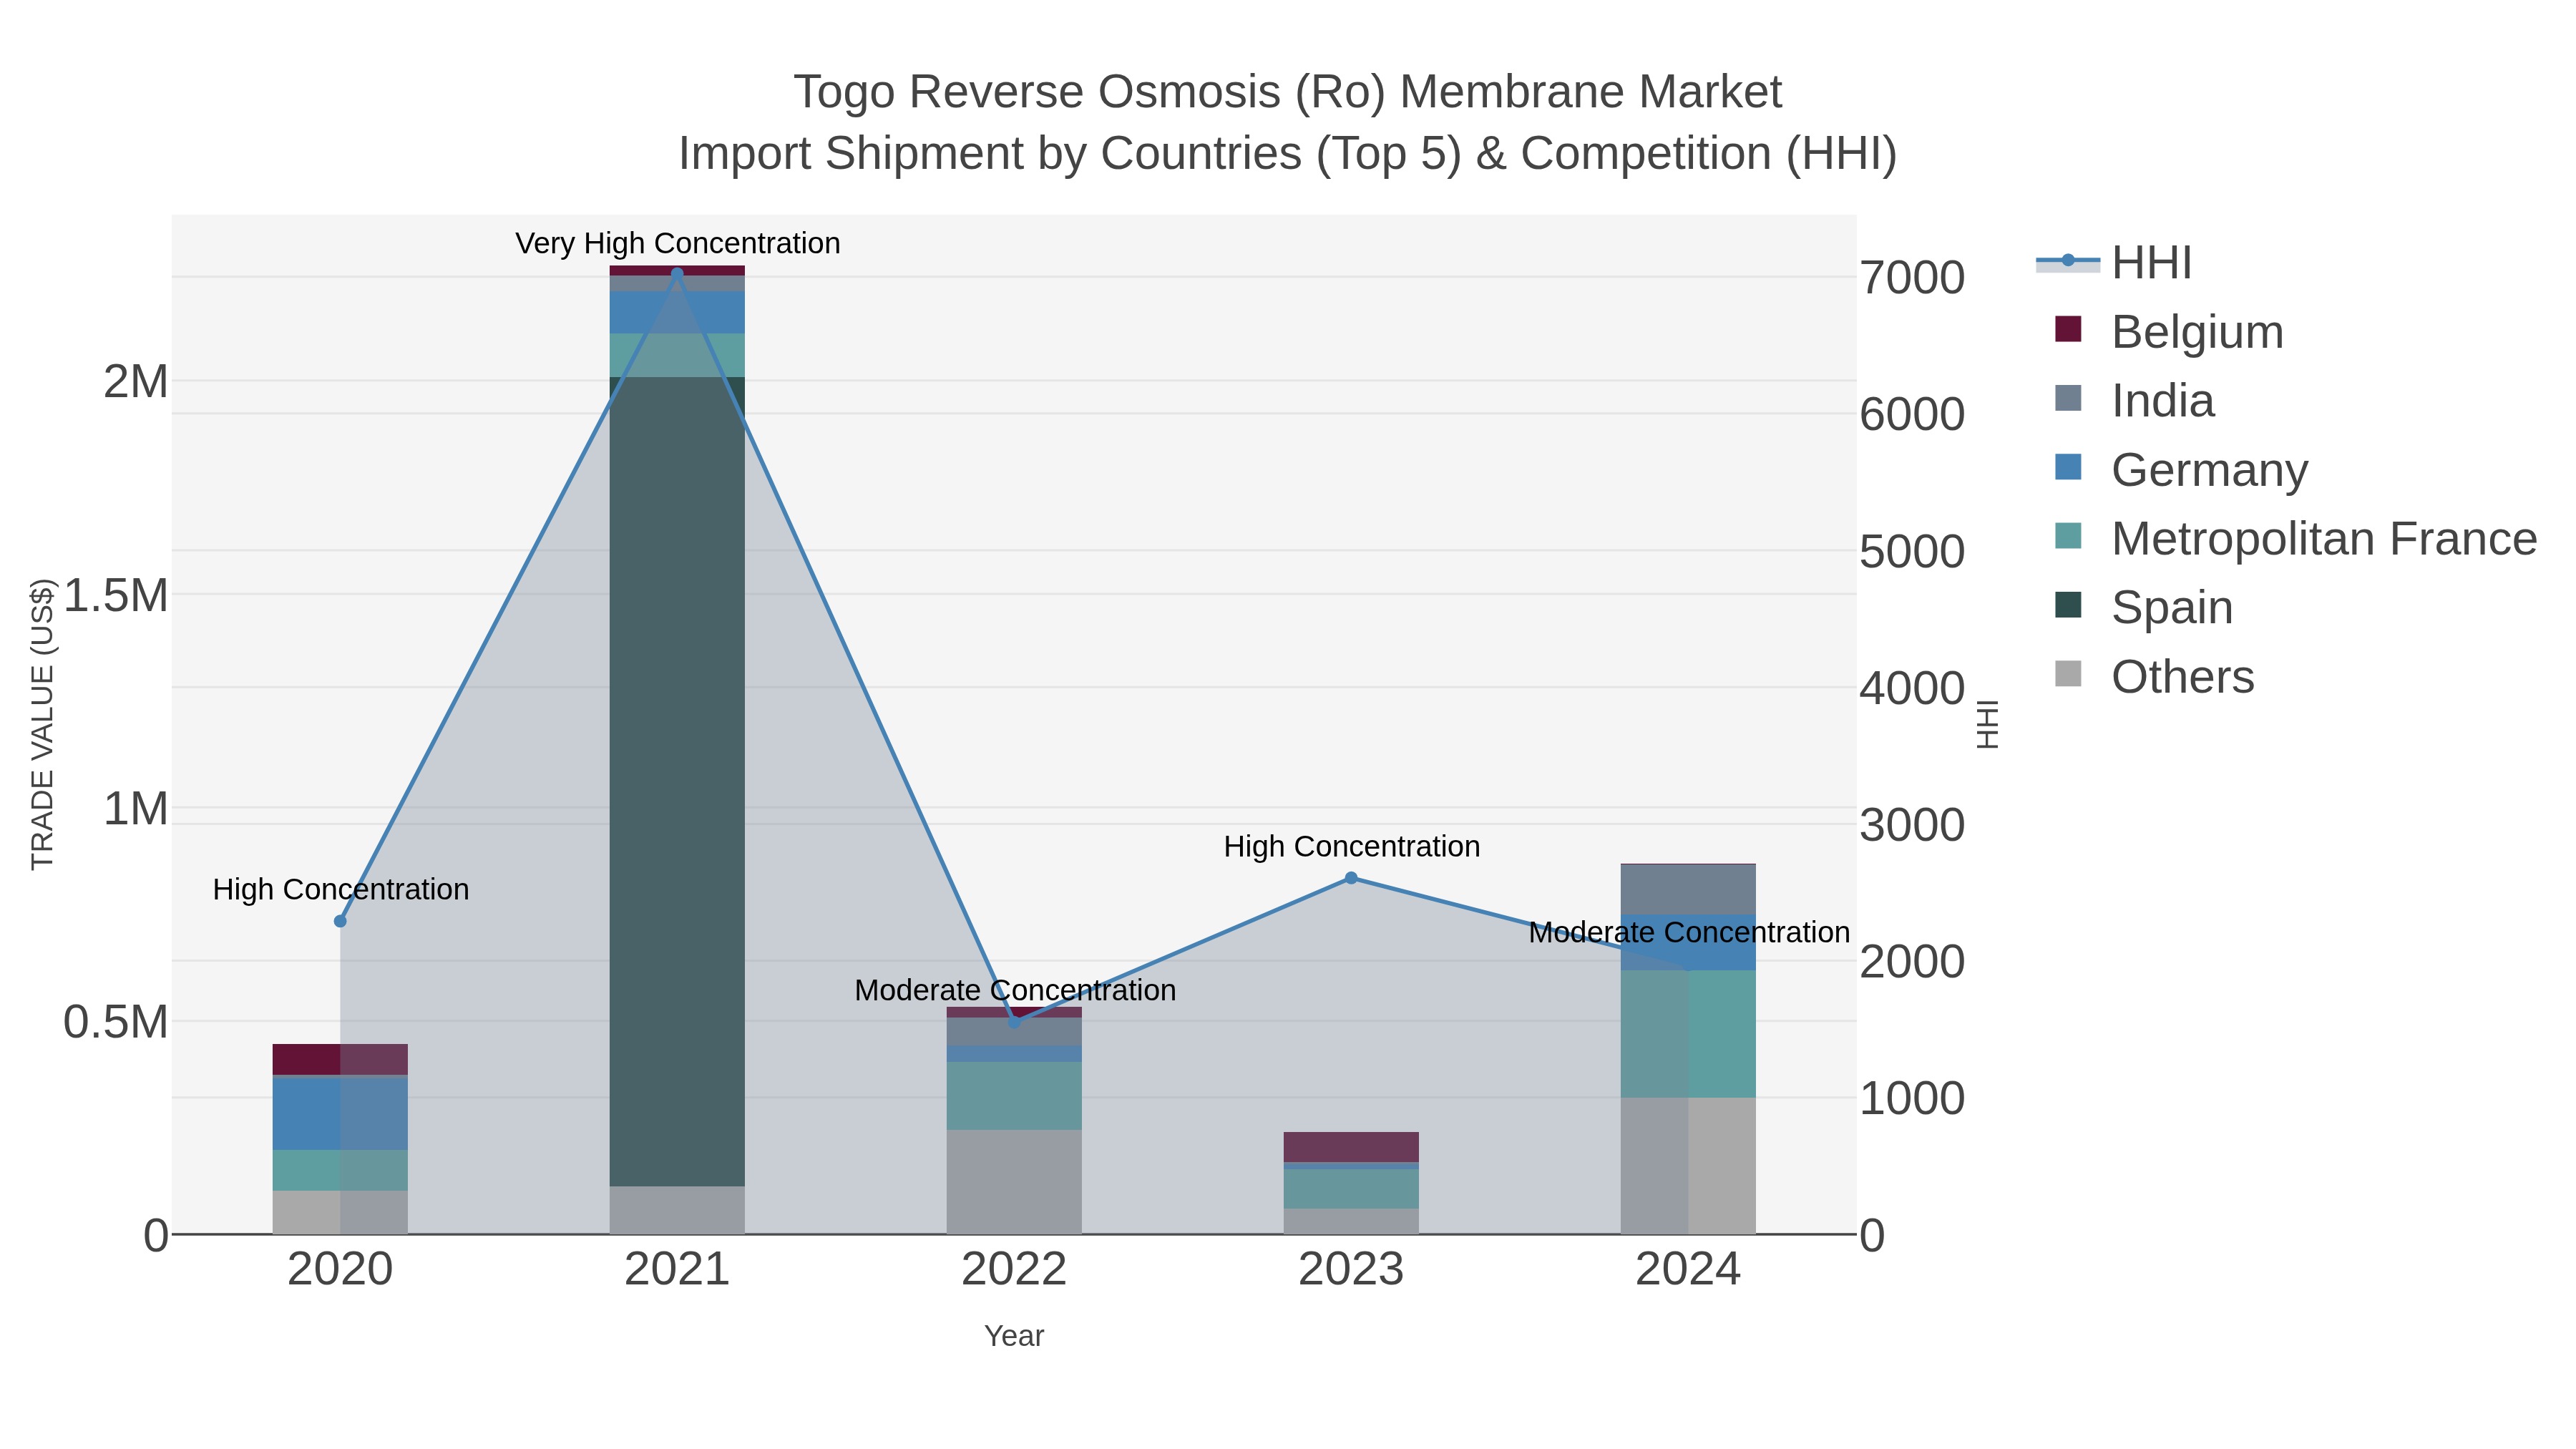
Togo Reverse Osmosis Ro Membrane Market Top 5 Importing Countries and Market Competition (HHI) Analysis
The Togo reverse osmosis (RO) membrane import market experienced steady shipments in 2024, with top exporting countries being Metropolitan France, Germany, Netherlands, India, and Portugal. The Herfindahl-Hirschman Index (HHI) indicated very low market concentration, suggesting a diverse import market landscape. While specific growth rate data was not available for the period 2023-2024, the market is likely maintaining stability. This data highlights the importance of these key exporting countries in supplying RO membranes to Togo, catering to the country`s water purification needs.
Key Highlights of the Report:
- Togo Reverse Osmosis (RO) Membrane Market Outlook
- Market Size of Togo Reverse Osmosis (RO) Membrane Market, 2025
- Forecast of Togo Reverse Osmosis (RO) Membrane Market, 2032
- Historical Data and Forecast of Togo Reverse Osmosis (RO) Membrane Revenues & Volume for the Period 2022 - 2032F
- Togo Reverse Osmosis (RO) Membrane Market Trend Evolution
- Togo Reverse Osmosis (RO) Membrane Market Drivers and Challenges
- Togo Reverse Osmosis (RO) Membrane Price Trends
- Togo Reverse Osmosis (RO) Membrane Porter`s Five Forces
- Togo Reverse Osmosis (RO) Membrane Industry Life Cycle
- Historical Data and Forecast of Togo Reverse Osmosis (RO) Membrane Market Revenues & Volume By Type for the Period 2022 - 2032F
- Historical Data and Forecast of Togo Reverse Osmosis (RO) Membrane Market Revenues & Volume By Thin-film composite membranes for the Period 2022 - 2032F
- Historical Data and Forecast of Togo Reverse Osmosis (RO) Membrane Market Revenues & Volume By Cellulose based membranes for the Period 2022 - 2032F
- Historical Data and Forecast of Togo Reverse Osmosis (RO) Membrane Market Revenues & Volume By End Use Industry for the Period 2022 - 2032F
- Historical Data and Forecast of Togo Reverse Osmosis (RO) Membrane Market Revenues & Volume By Water & Wastewater treatment for the Period 2022 - 2032F
- Historical Data and Forecast of Togo Reverse Osmosis (RO) Membrane Market Revenues & Volume By Industrial Processing for the Period 2022 - 2032F
- Historical Data and Forecast of Togo Reverse Osmosis (RO) Membrane Market Revenues & Volume By Application for the Period 2022 - 2032F
- Historical Data and Forecast of Togo Reverse Osmosis (RO) Membrane Market Revenues & Volume By Desalination for the Period 2022 - 2032F
- Historical Data and Forecast of Togo Reverse Osmosis (RO) Membrane Market Revenues & Volume By Utility water treatment for the Period 2022 - 2032F
- Historical Data and Forecast of Togo Reverse Osmosis (RO) Membrane Market Revenues & Volume By Wastewater treatment & reuse for the Period 2022 - 2032F
- Historical Data and Forecast of Togo Reverse Osmosis (RO) Membrane Market Revenues & Volume By Process water for the Period 2022 - 2032F
- Historical Data and Forecast of Togo Reverse Osmosis (RO) Membrane Market Revenues & Volume By Filter Module for the Period 2022 - 2032F
- Historical Data and Forecast of Togo Reverse Osmosis (RO) Membrane Market Revenues & Volume By Spiral Wound for the Period 2022 - 2032F
- Historical Data and Forecast of Togo Reverse Osmosis (RO) Membrane Market Revenues & Volume By Hollow Fiber for the Period 2022 - 2032F
- Historical Data and Forecast of Togo Reverse Osmosis (RO) Membrane Market Revenues & Volume By Tubular for the Period 2022 - 2032F
- Historical Data and Forecast of Togo Reverse Osmosis (RO) Membrane Market Revenues & Volume By Plate and Frame for the Period 2022 - 2032F
- Togo Reverse Osmosis (RO) Membrane Import Export Trade Statistics
- Market Opportunity Assessment By Type
- Market Opportunity Assessment By End Use Industry
- Market Opportunity Assessment By Application
- Market Opportunity Assessment By Filter Module
- Togo Reverse Osmosis (RO) Membrane Top Companies Market Share
- Togo Reverse Osmosis (RO) Membrane Competitive Benchmarking By Technical and Operational Parameters
- Togo Reverse Osmosis (RO) Membrane Company Profiles
- Togo Reverse Osmosis (RO) Membrane Key Strategic Recommendations
Frequently Asked Questions About the Market Study (FAQs):
6Wresearch actively monitors the Togo Reverse Osmosis (RO) Membrane Market and publishes its comprehensive annual report, highlighting emerging trends, growth drivers, revenue analysis, and forecast outlook. Our insights help businesses to make data-backed strategic decisions with ongoing market dynamics. Our analysts track relevent industries related to the Togo Reverse Osmosis (RO) Membrane Market, allowing our clients with actionable intelligence and reliable forecasts tailored to emerging regional needs.
Yes, we provide customisation as per your requirements. To learn more, feel free to contact us on sales@6wresearch.com
1 Executive Summary |
2 Introduction |
2.1 Key Highlights of the Report |
2.2 Report Description |
2.3 Market Scope & Segmentation |
2.4 Research Methodology |
2.5 Assumptions |
3 Togo Reverse Osmosis (RO) Membrane Market Overview |
3.1 Togo Country Macro Economic Indicators |
3.2 Togo Reverse Osmosis (RO) Membrane Market Revenues & Volume, 2022 & 2032F |
3.3 Togo Reverse Osmosis (RO) Membrane Market - Industry Life Cycle |
3.4 Togo Reverse Osmosis (RO) Membrane Market - Porter's Five Forces |
3.5 Togo Reverse Osmosis (RO) Membrane Market Revenues & Volume Share, By Type, 2022 & 2032F |
3.6 Togo Reverse Osmosis (RO) Membrane Market Revenues & Volume Share, By End Use Industry, 2022 & 2032F |
3.7 Togo Reverse Osmosis (RO) Membrane Market Revenues & Volume Share, By Application, 2022 & 2032F |
3.8 Togo Reverse Osmosis (RO) Membrane Market Revenues & Volume Share, By Filter Module, 2022 & 2032F |
4 Togo Reverse Osmosis (RO) Membrane Market Dynamics |
4.1 Impact Analysis |
4.2 Market Drivers |
4.2.1 Increasing awareness about water quality and health concerns driving demand for efficient water treatment solutions. |
4.2.2 Growing industrial applications such as pharmaceuticals, food beverage, and power generation requiring high-quality water for processes. |
4.2.3 Government initiatives promoting the use of reverse osmosis membranes for water purification and conservation. |
4.3 Market Restraints |
4.3.1 High initial investment costs associated with installing reverse osmosis membrane systems. |
4.3.2 Lack of skilled workforce for proper maintenance and operation of reverse osmosis systems. |
4.3.3 Environmental concerns related to the disposal of brine concentrate generated during the reverse osmosis process. |
5 Togo Reverse Osmosis (RO) Membrane Market Trends |
6 Togo Reverse Osmosis (RO) Membrane Market Segmentations |
6.1 Togo Reverse Osmosis (RO) Membrane Market, By Type |
6.1.1 Overview and Analysis |
6.1.2 Togo Reverse Osmosis (RO) Membrane Market Revenues & Volume, By Thin-film composite membranes, 2022 - 2032F |
6.1.3 Togo Reverse Osmosis (RO) Membrane Market Revenues & Volume, By Cellulose based membranes, 2022 - 2032F |
6.2 Togo Reverse Osmosis (RO) Membrane Market, By End Use Industry |
6.2.1 Overview and Analysis |
6.2.2 Togo Reverse Osmosis (RO) Membrane Market Revenues & Volume, By Water & Wastewater treatment, 2022 - 2032F |
6.2.3 Togo Reverse Osmosis (RO) Membrane Market Revenues & Volume, By Industrial Processing, 2022 - 2032F |
6.3 Togo Reverse Osmosis (RO) Membrane Market, By Application |
6.3.1 Overview and Analysis |
6.3.2 Togo Reverse Osmosis (RO) Membrane Market Revenues & Volume, By Desalination, 2022 - 2032F |
6.3.3 Togo Reverse Osmosis (RO) Membrane Market Revenues & Volume, By Utility water treatment, 2022 - 2032F |
6.3.4 Togo Reverse Osmosis (RO) Membrane Market Revenues & Volume, By Wastewater treatment & reuse, 2022 - 2032F |
6.3.5 Togo Reverse Osmosis (RO) Membrane Market Revenues & Volume, By Process water, 2022 - 2032F |
6.4 Togo Reverse Osmosis (RO) Membrane Market, By Filter Module |
6.4.1 Overview and Analysis |
6.4.2 Togo Reverse Osmosis (RO) Membrane Market Revenues & Volume, By Spiral Wound, 2022 - 2032F |
6.4.3 Togo Reverse Osmosis (RO) Membrane Market Revenues & Volume, By Hollow Fiber, 2022 - 2032F |
6.4.4 Togo Reverse Osmosis (RO) Membrane Market Revenues & Volume, By Tubular, 2022 - 2032F |
6.4.5 Togo Reverse Osmosis (RO) Membrane Market Revenues & Volume, By Plate and Frame, 2022 - 2032F |
7 Togo Reverse Osmosis (RO) Membrane Market Import-Export Trade Statistics |
7.1 Togo Reverse Osmosis (RO) Membrane Market Export to Major Countries |
7.2 Togo Reverse Osmosis (RO) Membrane Market Imports from Major Countries |
8 Togo Reverse Osmosis (RO) Membrane Market Key Performance Indicators |
8.1 Water recovery rate: Measure of how efficiently the reverse osmosis membrane system is able to recover purified water from the feed water. |
8.2 Membrane fouling rate: Indicates the rate at which the membranes get fouled or clogged, impacting the efficiency of the reverse osmosis system. |
8.3 Energy consumption per unit of water produced: Evaluates the energy efficiency of the reverse osmosis system, crucial for sustainability and operational costs. |
9 Togo Reverse Osmosis (RO) Membrane Market - Opportunity Assessment |
9.1 Togo Reverse Osmosis (RO) Membrane Market Opportunity Assessment, By Type, 2022 & 2032F |
9.2 Togo Reverse Osmosis (RO) Membrane Market Opportunity Assessment, By End Use Industry, 2022 & 2032F |
9.3 Togo Reverse Osmosis (RO) Membrane Market Opportunity Assessment, By Application, 2022 & 2032F |
9.4 Togo Reverse Osmosis (RO) Membrane Market Opportunity Assessment, By Filter Module, 2022 & 2032F |
10 Togo Reverse Osmosis (RO) Membrane Market - Competitive Landscape |
10.1 Togo Reverse Osmosis (RO) Membrane Market Revenue Share, By Companies, 2025 |
10.2 Togo Reverse Osmosis (RO) Membrane Market Competitive Benchmarking, By Operating and Technical Parameters |
11 Company Profiles |
12 Recommendations | 13 Disclaimer |
Global Go To Market Strategy - 2030
Export potential enables firms to identify high-growth global markets with greater confidence by combining advanced trade intelligence with a structured quantitative methodology. The framework analyzes emerging demand trends and country-level import patterns while integrating macroeconomic and trade datasets such as GDP and population forecasts, bilateral import–export flows, tariff structures, elasticity differentials between developed and developing economies, geographic distance, and import demand projections. Using weighted trade values from 2020–2024 as the base period to project country-to-country export potential for 2030, these inputs are operationalized through calculated drivers such as gravity model parameters, tariff impact factors, and projected GDP per-capita growth. Through an analysis of hidden potentials, demand hotspots, and market conditions that are most favorable to success, this method enables firms to focus on target countries, maximize returns, and global expansion with data, backed by accuracy.
By factoring in the projected importer demand gap that is currently unmet and could be potential opportunity, it identifies the potential for the Exporter (Country) among 190 countries, against the general trade analysis, which identifies the biggest importer or exporter.
To discover high-growth global markets and optimize your business strategy:
Click Here
Pricing
- Single User License$ 1,995
- Department License$ 2,400
- Site License$ 3,120
- Global License$ 3,795

Leadership Perspectives from Industry Events
Search
Thought Leadership and Analyst Meet


Our Clients
6WResearch In News
- India Export Attractiveness Tracker 2026
- India Air Conditioner Market Set for Strong Rebound in 2026 After Weather-Led Correction and GST-Driven Recovery: 6Wresearch
- ADAS in India: How Automatic Emergency Braking, Blind Spot Detection & Driver Monitoring are Transforming Road Safety
- Doha a strategic location for EV manufacturing hub: IPA Qatar
- Demand for luxury TVs surging in the GCC, says Samsung
- Empowering Growth: The Thriving Journey of Bangladesh’s Cable Industry
Latest Reports
- Nicaragua RPG Gaming Market (2026-2032)
- New Zealand RPG Gaming Market (2026-2032)
- Netherlands RPG Gaming Market (2026-2032)
- Nauru RPG Gaming Market (2026-2032)
- Namibia RPG Gaming Market (2026-2032)
- Mozambique RPG Gaming Market (2026-2032)
- Montenegro RPG Gaming Market (2026-2032)
- Mongolia RPG Gaming Market (2026-2032)
- Monaco RPG Gaming Market (2026-2032)
- Micronesia RPG Gaming Market (2026-2032)
Industry Events and Analyst Meet

EV India Expo 2026

HIMTEX 2026

India Refining Summit 2026

India EV Show 2026

EV tech India Expo 2026
Whitepaper
- Middle East & Africa Commercial Security Market Click here to view more.
- Middle East & Africa Fire Safety Systems & Equipment Market Click here to view more.
- GCC Drone Market Click here to view more.
- Middle East Lighting Fixture Market Click here to view more.
- GCC Physical & Perimeter Security Market Click here to view more.