United Arab Emirates (UAE) Ferric Nitrate Market (2026-2032) Outlook | Forecast, Share, Size, Revenue, Industry, Growth, Analysis, Trends, Value & Companies
Market Forecast By Type (Laboratory Grade, Industrial Grade), By Applications (Catalyzer, Analytical Reagent, Chemical Polishing) And Competitive Landscape
| Product Code: ETC200572 | Publication Date: May 2022 | Updated Date: Jul 2026 | Product Type: Market Research Report | |
| Publisher: 6Wresearch | Author: Ravi Bhandari | No. of Pages: 60 | No. of Figures: 40 | No. of Tables: 7 |
United Arab Emirates (UAE) Ferric Nitrate Market Size, Share & Growth Rate
The United Arab Emirates (UAE) Ferric Nitrate Market was estimated at USD 344 Million in 2025 and is projected to reach USD 488 Million by 2032, growing at a CAGR of 5.1% from 2026 to 2032. This growth trajectory is underpinned by the escalating demand for ferric nitrate across critical sectors such as water treatment and ceramics, where its purifying and enhancing properties are invaluable. Additionally, the surge in environmental regulations and increased focus on sustainable manufacturing practices are further propelling the market forward.
United Arab Emirates (UAE) Ferric Nitrate Market Year-wise Growth Rate and Key Drivers
This graph highlights how the United Arab Emirates (UAE) Ferric Nitrate Market has steadily grown over the years, supported by major growth factors.
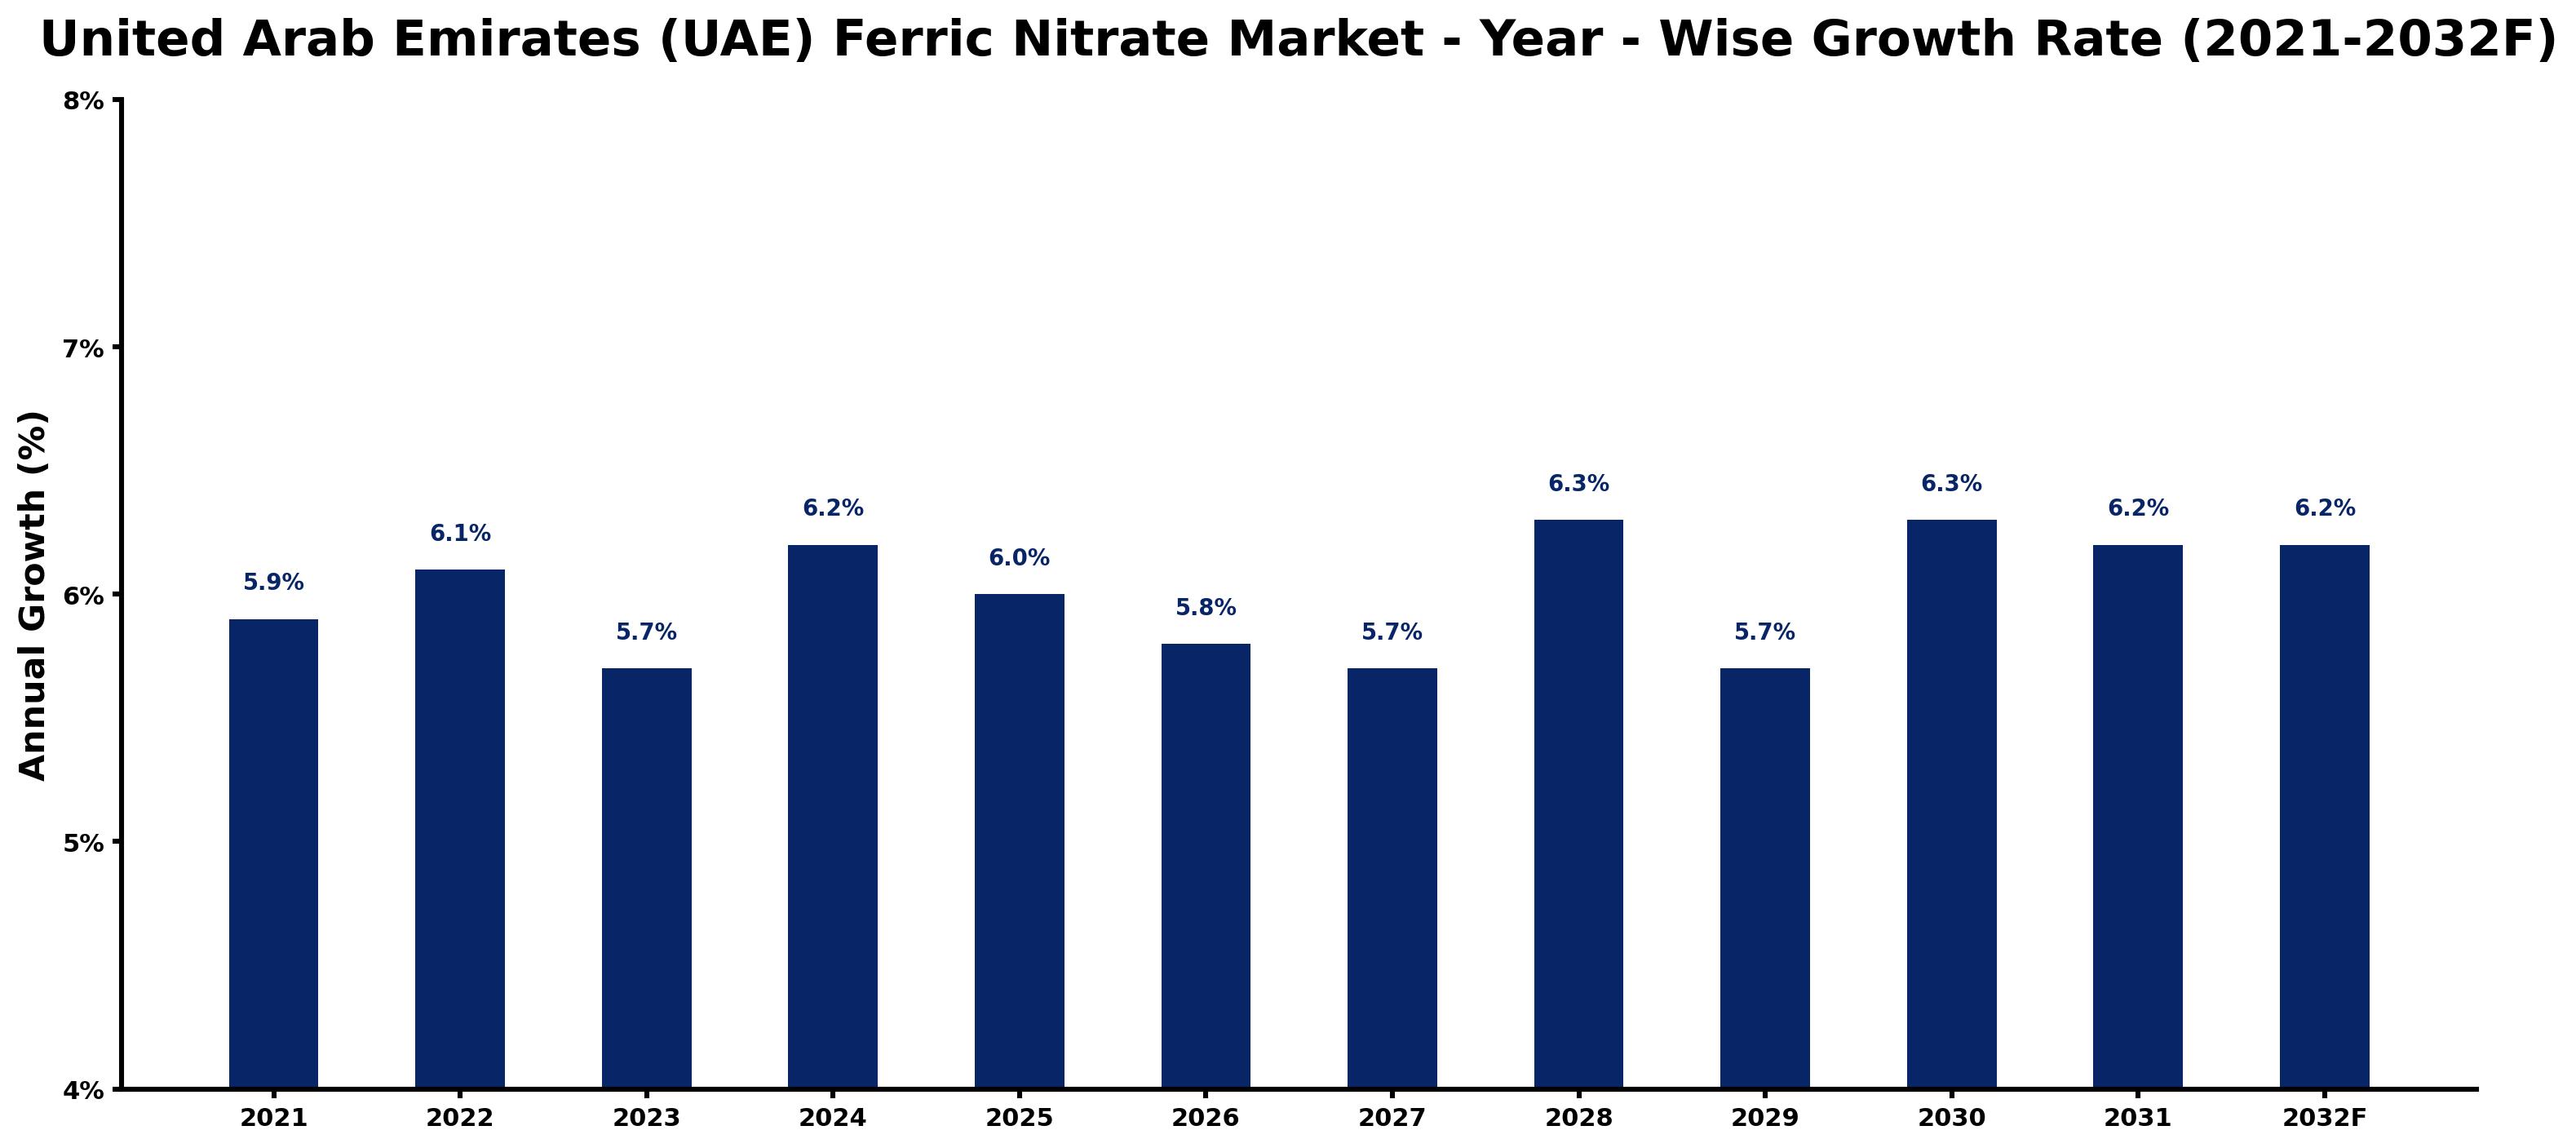
The table below presents the year‑wise growth rates along with the key drivers influencing the market
| Year | Growth Rate | Major Drivers |
| 2021 | 5.9% | Rising industrial production levels |
| 2022 | 6.1% | Increased agricultural sector investments |
| 2023 | 5.7% | Growing demand for specialty chemicals |
| 2024 | 6.2% | Expansion of water treatment facilities |
| 2025 | 6.0% | Enhanced focus on sustainable practices |
| 2026 | 5.8% | Boost in construction sector activities |
| 2027 | 5.7% | Surge in pharmaceutical manufacturing needs |
| 2028 | 6.3% | Emergence of new market applications |
| 2029 | 5.7% | Higher consumer electronics production |
| 2030 | 6.3% | Growing renewable energy initiatives |
| 2031 | 6.2% | Strengthening export market opportunities |
| 2032 | 6.2% | Advancements in research and development |
Note: Market size estimations and growth projections presented in this report are based on 6Wresearch's proprietary forecasting methodology, utilizing the latest available industry data, government publications, and primary research inputs.
United Arab Emirates (UAE) Ferric Nitrate Market Synopsis
The UAE's ferric nitrate market is characterized by its significant application in water treatment processes, where it plays a crucial role in removing impurities and improving water quality. This specific demand is further amplified by governmental initiatives aiming to enhance water safety and sustainability in the region.
Moreover, the ceramics industry in the UAE is expanding, leveraging ferric nitrate to improve the properties of ceramic products. As manufacturing practices evolve, the compounds role as a laboratory reagent in analytical chemistry continues to gain prominence, driving further growth in the market.
United Arab Emirates (UAE) Ferric Nitrate Market Key Takeaways
- The market is projected to grow at a CAGR of 5.1% from 2026 to 2032, indicating strong future demand.
- Water treatment applications remain the primary driver of ferric nitrate consumption in the UAE.
- Expansion in the ceramics industry is creating additional opportunities for ferric nitrate usage.
- Regulatory pressures are encouraging the adoption of environmentally friendly materials.
- The role of ferric nitrate as a laboratory reagent is gaining importance within analytical chemistry.
Evaluation of Restraints in United Arab Emirates (UAE) Ferric Nitrate Market
Despite its robust growth, the UAE ferric nitrate market faces certain limitations. Environmental concerns related to the production and disposal of ferric nitrate necessitate a careful approach to compliance with regulations. Furthermore, the market is challenged by the stability of raw material supply chains, which can hinder production capabilities. Companies must navigate these hurdles while implementing sustainable practices to remain competitive.
United Arab Emirates (UAE) Ferric Nitrate Market Trends
The current trends shaping the UAE ferric nitrate market include a growing preference for sustainable manufacturing and the increasing integration of advanced technologies in production processes. Innovations in waste management and treatment technologies are enhancing the efficiency of ferric nitrate applications, particularly in water purification. Moreover, an uptick in research activities focused on optimizing the use of ferric nitrate in ceramics and analytical applications is contributing to its evolving market landscape.
United Arab Emirates (UAE) Ferric Nitrate Market Opportunities
The UAE ferric nitrate market presents genuine growth opportunities driven by the rising demand for water treatment solutions and advancements in ceramics technology. Companies that invest in research and development to create eco-friendly variants of ferric nitrate may capture a significant share of the market. Additionally, collaborations with government bodies focused on infrastructure development and water safety can further enhance market potential.
Government Initiatives in the United Arab Emirates (UAE) Ferric Nitrate Market
Government initiatives aimed at improving water quality and environmental sustainability are playing a crucial role in the growth of the ferric nitrate market. Programs focused on enhancing water treatment facilities and stringent regulations regarding industrial waste management drive the demand for effective chemical solutions like ferric nitrate. Furthermore, public investments in research and development of new technologies are expected to support market expansion.
Future Insights of the United Arab Emirates (UAE) Ferric Nitrate Market
Looking ahead to 2026-2032, the UAE ferric nitrate market is anticipated to flourish as industries increasingly prioritize sustainable solutions. The growing need for effective water treatment processes and the expansion of the ceramics sector will be key growth drivers. Furthermore, the ongoing adaptation of businesses to meet regulatory requirements will enhance the market's appeal to investors and stakeholders alike.
United Arab Emirates (UAE) Ferric Nitrate Market Latest Developments (2025 - 2026)
Recent developments in the UAE ferric nitrate market indicate a shift towards enhanced production methods and sustainability practices. Companies are focusing on innovative technologies to improve efficiency while adhering to environmental regulations. Additionally, there has been an uptick in collaborations between private and public sectors to develop advanced water treatment solutions, aligning with national goals for environmental safety and resource management.
United Arab Emirates (UAE) Ferric Nitrate Market - Key Attractiveness of the Report
- 10 Years of Market Numbers
- Historical Data Starting from 2022 to 2025
- Base Year: 2025
- Forecast Data until 2032
- Key Performance Indicators Impacting the Market
- Major Upcoming Developments and Projects
Key Highlights of the Report:
- United Arab Emirates (UAE) Ferric Nitrate Market Outlook
- Market Size of United Arab Emirates (UAE) Ferric Nitrate Market, 2025
- Forecast of United Arab Emirates (UAE) Ferric Nitrate Market, 2032
- Historical Data and Forecast of United Arab Emirates (UAE) Ferric Nitrate Revenues & Volume for the Period 2022-2032F
- United Arab Emirates (UAE) Ferric Nitrate Market Trend Evolution
- United Arab Emirates (UAE) Ferric Nitrate Market Drivers and Challenges
- United Arab Emirates (UAE) Ferric Nitrate Price Trends
- United Arab Emirates (UAE) Ferric Nitrate Porter's Five Forces
- United Arab Emirates (UAE) Ferric Nitrate Industry Life Cycle
- Historical Data and Forecast of United Arab Emirates (UAE) Ferric Nitrate Market Revenues & Volume By Type for the Period 2022-2032F
- Historical Data and Forecast of United Arab Emirates (UAE) Ferric Nitrate Market Revenues & Volume By Laboratory Grade for the Period 2022-2032F
- Historical Data and Forecast of United Arab Emirates (UAE) Ferric Nitrate Market Revenues & Volume By Industrial Grade for the Period 2022-2032F
- Historical Data and Forecast of United Arab Emirates (UAE) Ferric Nitrate Market Revenues & Volume By Applications for the Period 2022-2032F
- Historical Data and Forecast of United Arab Emirates (UAE) Ferric Nitrate Market Revenues & Volume By Catalyzer for the Period 2022-2032F
- Historical Data and Forecast of United Arab Emirates (UAE) Ferric Nitrate Market Revenues & Volume By Analytical Reagent for the Period 2022-2032F
- Historical Data and Forecast of United Arab Emirates (UAE) Ferric Nitrate Market Revenues & Volume By Chemical Polishing for the Period 2022-2032F
- United Arab Emirates (UAE) Ferric Nitrate Import Export Trade Statistics
- Market Opportunity Assessment By Type
- Market Opportunity Assessment By Applications
- United Arab Emirates (UAE) Ferric Nitrate Top Companies Market Share
- United Arab Emirates (UAE) Ferric Nitrate Competitive Benchmarking By Technical and Operational Parameters
- United Arab Emirates (UAE) Ferric Nitrate Company Profiles
- United Arab Emirates (UAE) Ferric Nitrate Key Strategic Recommendations
Frequently Asked Questions About the Market Study (FAQs):
The United Arab Emirates ferric nitrate market is projected to grow from USD 344 Million in 2025 to USD 488 Million by 2032, with a CAGR of 5.1% from 2026 to 2032.
In the UAE, ferric nitrate is predominantly utilized in water treatment processes to effectively remove impurities. It also plays a significant role in enhancing the properties of ceramic products.
Key factors include the rising demand for effective water purification solutions, the expansion of the ceramics industry, and stringent environmental regulations promoting the use of sustainable materials.
Yes, the production and application of ferric nitrate require careful attention to environmental impacts. Compliance with regulations regarding waste disposal and safety measures is crucial for companies operating in this market.
Current trends include a shift towards sustainable manufacturing practices, advancements in waste management technologies, and an increased emphasis on research and development for optimizing ferric nitrate applications.
6Wresearch actively monitors the United Arab Emirates (UAE) Ferric Nitrate Market and publishes its comprehensive annual report, highlighting emerging trends, growth drivers, revenue analysis, and forecast outlook. Our insights help businesses to make data-backed strategic decisions with ongoing market dynamics. Our analysts track relevent industries related to the United Arab Emirates (UAE) Ferric Nitrate Market, allowing our clients with actionable intelligence and reliable forecasts tailored to emerging regional needs.
Yes, we provide customisation as per your requirements. To learn more, feel free to contact us on sales@6wresearch.com
1 Executive Summary |
2 Introduction |
2.1 Key Highlights of the Report |
2.2 Report Description |
2.3 Market Scope & Segmentation |
2.4 Research Methodology |
2.5 Assumptions |
3 United Arab Emirates (UAE) Ferric Nitrate Market Overview |
3.1 United Arab Emirates (UAE) Country Macro Economic Indicators |
3.2 United Arab Emirates (UAE) Ferric Nitrate Market Revenues & Volume, 2022 & 2032F |
3.3 United Arab Emirates (UAE) Ferric Nitrate Market - Industry Life Cycle |
3.4 United Arab Emirates (UAE) Ferric Nitrate Market - Porter's Five Forces |
3.5 United Arab Emirates (UAE) Ferric Nitrate Market Revenues & Volume Share, By Type, 2022 & 2032F |
3.6 United Arab Emirates (UAE) Ferric Nitrate Market Revenues & Volume Share, By Applications, 2022 & 2032F |
4 United Arab Emirates (UAE) Ferric Nitrate Market Dynamics |
4.1 Impact Analysis |
4.2 Market Drivers |
4.2.1 Increasing demand for ferric nitrate in water treatment applications due to growing concerns over water pollution and contamination |
4.2.2 Expansion of the chemical industry in the UAE, leading to higher consumption of ferric nitrate in various manufacturing processes |
4.2.3 Government initiatives towards improving infrastructure and wastewater management, driving the demand for ferric nitrate in the country |
4.3 Market Restraints |
4.3.1 Fluctuating raw material prices impacting the production cost of ferric nitrate |
4.3.2 Stringent regulations and compliance requirements related to chemical handling and disposal in the UAE |
4.3.3 Competition from alternative water treatment chemicals affecting the market growth of ferric nitrate |
5 United Arab Emirates (UAE) Ferric Nitrate Market Trends |
6 United Arab Emirates (UAE) Ferric Nitrate Market, By Types |
6.1 United Arab Emirates (UAE) Ferric Nitrate Market, By Type |
6.1.1 Overview and Analysis |
6.1.2 United Arab Emirates (UAE) Ferric Nitrate Market Revenues & Volume, By Type, 2022-2032F |
6.1.3 United Arab Emirates (UAE) Ferric Nitrate Market Revenues & Volume, By Laboratory Grade, 2022-2032F |
6.1.4 United Arab Emirates (UAE) Ferric Nitrate Market Revenues & Volume, By Industrial Grade, 2022-2032F |
6.2 United Arab Emirates (UAE) Ferric Nitrate Market, By Applications |
6.2.1 Overview and Analysis |
6.2.2 United Arab Emirates (UAE) Ferric Nitrate Market Revenues & Volume, By Catalyzer, 2022-2032F |
6.2.3 United Arab Emirates (UAE) Ferric Nitrate Market Revenues & Volume, By Analytical Reagent, 2022-2032F |
6.2.4 United Arab Emirates (UAE) Ferric Nitrate Market Revenues & Volume, By Chemical Polishing, 2022-2032F |
7 United Arab Emirates (UAE) Ferric Nitrate Market Import-Export Trade Statistics |
7.1 United Arab Emirates (UAE) Ferric Nitrate Market Export to Major Countries |
7.2 United Arab Emirates (UAE) Ferric Nitrate Market Imports from Major Countries |
8 United Arab Emirates (UAE) Ferric Nitrate Market Key Performance Indicators |
8.1 Number of new water treatment projects initiated in the UAE |
8.2 Percentage increase in the production capacity of ferric nitrate manufacturers in the UAE |
8.3 Adoption rate of ferric nitrate in key industries such as pharmaceuticals, textiles, and electronics in the UAE |
9 United Arab Emirates (UAE) Ferric Nitrate Market - Opportunity Assessment |
9.1 United Arab Emirates (UAE) Ferric Nitrate Market Opportunity Assessment, By Type, 2022 & 2032F |
9.2 United Arab Emirates (UAE) Ferric Nitrate Market Opportunity Assessment, By Applications, 2022 & 2032F |
10 United Arab Emirates (UAE) Ferric Nitrate Market - Competitive Landscape |
10.1 United Arab Emirates (UAE) Ferric Nitrate Market Revenue Share, By Companies, 2025 |
10.2 United Arab Emirates (UAE) Ferric Nitrate Market Competitive Benchmarking, By Operating and Technical Parameters |
11 Company Profiles |
12 Recommendations |
13 Disclaimer |
Global Go To Market Strategy - 2030
Export potential enables firms to identify high-growth global markets with greater confidence by combining advanced trade intelligence with a structured quantitative methodology. The framework analyzes emerging demand trends and country-level import patterns while integrating macroeconomic and trade datasets such as GDP and population forecasts, bilateral import–export flows, tariff structures, elasticity differentials between developed and developing economies, geographic distance, and import demand projections. Using weighted trade values from 2020–2024 as the base period to project country-to-country export potential for 2030, these inputs are operationalized through calculated drivers such as gravity model parameters, tariff impact factors, and projected GDP per-capita growth. Through an analysis of hidden potentials, demand hotspots, and market conditions that are most favorable to success, this method enables firms to focus on target countries, maximize returns, and global expansion with data, backed by accuracy.
By factoring in the projected importer demand gap that is currently unmet and could be potential opportunity, it identifies the potential for the Exporter (Country) among 190 countries, against the general trade analysis, which identifies the biggest importer or exporter.
To discover high-growth global markets and optimize your business strategy:
Click Here
Pricing
- Single User License$ 1,995
- Department License$ 2,400
- Site License$ 3,120
- Global License$ 3,795

Leadership Perspectives from Industry Events
Search
Thought Leadership and Analyst Meet


Our Clients
6WResearch In News
- India Air Conditioner Market Set for Strong Rebound in 2026 After Weather-Led Correction and GST-Driven Recovery: 6Wresearch
- ADAS in India: How Automatic Emergency Braking, Blind Spot Detection & Driver Monitoring are Transforming Road Safety
- Doha a strategic location for EV manufacturing hub: IPA Qatar
- Demand for luxury TVs surging in the GCC, says Samsung
- Empowering Growth: The Thriving Journey of Bangladesh’s Cable Industry
- Demand for luxury TVs surging in the GCC, says Samsung
Latest Reports
- Nicaragua RPG Gaming Market (2026-2032)
- New Zealand RPG Gaming Market (2026-2032)
- Netherlands RPG Gaming Market (2026-2032)
- Nauru RPG Gaming Market (2026-2032)
- Namibia RPG Gaming Market (2026-2032)
- Mozambique RPG Gaming Market (2026-2032)
- Montenegro RPG Gaming Market (2026-2032)
- Mongolia RPG Gaming Market (2026-2032)
- Monaco RPG Gaming Market (2026-2032)
- Micronesia RPG Gaming Market (2026-2032)
Industry Events and Analyst Meet

EV India Expo 2026

HIMTEX 2026

India Refining Summit 2026

India EV Show 2026

EV tech India Expo 2026
Whitepaper
- Middle East & Africa Commercial Security Market Click here to view more.
- Middle East & Africa Fire Safety Systems & Equipment Market Click here to view more.
- GCC Drone Market Click here to view more.
- Middle East Lighting Fixture Market Click here to view more.
- GCC Physical & Perimeter Security Market Click here to view more.