United Kingdom (UK) Bakeware Market (2026-2032) | Companies, Trends, Analysis, Share, Revenue, Size, COVID-19 IMPACT, Industry, Growth, Value, Forecast & Outlook
Market Forecast By Product Type (Ceramic, Aluminium, Cast Iron, Stainless Steel, Glass, Others), By Applications (Commercial, Household) And Competitive Landscape
| Product Code: ETC011369 | Publication Date: Jun 2023 | Updated Date: Jun 2026 | Product Type: Report | |
| Publisher: 6Wresearch | Author: Ravi Bhandari | No. of Pages: 70 | No. of Figures: 35 | No. of Tables: 5 |
United Kingdom (UK) Bakeware Market Summary
The united kingdom (uk) bakeware market was estimated at USD 187 Million in 2025 and is projected to reach USD 231 Million by 2032, growing at a CAGR of 2.2% from 2026 to 2032.
United Kingdom (UK) Bakeware Market Year-wise Growth Rate and Key Drivers
This graph highlights how the United Kingdom (UK) Bakeware Market has steadily grown over the past five years, supported by major growth factors.
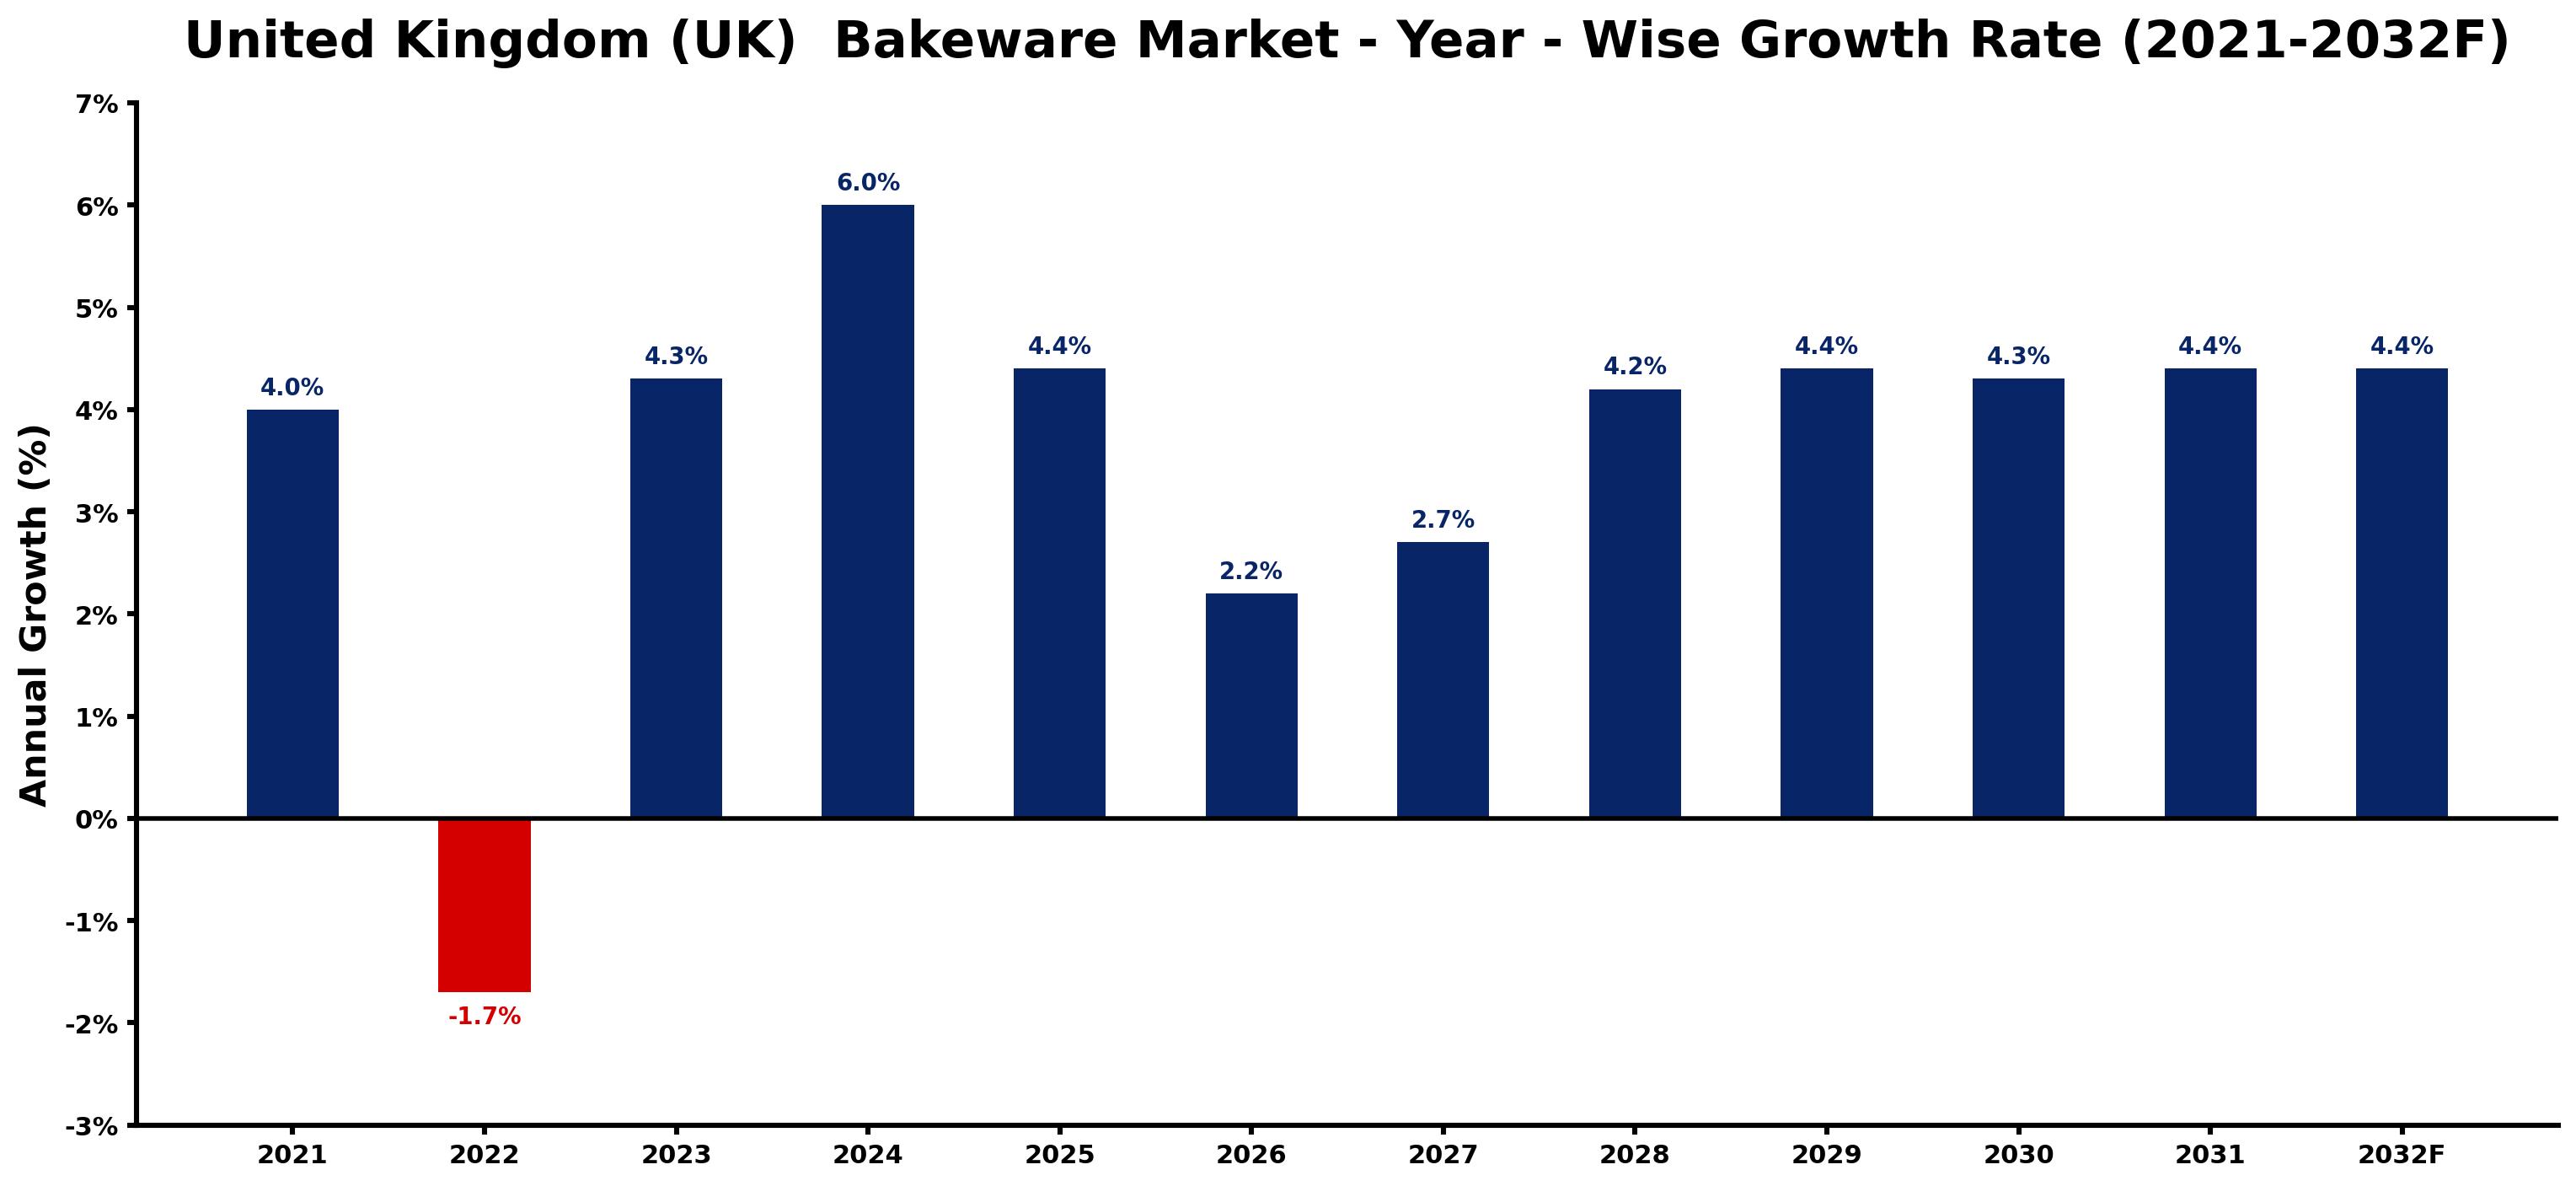
The table below presents the year wise growth rates along with the key drivers influencing the market
| Year | Growth Rate | Major Drivers |
| 2021 | 4.0% | Home baking spiked as individuals sought creative outlets during lockdown measures. |
| 2022 | -1.7% | Increased health consciousness led consumers to shift away from traditional baking towards healthier dessert alternatives. |
| 2023 | 4.3% | Social media influencers showcased innovative bakeware, capturing consumer attention and interest. |
| 2024 | 6.0% | The UK saw an influx of online baking communities sharing recipes and tips. |
| 2025 | 4.4% | Emerging trends highlight personalized kitchenware, appealing to unique consumer preferences. |
| 2026 | 2.2% | Health-conscious consumers sought bakeware that supports gluten-free and vegan baking. |
| 2027 | 2.7% | Collaborations between bakeware brands and celebrity chefs introduced exclusive product lines. |
| 2028 | 4.2% | Increased home renovation projects boosted kitchen and bakeware spending significantly. |
| 2029 | 4.4% | Sustainable packaging initiatives encouraged environmentally friendly bakeware purchases and usage. |
| 2030 | 4.3% | Technological integration in kitchenware improved consumer convenience and functionality demands. |
| 2031 | 4.4% | Experiential retail strategies enhanced the baking experience, enticing shoppers in-store. |
| 2032 | 4.4% | An aging population prompted demand for accessible, user-friendly bakeware options. |
Note - Market size estimations and growth projections presented in this report are based on 6Wresearch's advanced forecasting approach, validated with industry datasets as of June 2026.
Key Highlights of the Report:
- United Kingdom (UK) Bakeware Market Outlook
- Market Size of United Kingdom (UK) Bakeware Market, 2025
- Forecast of United Kingdom (UK) Bakeware Market, 2023F
- Historical Data and Forecast of United Kingdom (UK) Bakeware Revenues & Volume for the Period 2022-2032F
- United Kingdom (UK) Bakeware Market Trend Evolution
- United Kingdom (UK) Bakeware Market Drivers and Challenges
- United Kingdom (UK) Bakeware Price Trends
- United Kingdom (UK) Bakeware Porter's Five Forces
- United Kingdom (UK) Bakeware Industry Life Cycle
- Historical Data and Forecast of United Kingdom (UK) Bakeware Market Revenues & Volume By Product Type for the Period 2022-2032F
- Historical Data and Forecast of United Kingdom (UK) Bakeware Market Revenues & Volume By Ceramic for the Period 2022-2032F
- Historical Data and Forecast of United Kingdom (UK) Bakeware Market Revenues & Volume By Aluminium for the Period 2022-2032F
- Historical Data and Forecast of United Kingdom (UK) Bakeware Market Revenues & Volume By Cast Iron for the Period 2022-2032F
- Historical Data and Forecast of United Kingdom (UK) Bakeware Market Revenues & Volume By Stainless Steel for the Period 2022-2032F
- Historical Data and Forecast of United Kingdom (UK) Bakeware Market Revenues & Volume By Glass for the Period 2022-2032F
- Historical Data and Forecast of United Kingdom (UK) Bakeware Market Revenues & Volume By Others for the Period 2022-2032F
- Historical Data and Forecast of United Kingdom (UK) Bakeware Market Revenues & Volume By Applications for the Period 2022-2032F
- Historical Data and Forecast of United Kingdom (UK) Bakeware Market Revenues & Volume By Commercial for the Period 2022-2032F
- Historical Data and Forecast of United Kingdom (UK) Bakeware Market Revenues & Volume By Household for the Period 2022-2032F
- United Kingdom (UK) Bakeware Import Export Trade Statistics
- Market Opportunity Assessment By Product Type
- Market Opportunity Assessment By Applications
- United Kingdom (UK) Bakeware Top Companies Market Share
- United Kingdom (UK) Bakeware Competitive Benchmarking By Technical and Operational Parameters
- United Kingdom (UK) Bakeware Company Profiles
- United Kingdom (UK) Bakeware Key Strategic Recommendations
Frequently Asked Questions About the Market Study (FAQs):
6Wresearch actively monitors the United Kingdom (UK) Bakeware Market and publishes its comprehensive annual report, highlighting emerging trends, growth drivers, revenue analysis, and forecast outlook. Our insights help businesses to make data-backed strategic decisions with ongoing market dynamics. Our analysts track relevent industries related to the United Kingdom (UK) Bakeware Market, allowing our clients with actionable intelligence and reliable forecasts tailored to emerging regional needs.
Yes, we provide customisation as per your requirements. To learn more, feel free to contact us on sales@6wresearch.com
1 Executive Summary |
2 Introduction |
2.1 Key Highlights of the Report |
2.2 Report Description |
2.3 Market Scope & Segmentation |
2.4 Research Methodology |
2.5 Assumptions |
3 United Kingdom (UK) Bakeware Market Overview |
3.1 United Kingdom (UK) Country Macro Economic Indicators |
3.2 United Kingdom (UK) Bakeware Market Revenues & Volume, 2022 & 2032F |
3.3 United Kingdom (UK) Bakeware Market - Industry Life Cycle |
3.4 United Kingdom (UK) Bakeware Market - Porter's Five Forces |
3.5 United Kingdom (UK) Bakeware Market Revenues & Volume Share, By Product Type, 2022 & 2032F |
3.6 United Kingdom (UK) Bakeware Market Revenues & Volume Share, By Applications, 2022 & 2032F |
4 United Kingdom (UK) Bakeware Market Dynamics |
4.1 Impact Analysis |
4.2 Market Drivers |
4.3 Market Restraints |
5 United Kingdom (UK) Bakeware Market Trends |
6 United Kingdom (UK) Bakeware Market, By Types |
6.1 United Kingdom (UK) Bakeware Market, By Product Type |
6.1.1 Overview and Analysis |
6.1.2 United Kingdom (UK) Bakeware Market Revenues & Volume, By Product Type, 2016 - 2026F |
6.1.3 United Kingdom (UK) Bakeware Market Revenues & Volume, By Ceramic, 2016 - 2026F |
6.1.4 United Kingdom (UK) Bakeware Market Revenues & Volume, By Aluminium, 2016 - 2026F |
6.1.5 United Kingdom (UK) Bakeware Market Revenues & Volume, By Cast Iron, 2016 - 2026F |
6.1.6 United Kingdom (UK) Bakeware Market Revenues & Volume, By Stainless Steel, 2016 - 2026F |
6.1.7 United Kingdom (UK) Bakeware Market Revenues & Volume, By Glass, 2016 - 2026F |
6.1.8 United Kingdom (UK) Bakeware Market Revenues & Volume, By Others, 2016 - 2026F |
6.2 United Kingdom (UK) Bakeware Market, By Applications |
6.2.1 Overview and Analysis |
6.2.2 United Kingdom (UK) Bakeware Market Revenues & Volume, By Commercial, 2016 - 2026F |
6.2.3 United Kingdom (UK) Bakeware Market Revenues & Volume, By Household, 2016 - 2026F |
7 United Kingdom (UK) Bakeware Market Import-Export Trade Statistics |
7.1 United Kingdom (UK) Bakeware Market Export to Major Countries |
7.2 United Kingdom (UK) Bakeware Market Imports from Major Countries |
8 United Kingdom (UK) Bakeware Market Key Performance Indicators |
9 United Kingdom (UK) Bakeware Market - Opportunity Assessment |
9.1 United Kingdom (UK) Bakeware Market Opportunity Assessment, By Product Type, 2022 & 2032F |
9.2 United Kingdom (UK) Bakeware Market Opportunity Assessment, By Applications, 2022 & 2032F |
10 United Kingdom (UK) Bakeware Market - Competitive Landscape |
10.1 United Kingdom (UK) Bakeware Market Revenue Share, By Companies, 2019 |
10.2 United Kingdom (UK) Bakeware Market Competitive Benchmarking, By Operating and Technical Parameters |
11 Company Profiles |
12 Recommendations |
13 Disclaimer |
Global Go To Market Strategy - 2030
Export potential enables firms to identify high-growth global markets with greater confidence by combining advanced trade intelligence with a structured quantitative methodology. The framework analyzes emerging demand trends and country-level import patterns while integrating macroeconomic and trade datasets such as GDP and population forecasts, bilateral import–export flows, tariff structures, elasticity differentials between developed and developing economies, geographic distance, and import demand projections. Using weighted trade values from 2020–2024 as the base period to project country-to-country export potential for 2030, these inputs are operationalized through calculated drivers such as gravity model parameters, tariff impact factors, and projected GDP per-capita growth. Through an analysis of hidden potentials, demand hotspots, and market conditions that are most favorable to success, this method enables firms to focus on target countries, maximize returns, and global expansion with data, backed by accuracy.
By factoring in the projected importer demand gap that is currently unmet and could be potential opportunity, it identifies the potential for the Exporter (Country) among 190 countries, against the general trade analysis, which identifies the biggest importer or exporter.
To discover high-growth global markets and optimize your business strategy:
Click Here
Pricing
- Single User License$ 1,995
- Department License$ 2,400
- Site License$ 3,120
- Global License$ 3,795

Leadership Perspectives from Industry Events
Search
Thought Leadership and Analyst Meet


Our Clients
6WResearch In News
- Hybrid Petrol Cars Lead New-Market Export Opportunities with USD 2.72 Billion in Export Potential by 2031
- The Philippines' Export Potential is Set to Reach USD 102.08 Billion by 2031, with USD 9.81 Billion Emerging from Untapped Markets Beyond Established Trade Corridors
- Coal, Copper and Ferro Nickel Anchor Over USD 69 Billion of Indonesia’s 2031 Potential and USD 22.1 Billion in Untapped Growth Is Opening Through Gold, Fuel and Automotive Products
- Singapore Eyes USD 609.65 Billion in Export Potential by 2031, with USD 38.50 Billion Beyond Existing Trade Corridors
- Crude Petroleum (USD 57.7 Billion) and Semiconductor ICs (USD 82.7 Billion) Dominate Malaysia's 2031 Export Potential, While USD 19.8 Billion in New Product Lines Opens New Opportunities
- Japan’s Export Potential Is Set to Reach USD 826.04 Billion by 2031, with USD 22.48 Billion Emerging from New Product Lines Beyond Established Trade Corridors
Latest Reports
- Gabon Citrullinemia Type-1 Market (2026-2032)
- Finland Citrullinemia Type-1 Market (2026-2032)
- Fiji Citrullinemia Type-1 Market (2026-2032)
- Ethiopia Citrullinemia Type-1 Market (2026-2032)
- Estonia Citrullinemia Type-1 Market (2026-2032)
- Eritrea Citrullinemia Type-1 Market (2026-2032)
- Equatorial Guinea Citrullinemia Type-1 Market (2026-2032)
- El Salvador Citrullinemia Type-1 Market (2026-2032)
- Ecuador Citrullinemia Type-1 Market (2026-2032)
- Dominica Citrullinemia Type-1 Market (2026-2032)
Industry Events and Analyst Meet

EV India Expo 2026

HIMTEX 2026

India Refining Summit 2026

India EV Show 2026

EV tech India Expo 2026
Whitepaper
- Middle East & Africa Commercial Security Market Click here to view more.
- Middle East & Africa Fire Safety Systems & Equipment Market Click here to view more.
- GCC Drone Market Click here to view more.
- Middle East Lighting Fixture Market Click here to view more.
- GCC Physical & Perimeter Security Market Click here to view more.