United Kingdom (UK) Levulinic Acid Market (2026-2032) Outlook | Industry, Companies, Share, Value, Forecast, Revenue, Size, Trends, Growth & Analysis
Market Forecast By Application (Plasticizers, Pharmaceuticals & Cosmetics), By Technology (Acid Hydrolysis, Biofine) And Competitive Landscape
| Product Code: ETC4486030 | Publication Date: Jul 2023 | Updated Date: Mar 2026 | Product Type: Report | |
| Publisher: 6Wresearch | Author: Dhaval Chaurasia | No. of Pages: 85 | No. of Figures: 45 | No. of Tables: 25 |
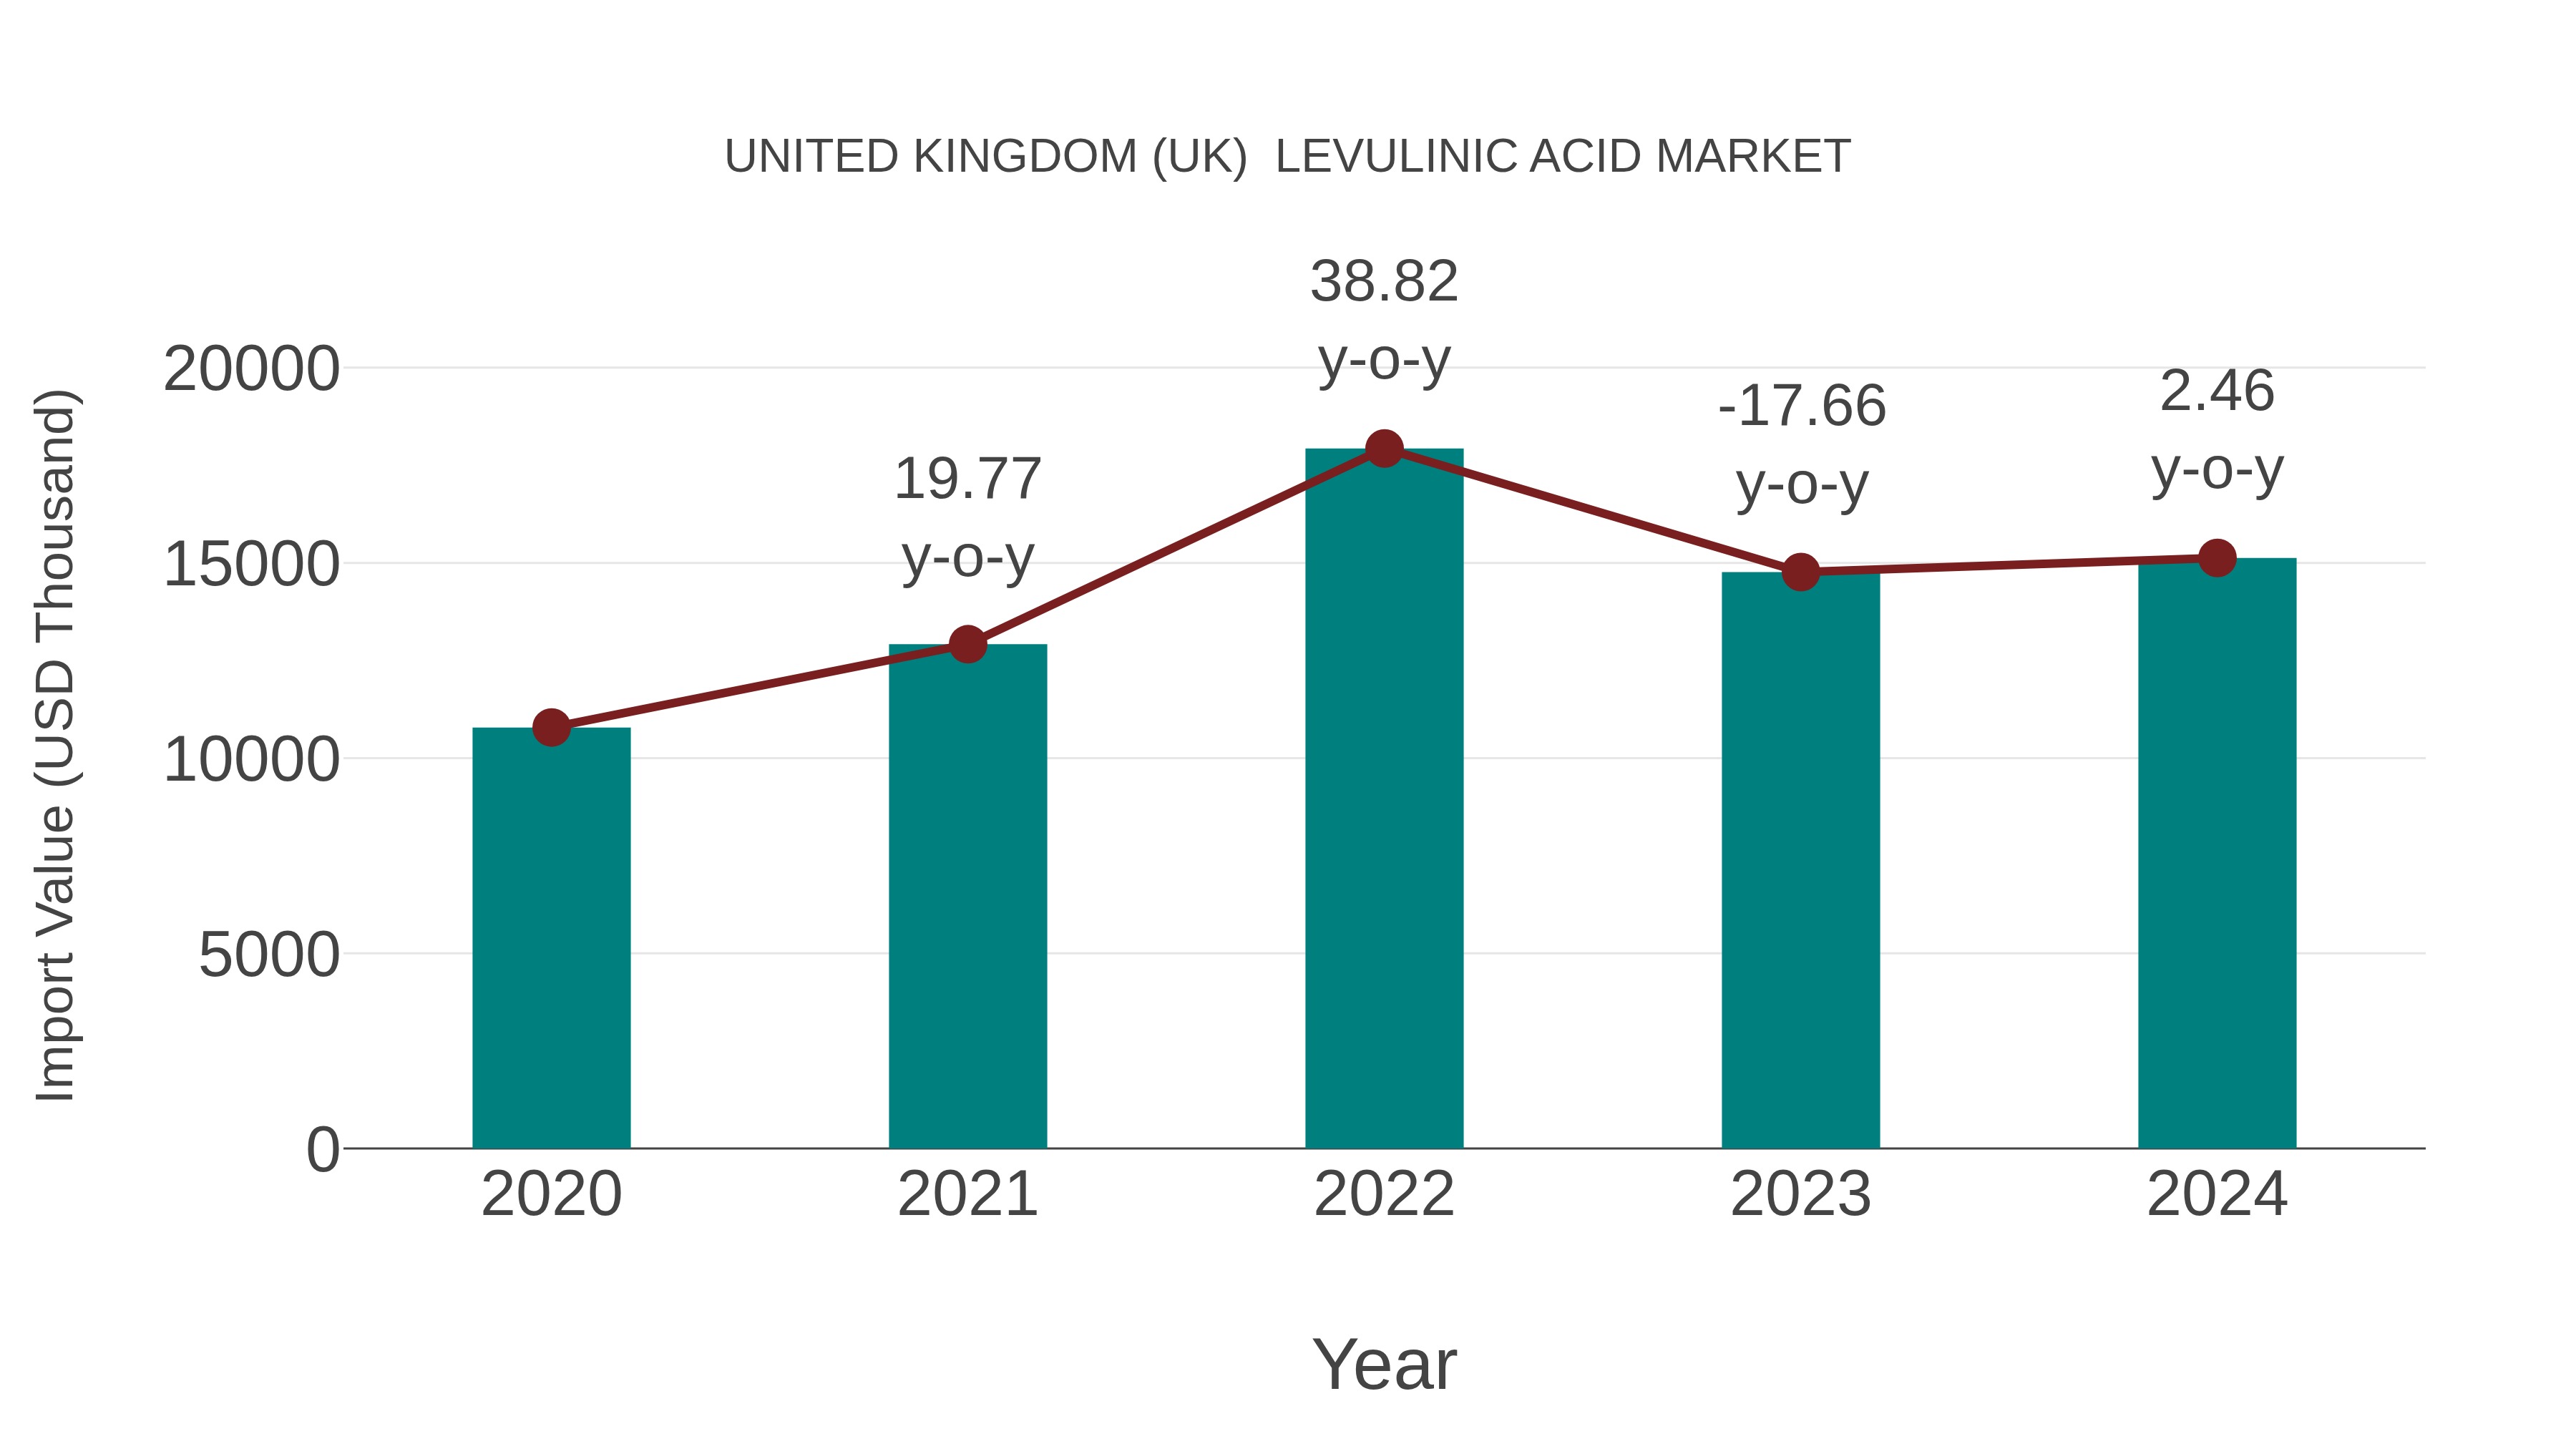
United Kingdom (UK) Levulinic Acid Market: Import Trend Analysis
In the United Kingdom levulinic acid market, the import trend showed a growth rate of 2.46% from 2023 to 2024, with a compound annual growth rate (CAGR) of 8.83% for the period 2020-2024. This upward import momentum can be attributed to the increasing demand for levulinic acid in various industries, indicating market stability and sustained interest in this chemical compound.
United Kingdom (UK) Levulinic Acid Market Overview
The UK Levulinic Acid Market is witnessing steady growth driven by its increasing application in the production of bio-based chemicals and materials. Levulinic acid, derived from biomass, is used in a variety of industries, including pharmaceuticals, agrochemicals, and cosmetics. The push for sustainable and eco-friendly products has bolstered the demand for levulinic acid, positioning the UK as a significant player in the market.
Drivers of the market
The United Kingdom`s Levulinic Acid market is driven by increasing demand for bio-based chemicals, which are essential in reducing the reliance on fossil fuels. Additionally, levulinic acid`s application in producing biodegradable plastics and various pharmaceutical products further propels its market growth. Government initiatives promoting sustainable practices and the chemical`s versatility in producing a wide range of derivatives also contribute significantly to market expansion.
Challenges of the market
The UK Levulinic Acid market faces challenges due to the high cost of production, which affects pricing competitiveness. Additionally, limited availability of raw materials and stringent environmental regulations complicate manufacturing processes. Market penetration is also hindered by low awareness and adoption among potential industrial users.
Government Policy of the market
The UK government promotes the use of renewable and sustainable chemicals, including levulinic acid, through various subsidies and research grants aimed at advancing green chemistry. Regulatory frameworks also ensure the safe use and production of levulinic acid, aligning with environmental standards and reducing carbon footprints.
Key Highlights of the Report:
- United Kingdom (UK) Levulinic Acid Market Outlook
- Market Size of United Kingdom (UK) Levulinic Acid Market, 2025
- Forecast of United Kingdom (UK) Levulinic Acid Market, 2032
- Historical Data and Forecast of United Kingdom (UK) Levulinic Acid Revenues & Volume for the Period 2022-2032F
- United Kingdom (UK) Levulinic Acid Market Trend Evolution
- United Kingdom (UK) Levulinic Acid Market Drivers and Challenges
- United Kingdom (UK) Levulinic Acid Price Trends
- United Kingdom (UK) Levulinic Acid Porter's Five Forces
- United Kingdom (UK) Levulinic Acid Industry Life Cycle
- Historical Data and Forecast of United Kingdom (UK) Levulinic Acid Market Revenues & Volume By Application for the Period 2022-2032F
- Historical Data and Forecast of United Kingdom (UK) Levulinic Acid Market Revenues & Volume By Plasticizers for the Period 2022-2032F
- Historical Data and Forecast of United Kingdom (UK) Levulinic Acid Market Revenues & Volume By Pharmaceuticals & Cosmetics for the Period 2022-2032F
- Historical Data and Forecast of United Kingdom (UK) Levulinic Acid Market Revenues & Volume By Technology for the Period 2022-2032F
- Historical Data and Forecast of United Kingdom (UK) Levulinic Acid Market Revenues & Volume By Acid Hydrolysis for the Period 2022-2032F
- Historical Data and Forecast of United Kingdom (UK) Levulinic Acid Market Revenues & Volume By Biofine for the Period 2022-2032F
- United Kingdom (UK) Levulinic Acid Import Export Trade Statistics
- Market Opportunity Assessment By Application
- Market Opportunity Assessment By Technology
- United Kingdom (UK) Levulinic Acid Top Companies Market Share
- United Kingdom (UK) Levulinic Acid Competitive Benchmarking By Technical and Operational Parameters
- United Kingdom (UK) Levulinic Acid Company Profiles
- United Kingdom (UK) Levulinic Acid Key Strategic Recommendations
United Kingdom (UK) Levulinic Acid Market (2026-2032): FAQs
6Wresearch actively monitors the United Kingdom (UK) Levulinic Acid Market and publishes its comprehensive annual report, highlighting emerging trends, growth drivers, revenue analysis, and forecast outlook. Our insights help businesses to make data-backed strategic decisions with ongoing market dynamics. Our analysts track relevent industries related to the United Kingdom (UK) Levulinic Acid Market, allowing our clients with actionable intelligence and reliable forecasts tailored to emerging regional needs.
Yes, we provide customisation as per your requirements. To learn more, feel free to contact us on sales@6wresearch.com
1 Executive Summary |
2 Introduction |
2.1 Key Highlights of the Report |
2.2 Report Description |
2.3 Market Scope & Segmentation |
2.4 Research Methodology |
2.5 Assumptions |
3 United Kingdom (UK) Levulinic Acid Market Overview |
3.1 United Kingdom (UK) Country Macro Economic Indicators |
3.2 United Kingdom (UK) Levulinic Acid Market Revenues & Volume, 2022 & 2032F |
3.3 United Kingdom (UK) Levulinic Acid Market - Industry Life Cycle |
3.4 United Kingdom (UK) Levulinic Acid Market - Porter's Five Forces |
3.5 United Kingdom (UK) Levulinic Acid Market Revenues & Volume Share, By Application, 2022 & 2032F |
3.6 United Kingdom (UK) Levulinic Acid Market Revenues & Volume Share, By Technology, 2022 & 2032F |
4 United Kingdom (UK) Levulinic Acid Market Dynamics |
4.1 Impact Analysis |
4.2 Market Drivers |
4.2.1 Increasing demand for sustainable chemicals and bio-based products |
4.2.2 Government initiatives promoting the use of renewable chemicals |
4.2.3 Growing awareness about environmental concerns and the need for green alternatives in various industries |
4.3 Market Restraints |
4.3.1 High production costs associated with levulinic acid production |
4.3.2 Limited availability and high cost of raw materials |
4.3.3 Lack of standardized regulations and policies for bio-based chemicals |
5 United Kingdom (UK) Levulinic Acid Market Trends |
6 United Kingdom (UK) Levulinic Acid Market, By Types |
6.1 United Kingdom (UK) Levulinic Acid Market, By Application |
6.1.1 Overview and Analysis |
6.1.2 United Kingdom (UK) Levulinic Acid Market Revenues & Volume, By Application, 2022-2032F |
6.1.3 United Kingdom (UK) Levulinic Acid Market Revenues & Volume, By Plasticizers, 2022-2032F |
6.1.4 United Kingdom (UK) Levulinic Acid Market Revenues & Volume, By Pharmaceuticals & Cosmetics, 2022-2032F |
6.2 United Kingdom (UK) Levulinic Acid Market, By Technology |
6.2.1 Overview and Analysis |
6.2.2 United Kingdom (UK) Levulinic Acid Market Revenues & Volume, By Acid Hydrolysis, 2022-2032F |
6.2.3 United Kingdom (UK) Levulinic Acid Market Revenues & Volume, By Biofine, 2022-2032F |
7 United Kingdom (UK) Levulinic Acid Market Import-Export Trade Statistics |
7.1 United Kingdom (UK) Levulinic Acid Market Export to Major Countries |
7.2 United Kingdom (UK) Levulinic Acid Market Imports from Major Countries |
8 United Kingdom (UK) Levulinic Acid Market Key Performance Indicators |
8.1 Research and development investment in levulinic acid production technologies |
8.2 Number of new product launches using levulinic acid |
8.3 Adoption rate of levulinic acid in key industries such as pharmaceuticals, agriculture, and cosmetics |
9 United Kingdom (UK) Levulinic Acid Market - Opportunity Assessment |
9.1 United Kingdom (UK) Levulinic Acid Market Opportunity Assessment, By Application, 2022 & 2032F |
9.2 United Kingdom (UK) Levulinic Acid Market Opportunity Assessment, By Technology, 2022 & 2032F |
10 United Kingdom (UK) Levulinic Acid Market - Competitive Landscape |
10.1 United Kingdom (UK) Levulinic Acid Market Revenue Share, By Companies, 2025 |
10.2 United Kingdom (UK) Levulinic Acid Market Competitive Benchmarking, By Operating and Technical Parameters |
11 Company Profiles |
12 Recommendations |
13 Disclaimer |
Global Go To Market Strategy - 2030
Export potential enables firms to identify high-growth global markets with greater confidence by combining advanced trade intelligence with a structured quantitative methodology. The framework analyzes emerging demand trends and country-level import patterns while integrating macroeconomic and trade datasets such as GDP and population forecasts, bilateral import–export flows, tariff structures, elasticity differentials between developed and developing economies, geographic distance, and import demand projections. Using weighted trade values from 2020–2024 as the base period to project country-to-country export potential for 2030, these inputs are operationalized through calculated drivers such as gravity model parameters, tariff impact factors, and projected GDP per-capita growth. Through an analysis of hidden potentials, demand hotspots, and market conditions that are most favorable to success, this method enables firms to focus on target countries, maximize returns, and global expansion with data, backed by accuracy.
By factoring in the projected importer demand gap that is currently unmet and could be potential opportunity, it identifies the potential for the Exporter (Country) among 190 countries, against the general trade analysis, which identifies the biggest importer or exporter.
To discover high-growth global markets and optimize your business strategy:
Click Here
Pricing
- Single User License$ 1,995
- Department License$ 2,400
- Site License$ 3,120
- Global License$ 3,795

Leadership Perspectives from Industry Events
Search
Thought Leadership and Analyst Meet


Our Clients
6WResearch In News
- India Export Attractiveness Tracker 2026
- India Air Conditioner Market Set for Strong Rebound in 2026 After Weather-Led Correction and GST-Driven Recovery: 6Wresearch
- ADAS in India: How Automatic Emergency Braking, Blind Spot Detection & Driver Monitoring are Transforming Road Safety
- Doha a strategic location for EV manufacturing hub: IPA Qatar
- Demand for luxury TVs surging in the GCC, says Samsung
- Empowering Growth: The Thriving Journey of Bangladesh’s Cable Industry
Latest Reports
- Nicaragua RPG Gaming Market (2026-2032)
- New Zealand RPG Gaming Market (2026-2032)
- Netherlands RPG Gaming Market (2026-2032)
- Nauru RPG Gaming Market (2026-2032)
- Namibia RPG Gaming Market (2026-2032)
- Mozambique RPG Gaming Market (2026-2032)
- Montenegro RPG Gaming Market (2026-2032)
- Mongolia RPG Gaming Market (2026-2032)
- Monaco RPG Gaming Market (2026-2032)
- Micronesia RPG Gaming Market (2026-2032)
Industry Events and Analyst Meet

EV India Expo 2026

HIMTEX 2026

India Refining Summit 2026

India EV Show 2026

EV tech India Expo 2026
Whitepaper
- Middle East & Africa Commercial Security Market Click here to view more.
- Middle East & Africa Fire Safety Systems & Equipment Market Click here to view more.
- GCC Drone Market Click here to view more.
- Middle East Lighting Fixture Market Click here to view more.
- GCC Physical & Perimeter Security Market Click here to view more.