United States (US) Interactive Tables Market (2026-2032) Outlook | Growth, Industry, Size, Value, Revenue, Trends, Forecast, Share, Analysis & Companies
Market Forecast By Technology (LCD, LED, Capacitive, Others), By Screen Size (32-65 Inch, 65 Inch & Above), By Application (Exhibition & Trade Shows, Education, Retail, Control Room, Hospitality, Transportation, Others) And Competitive Landscape
| Product Code: ETC275041 | Publication Date: Aug 2022 | Updated Date: Jul 2026 | Product Type: Market Research Report | |
| Publisher: 6Wresearch | Author: Vasudha | No. of Pages: 75 | No. of Figures: 35 | No. of Tables: 20 |
United States (US) Interactive Tables Market Size, Share & Growth Rate
The United States (US) Interactive Tables Market was estimated at USD 236 Million in 2025 and is projected to reach USD 277 Million by 2032, growing at a CAGR of 2.3% from 2026 to 2032. This growth trajectory is propelled by the increasing demand for engaging and interactive solutions in educational settings, corporate environments, and retail spaces. The rising emphasis on digital collaboration tools, coupled with advancements in technology, is enhancing the appeal of interactive tables across various sectors.
United States (US) Interactive Tables Market Year-wise Growth Rate and Key Drivers
This graph highlights how the United States (US) Interactive Tables Market has steadily grown over the years, supported by major growth factors.
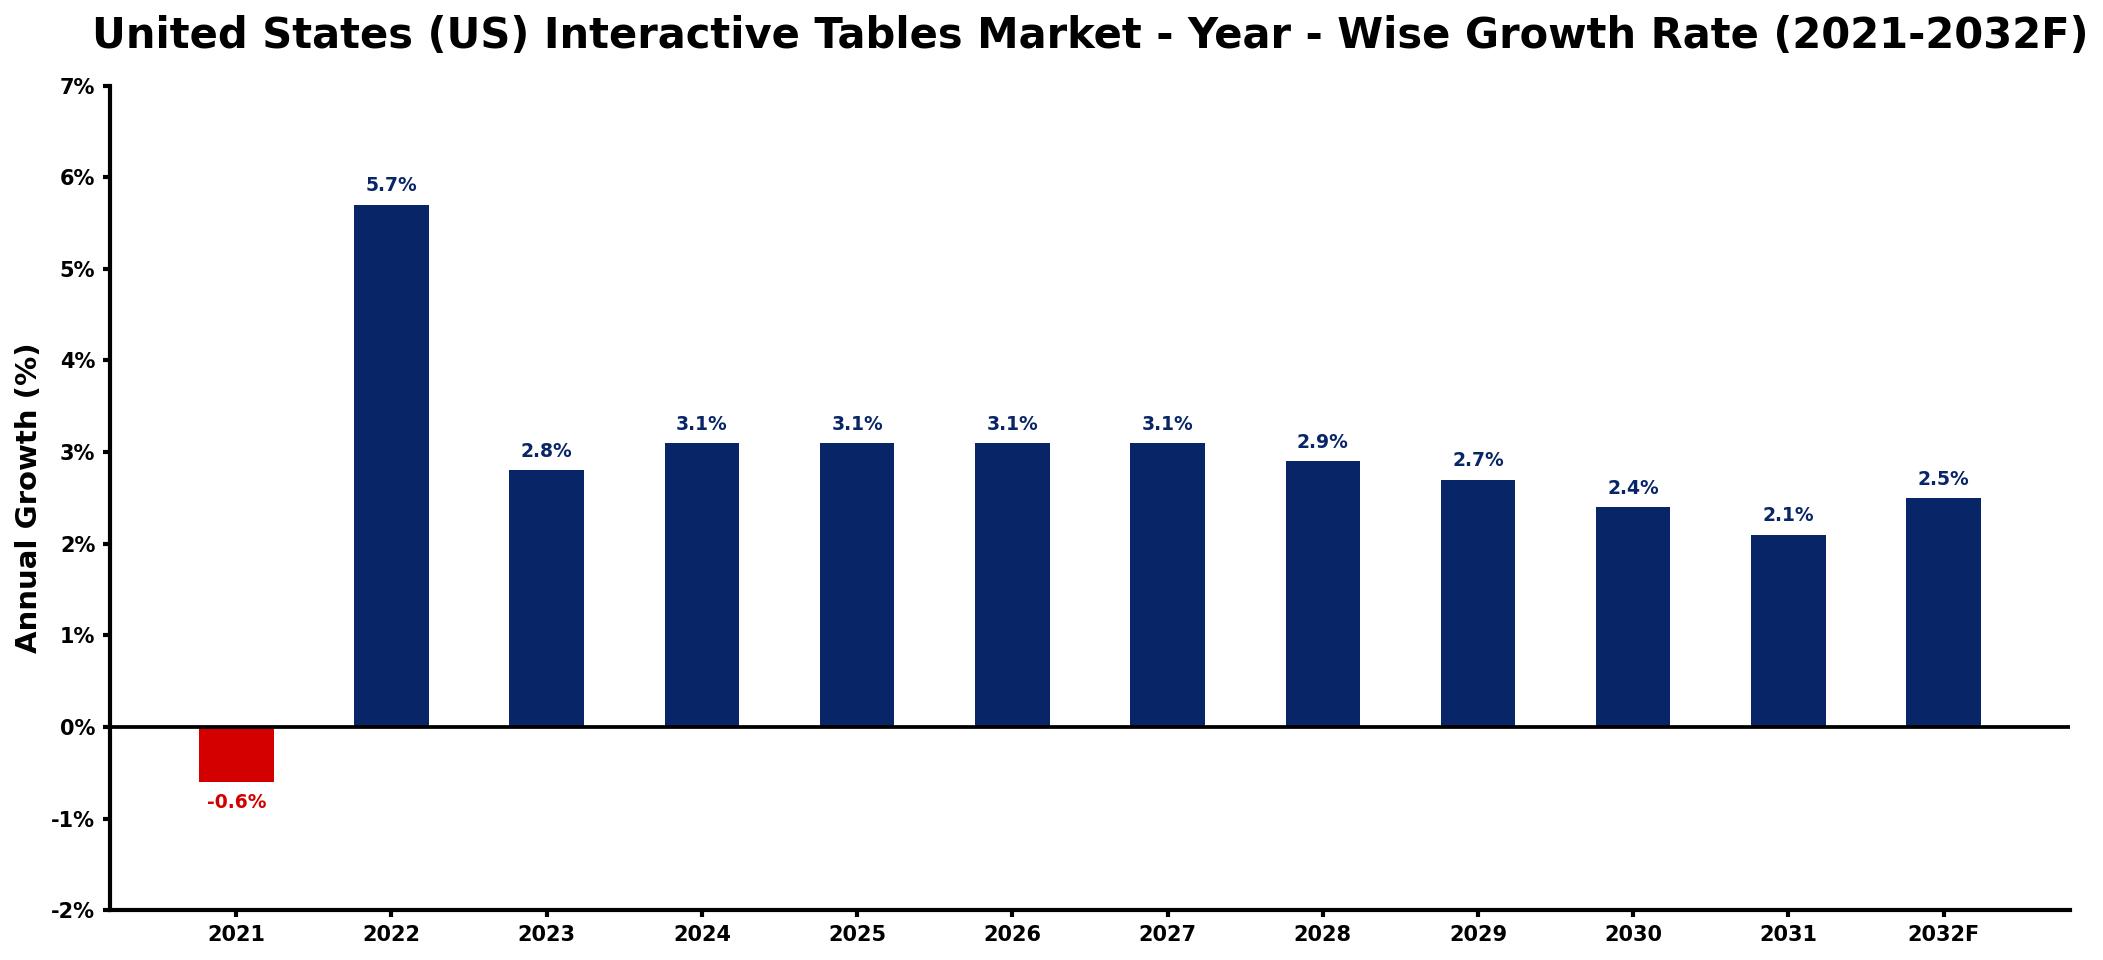
The table below presents the year‑wise growth rates along with the key drivers influencing the market
| Year | Growth Rate | Major Drivers |
| 2021 | -0.6% | decreased consumer spending on technology |
| 2022 | 5.7% | growing demand for educational tools |
| 2023 | 2.8% | rise in remote learning solutions |
| 2024 | 3.1% | increased funding for innovation projects |
| 2025 | 3.1% | expansion of smart office environments |
| 2026 | 3.1% | enhanced focus on collaborative spaces |
| 2027 | 3.1% | growing popularity of hybrid work |
| 2028 | 2.9% | increased investment in digital solutions |
| 2029 | 2.7% | strengthening underlying market demand |
| 2030 | 2.4% | surge in demand for connectivity |
| 2031 | 2.1% | growth in sustainable technology adoption |
| 2032 | 2.5% | increased focus on user engagement |
Note: Market size estimations and growth projections presented in this report are based on 6Wresearch's proprietary forecasting methodology, utilizing the latest available industry data, government publications, and primary research inputs.
United States (US) Interactive Tables Market Synopsis
In the US, educational institutions are rapidly adopting interactive tables to foster collaborative learning environments. These tools not only facilitate interactive lessons but also support digital literacy among students. Corporate offices, too, are integrating interactive tables into their meeting rooms to enhance team collaboration and productivity.
Additionally, the retail sector is leveraging these technologies to engage customers more effectively, creating immersive shopping experiences. The convergence of retail and technology is leading to innovative uses of interactive tables, significantly driving market growth.
United States (US) Interactive Tables Market Key Takeaways
- The demand for interactive tables is surging in educational, corporate, and retail sectors.
- Technological advancements are leading to more sophisticated interactive table features.
- Digital transformation initiatives across various industries are fueling market growth.
- The integration of augmented reality and virtual reality with interactive tables is gaining traction.
- Investment opportunities are ripe as organizations prioritize interactive communication tools.
Evaluation of Restraints in United States (US) Interactive Tables Market
Despite the positive growth outlook, the US Interactive Tables Market faces notable challenges. The high initial costs associated with purchasing and installing these tables can be a barrier for some organizations, particularly small to medium-sized enterprises. Moreover, there remains a knowledge gap regarding the technology among potential users, leading to underutilization of the available features. Maintenance and ongoing technical support can also pose logistical hurdles for organizations. Additionally, concerns surrounding data security and privacy are particularly pertinent in sensitive industries such as healthcare, potentially limiting broader adoption.
United States (US) Interactive Tables Market Trends
The landscape of the US Interactive Tables Market is continually evolving. A pronounced trend is the increasing integration of multi-touch technology and high-definition displays, making interactions more intuitive and visually appealing. Furthermore, as businesses and educational institutions lean towards digital solutions, there is an evident shift towards creating immersive experiences through the incorporation of augmented reality (AR) and virtual reality (VR) capabilities. This integration enhances user engagement and encourages creative exploration, solidifying interactive tables as essential tools for modern interaction.
United States (US) Interactive Tables Market Opportunities
Investment opportunities abound in the US Interactive Tables Market, fueled by rising demands across various sectors. Companies that manufacture interactive tables or develop related software applications stand to benefit significantly. Additionally, the burgeoning trend of digital learning tools in schools creates a fertile ground for investment in educational technology startups. Retail environments are also evolving, making them ripe for innovative interactive solutions that can transform customer engagement. The potential for growth in these areas suggests a promising future for investors.
Government Initiatives in the United States (US) Interactive Tables Market
While there are no specific government policies that directly address the interactive tables market, broader initiatives promoting technological innovation and digital transformation indirectly impact it. Government support for research and development, along with investments in education and infrastructure, fosters an environment conducive to the growth of advanced technologies. Trade regulations and intellectual property rights further influence the market dynamics, ensuring competitive practices that can benefit local manufacturers.
Future Insights of the United States (US) Interactive Tables Market
Looking ahead to 2026-2032, the United States Interactive Tables Market is poised for robust growth. The ongoing digital transformation across sectors will likely amplify the demand for interactive tables, as organizations continue to seek solutions that promote collaboration and enhance user engagement. With the rise of sophisticated features, such as multi-user support and seamless software integration, interactive tables will become increasingly indispensable tools in both educational and corporate environments. The commitment to creating interactive and experiential technology will drive market evolution, opening avenues for further innovation.
United States (US) Interactive Tables Market Latest Developments (2025 - 2026)
Recent industry developments indicate a focus on enhancing the interactive experience through technological innovations. Companies are actively exploring ways to incorporate AI-driven features into interactive tables to facilitate more personalized user interactions. Additionally, there is a growing interest in integrating cloud-based solutions, enabling remote access and collaboration. These trends reflect the industry's responsiveness to evolving user needs and the overall demand for advanced, flexible technology.
United States (US) Interactive Tables Market - Key Attractiveness of the Report
- 10 Years of Market Numbers
- Historical Data Starting from 2022 to 2025
- Base Year: 2025
- Forecast Data until 2032
- Key Performance Indicators Impacting the Market
- Major Upcoming Developments and Projects
Key Highlights of the Report:
- United States (US) Interactive Tables Market Outlook
- Market Size of United States (US) Interactive Tables Market, 2025
- Forecast of United States (US) Interactive Tables Market, 2032
- Historical Data and Forecast of United States (US) Interactive Tables Revenues & Volume for the Period 2022-2032F
- United States (US) Interactive Tables Market Trend Evolution
- United States (US) Interactive Tables Market Drivers and Challenges
- United States (US) Interactive Tables Price Trends
- United States (US) Interactive Tables Porter's Five Forces
- United States (US) Interactive Tables Industry Life Cycle
- Historical Data and Forecast of United States (US) Interactive Tables Market Revenues & Volume By Technology for the Period 2022-2032F
- Historical Data and Forecast of United States (US) Interactive Tables Market Revenues & Volume By LCD for the Period 2022-2032F
- Historical Data and Forecast of United States (US) Interactive Tables Market Revenues & Volume By LED for the Period 2022-2032F
- Historical Data and Forecast of United States (US) Interactive Tables Market Revenues & Volume By Capacitive for the Period 2022-2032F
- Historical Data and Forecast of United States (US) Interactive Tables Market Revenues & Volume By Others for the Period 2022-2032F
- Historical Data and Forecast of United States (US) Interactive Tables Market Revenues & Volume By Screen Size for the Period 2022-2032F
- Historical Data and Forecast of United States (US) Interactive Tables Market Revenues & Volume By 32-65 Inch for the Period 2022-2032F
- Historical Data and Forecast of United States (US) Interactive Tables Market Revenues & Volume By 65 Inch & Above for the Period 2022-2032F
- Historical Data and Forecast of United States (US) Interactive Tables Market Revenues & Volume By Application for the Period 2022-2032F
- Historical Data and Forecast of United States (US) Interactive Tables Market Revenues & Volume By Exhibition & Trade Shows for the Period 2022-2032F
- Historical Data and Forecast of United States (US) Interactive Tables Market Revenues & Volume By Education for the Period 2022-2032F
- Historical Data and Forecast of United States (US) Interactive Tables Market Revenues & Volume By Retail for the Period 2022-2032F
- Historical Data and Forecast of United States (US) Interactive Tables Market Revenues & Volume By Control Room for the Period 2022-2032F
- Historical Data and Forecast of United States (US) Interactive Tables Market Revenues & Volume By Hospitality for the Period 2022-2032F
- Historical Data and Forecast of United States (US) Interactive Tables Market Revenues & Volume By Transportation for the Period 2022-2032F
- Historical Data and Forecast of United States (US) Interactive Tables Market Revenues & Volume By Others for the Period 2022-2032F
- United States (US) Interactive Tables Import Export Trade Statistics
- Market Opportunity Assessment By Technology
- Market Opportunity Assessment By Screen Size
- Market Opportunity Assessment By Application
- United States (US) Interactive Tables Top Companies Market Share
- United States (US) Interactive Tables Competitive Benchmarking By Technical and Operational Parameters
- United States (US) Interactive Tables Company Profiles
- United States (US) Interactive Tables Key Strategic Recommendations
Frequently Asked Questions About the Market Study (FAQs):
The United States Interactive Tables Market was valued at USD 236 Million in 2025 and is projected to grow to USD 277 Million by 2032.
The primary sectors driving demand include education, corporate offices, and retail spaces, all of which are increasingly prioritizing interactive technologies to enhance engagement.
Interactive tables facilitate multi-user interactions, allowing teams to brainstorm, share ideas, and visualize concepts together in real-time, significantly boosting productivity and creativity.
Innovations such as multi-touch capabilities, high-definition displays, and the integration of AR and VR technologies are key advancements that are shaping the market.
High initial costs, limited awareness of the technology, and concerns about data security are significant barriers that organizations face when considering the implementation of interactive tables.
6Wresearch actively monitors the United States (US) Interactive Tables Market and publishes its comprehensive annual report, highlighting emerging trends, growth drivers, revenue analysis, and forecast outlook. Our insights help businesses to make data-backed strategic decisions with ongoing market dynamics. Our analysts track relevent industries related to the United States (US) Interactive Tables Market, allowing our clients with actionable intelligence and reliable forecasts tailored to emerging regional needs.
Yes, we provide customisation as per your requirements. To learn more, feel free to contact us on sales@6wresearch.com
1 Executive Summary |
2 Introduction |
2.1 Key Highlights of the Report |
2.2 Report Description |
2.3 Market Scope & Segmentation |
2.4 Research Methodology |
2.5 Assumptions |
3 United States (US) Interactive Tables Market Overview |
3.1 United States (US) Country Macro Economic Indicators |
3.2 United States (US) Interactive Tables Market Revenues & Volume, 2022 & 2032F |
3.3 United States (US) Interactive Tables Market - Industry Life Cycle |
3.4 United States (US) Interactive Tables Market - Porter's Five Forces |
3.5 United States (US) Interactive Tables Market Revenues & Volume Share, By Technology, 2022 & 2032F |
3.6 United States (US) Interactive Tables Market Revenues & Volume Share, By Screen Size, 2022 & 2032F |
3.7 United States (US) Interactive Tables Market Revenues & Volume Share, By Application, 2022 & 2032F |
4 United States (US) Interactive Tables Market Dynamics |
4.1 Impact Analysis |
4.2 Market Drivers |
4.2.1 Increasing demand for interactive technology in educational institutions and corporate settings |
4.2.2 Growing trend of digitalization and modernization across various industries |
4.2.3 Rising adoption of interactive tables for enhancing customer engagement and user experience |
4.3 Market Restraints |
4.3.1 High initial investment and maintenance costs associated with interactive tables |
4.3.2 Limited awareness and understanding of the benefits of interactive tables among potential users |
4.3.3 Lack of standardization and interoperability among different interactive table systems |
5 United States (US) Interactive Tables Market Trends |
6 United States (US) Interactive Tables Market, By Types |
6.1 United States (US) Interactive Tables Market, By Technology |
6.1.1 Overview and Analysis |
6.1.2 United States (US) Interactive Tables Market Revenues & Volume, By Technology, 2022-2032F |
6.1.3 United States (US) Interactive Tables Market Revenues & Volume, By LCD, 2022-2032F |
6.1.4 United States (US) Interactive Tables Market Revenues & Volume, By LED, 2022-2032F |
6.1.5 United States (US) Interactive Tables Market Revenues & Volume, By Capacitive, 2022-2032F |
6.1.6 United States (US) Interactive Tables Market Revenues & Volume, By Others, 2022-2032F |
6.2 United States (US) Interactive Tables Market, By Screen Size |
6.2.1 Overview and Analysis |
6.2.2 United States (US) Interactive Tables Market Revenues & Volume, By 32-65 Inch, 2022-2032F |
6.2.3 United States (US) Interactive Tables Market Revenues & Volume, By 65 Inch & Above, 2022-2032F |
6.3 United States (US) Interactive Tables Market, By Application |
6.3.1 Overview and Analysis |
6.3.2 United States (US) Interactive Tables Market Revenues & Volume, By Exhibition & Trade Shows, 2022-2032F |
6.3.3 United States (US) Interactive Tables Market Revenues & Volume, By Education, 2022-2032F |
6.3.4 United States (US) Interactive Tables Market Revenues & Volume, By Retail, 2022-2032F |
6.3.5 United States (US) Interactive Tables Market Revenues & Volume, By Control Room, 2022-2032F |
6.3.6 United States (US) Interactive Tables Market Revenues & Volume, By Hospitality, 2022-2032F |
6.3.7 United States (US) Interactive Tables Market Revenues & Volume, By Transportation, 2022-2032F |
7 United States (US) Interactive Tables Market Import-Export Trade Statistics |
7.1 United States (US) Interactive Tables Market Export to Major Countries |
7.2 United States (US) Interactive Tables Market Imports from Major Countries |
8 United States (US) Interactive Tables Market Key Performance Indicators |
8.1 Average session duration on interactive tables |
8.2 Frequency of software updates and new feature releases |
8.3 Customer satisfaction rating with interactive table functionalities |
9 United States (US) Interactive Tables Market - Opportunity Assessment |
9.1 United States (US) Interactive Tables Market Opportunity Assessment, By Technology, 2022 & 2032F |
9.2 United States (US) Interactive Tables Market Opportunity Assessment, By Screen Size, 2022 & 2032F |
9.3 United States (US) Interactive Tables Market Opportunity Assessment, By Application, 2022 & 2032F |
10 United States (US) Interactive Tables Market - Competitive Landscape |
10.1 United States (US) Interactive Tables Market Revenue Share, By Companies, 2025 |
10.2 United States (US) Interactive Tables Market Competitive Benchmarking, By Operating and Technical Parameters |
11 Company Profiles |
12 Recommendations |
13 Disclaimer |
Global Go To Market Strategy - 2030
Export potential enables firms to identify high-growth global markets with greater confidence by combining advanced trade intelligence with a structured quantitative methodology. The framework analyzes emerging demand trends and country-level import patterns while integrating macroeconomic and trade datasets such as GDP and population forecasts, bilateral import–export flows, tariff structures, elasticity differentials between developed and developing economies, geographic distance, and import demand projections. Using weighted trade values from 2020–2024 as the base period to project country-to-country export potential for 2030, these inputs are operationalized through calculated drivers such as gravity model parameters, tariff impact factors, and projected GDP per-capita growth. Through an analysis of hidden potentials, demand hotspots, and market conditions that are most favorable to success, this method enables firms to focus on target countries, maximize returns, and global expansion with data, backed by accuracy.
By factoring in the projected importer demand gap that is currently unmet and could be potential opportunity, it identifies the potential for the Exporter (Country) among 190 countries, against the general trade analysis, which identifies the biggest importer or exporter.
To discover high-growth global markets and optimize your business strategy:
Click Here
Pricing
- Single User License$ 1,995
- Department License$ 2,400
- Site License$ 3,120
- Global License$ 3,795

Leadership Perspectives from Industry Events
Search
Thought Leadership and Analyst Meet


Our Clients
6WResearch In News
- India Air Conditioner Market Set for Strong Rebound in 2026 After Weather-Led Correction and GST-Driven Recovery: 6Wresearch
- ADAS in India: How Automatic Emergency Braking, Blind Spot Detection & Driver Monitoring are Transforming Road Safety
- Doha a strategic location for EV manufacturing hub: IPA Qatar
- Demand for luxury TVs surging in the GCC, says Samsung
- Empowering Growth: The Thriving Journey of Bangladesh’s Cable Industry
- Demand for luxury TVs surging in the GCC, says Samsung
Latest Reports
- Nicaragua RPG Gaming Market (2026-2032)
- New Zealand RPG Gaming Market (2026-2032)
- Netherlands RPG Gaming Market (2026-2032)
- Nauru RPG Gaming Market (2026-2032)
- Namibia RPG Gaming Market (2026-2032)
- Mozambique RPG Gaming Market (2026-2032)
- Montenegro RPG Gaming Market (2026-2032)
- Mongolia RPG Gaming Market (2026-2032)
- Monaco RPG Gaming Market (2026-2032)
- Micronesia RPG Gaming Market (2026-2032)
Industry Events and Analyst Meet

EV India Expo 2026

HIMTEX 2026

India Refining Summit 2026

India EV Show 2026

EV tech India Expo 2026
Whitepaper
- Middle East & Africa Commercial Security Market Click here to view more.
- Middle East & Africa Fire Safety Systems & Equipment Market Click here to view more.
- GCC Drone Market Click here to view more.
- Middle East Lighting Fixture Market Click here to view more.
- GCC Physical & Perimeter Security Market Click here to view more.