United States (US) Motor Soft Starter Market (2026-2032) Outlook | Growth, Forecast, Size, Analysis, Trends, Companies, Share, Industry, Value & Revenue
Market Forecast By Voltage (Low Voltage, Medium Voltage), By Rated Power (Up To 750 W, 751 W“75 Kw, Above 75 Kw), By Application (Pump, Fan, Compressor, Others), By Industry (Oil & Gas, Water & Wastewater, Power Generation, Mining, Others) And Competitive Landscape
| Product Code: ETC267541 | Publication Date: Aug 2022 | Updated Date: Jul 2026 | Product Type: Market Research Report | |
| Publisher: 6Wresearch | Author: Vasudha | No. of Pages: 75 | No. of Figures: 35 | No. of Tables: 20 |
United States (US) Motor Soft Starter Market Size, Share & Growth Rate
The United States (US) Motor Soft Starter Market was estimated at USD 209 Million in 2025 and is projected to reach USD 246 Million by 2032, growing at a CAGR of 2.4% from 2026 to 2032. This growth trajectory is largely propelled by the increasing emphasis on energy efficiency and sustainability in industrial operations. Soft starters are increasingly recognized for their ability to enhance operational efficiency while reducing mechanical wear and energy consumption, making them an attractive option across various sectors.
United States (US) Motor Soft Starter Market Year-wise Growth Rate and Key Drivers
This graph highlights how the United States (US) Motor Soft Starter Market has steadily grown over the years, supported by major growth factors.
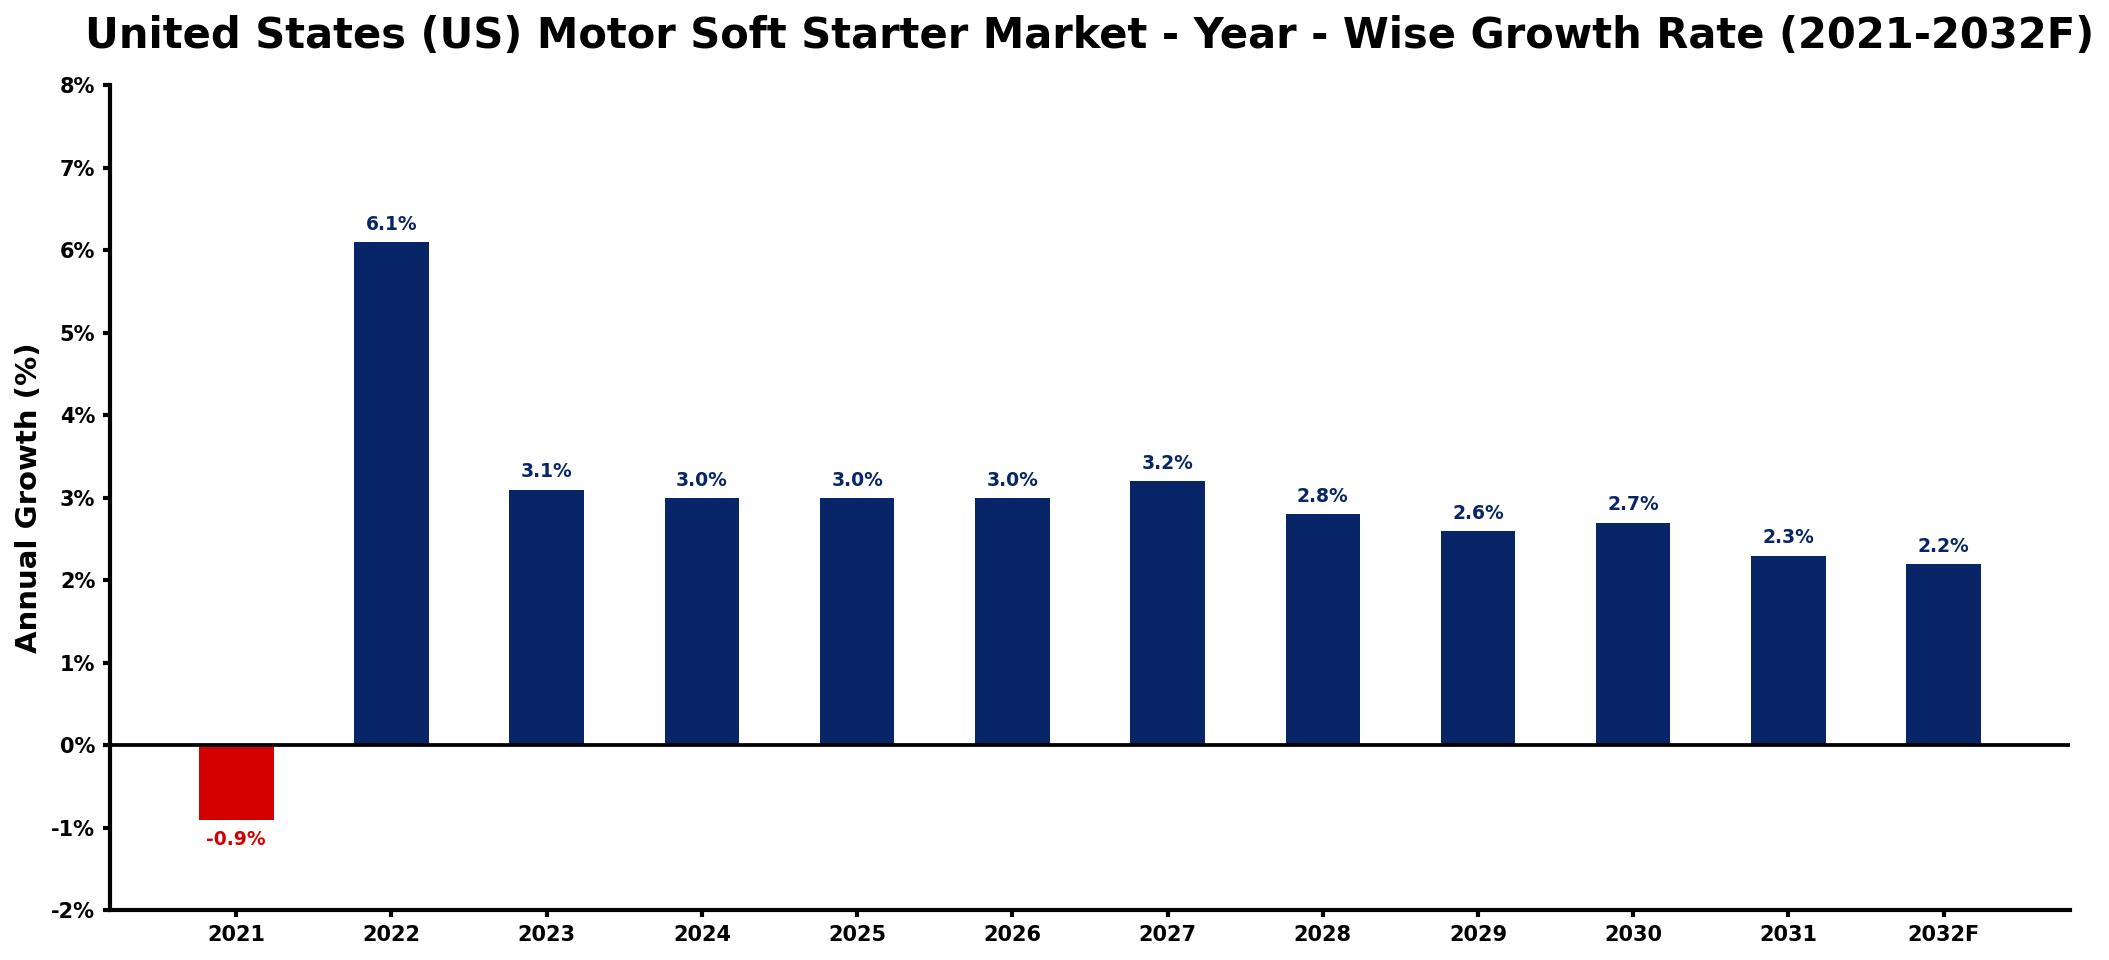
The table below presents the year‑wise growth rates along with the key drivers influencing the market
| Year | Growth Rate | Major Drivers |
| 2021 | -0.9% | decreased industrial automation investments |
| 2022 | 6.1% | increased focus on energy efficiency |
| 2023 | 3.1% | growing adoption in manufacturing sectors |
| 2024 | 3.0% | expansion of renewable energy projects |
| 2025 | 3.0% | rising demand for automation solutions |
| 2026 | 3.0% | enhanced investments in infrastructure upgrades |
| 2027 | 3.2% | growth in electric vehicle production |
| 2028 | 2.8% | increased use in HVAC systems |
| 2029 | 2.6% | more applications in industrial processes |
| 2030 | 2.7% | boost in smart grid technologies |
| 2031 | 2.3% | rising export shipment volumes |
| 2032 | 2.2% | growing trend towards predictive maintenance |
Note: Market size estimations and growth projections presented in this report are based on 6Wresearch's proprietary forecasting methodology, utilizing the latest available industry data, government publications, and primary research inputs.
United States (US) Motor Soft Starter Market Synopsis
The demand for motor soft starters is being significantly fueled by the need for energy-efficient solutions in industries such as manufacturing and oil & gas. As companies seek to reduce operational costs and carbon footprints, the adoption of these devices is becoming a strategic priority.
The market is also witnessing a paradigm shift toward digital soft starters, which come equipped with advanced features like remote monitoring, predictive maintenance, and enhanced diagnostics. These innovations are redefining operational standards and meeting the growing demand for smarter, more efficient motor control solutions.
United States (US) Motor Soft Starter Market Key Takeaways
- The shift toward energy-efficient technologies is driving demand for soft starters in industrial applications.
- Digitalization and IoT integration are key trends reshaping the soft starter market landscape.
- Investment opportunities are abundant in advanced soft starter technologies and applications.
- Government policies are favoring the adoption of energy-efficient solutions, creating a supportive regulatory environment.
- Technological advancements are enabling enhanced motor control and improved operational sustainability.
Evaluation of Restraints in United States (US) Motor Soft Starter Market
Despite the promising growth outlook, several factors can limit the potential of the US Motor Soft Starter Market. The competitive presence of variable frequency drives (VFDs), which provide similar functionalities with additional benefits, presents a challenge for soft starters. Smaller businesses may also hesitate to invest due to the initial costs associated with these technologies. Furthermore, the continuous pressure to innovate poses a constant challenge for manufacturers to keep pace with evolving market demands and technological standards.
United States (US) Motor Soft Starter Market Trends
Current trends indicate a significant shift toward the integration of smart technologies within motor soft starters. Manufacturers are increasingly developing devices that not only enhance motor performance but also provide features like real-time monitoring and fault diagnosis. Additionally, the demand for soft starters with higher power ratings is on the rise as industries seek robust motor control solutions capable of handling larger operations.
Moreover, sustainability initiatives are influencing the market by encouraging the development of soft starters designed for improved power factor correction and energy consumption reductions. These developments align well with industrial goals for greener operations and compliance with emerging environmental standards.
United States (US) Motor Soft Starter Market Opportunities
The US Motor Soft Starter Market presents numerous opportunities for growth, particularly in sectors heavily investing in automation and energy efficiency. There is a burgeoning demand for advanced soft starter solutions that incorporate digital controls and IoT integration, as industries aim to leverage these technologies for enhanced performance. Additionally, expansion into new applications, such as electric vehicles and renewable energy systems, creates avenues for innovative product development and strategic partnerships.
Government Initiatives in the United States (US) Motor Soft Starter Market
Government policies play a crucial role in shaping the landscape of the US Motor Soft Starter Market. Regulations implemented by the Department of Energy (DOE) and the Environmental Protection Agency (EPA) are designed to promote energy efficiency and reduce carbon emissions. These policies encourage industries to adopt technologies like motor soft starters, facilitating compliance with stringent energy consumption standards and emissions guidelines, thus boosting market growth.
Future Insights of the United States (US) Motor Soft Starter Market
Looking ahead to the period from 2026 to 2032, the outlook for the US Motor Soft Starter Market is optimistic. Key growth drivers include the continued rise of industrial automation and the ongoing demand for solutions that minimize mechanical stress on motors. The integration of advanced technologies, such as enhanced communication capabilities and IoT solutions, will likely propel market expansion. As industries increasingly prioritize sustainability and operational efficiency, the demand for motor soft starters will continue to grow.
United States (US) Motor Soft Starter Market Latest Developments (2025 - 2026)
Recent developments in the US Motor Soft Starter Market indicate a heightened focus on product innovation and digital transformation. Manufacturers are actively exploring partnerships to enhance technological capabilities, with an emphasis on creating systems that integrate seamlessly into existing industrial operations. This includes advancements in remote monitoring technologies and the implementation of smarter diagnostic tools to further improve operational efficiencies.
United States (US) Motor Soft Starter Market - Key Attractiveness of the Report
- 10 Years of Market Numbers
- Historical Data Starting from 2022 to 2025
- Base Year: 2025
- Forecast Data until 2032
- Key Performance Indicators Impacting the Market
- Major Upcoming Developments and Projects
Key Highlights of the Report:
- United States (US) Motor Soft Starter Market Outlook
- Market Size of United States (US) Motor Soft Starter Market, 2025
- Forecast of United States (US) Motor Soft Starter Market, 2032
- Historical Data and Forecast of United States (US) Motor Soft Starter Revenues & Volume for the Period 2022-2032F
- United States (US) Motor Soft Starter Market Trend Evolution
- United States (US) Motor Soft Starter Market Drivers and Challenges
- United States (US) Motor Soft Starter Price Trends
- United States (US) Motor Soft Starter Porter's Five Forces
- United States (US) Motor Soft Starter Industry Life Cycle
- Historical Data and Forecast of United States (US) Motor Soft Starter Market Revenues & Volume By Voltage for the Period 2022-2032F
- Historical Data and Forecast of United States (US) Motor Soft Starter Market Revenues & Volume By Low Voltage for the Period 2022-2032F
- Historical Data and Forecast of United States (US) Motor Soft Starter Market Revenues & Volume By Medium Voltage for the Period 2022-2032F
- Historical Data and Forecast of United States (US) Motor Soft Starter Market Revenues & Volume By Rated Power for the Period 2022-2032F
- Historical Data and Forecast of United States (US) Motor Soft Starter Market Revenues & Volume By Up To 750 W for the Period 2022-2032F
- Historical Data and Forecast of United States (US) Motor Soft Starter Market Revenues & Volume By 751 W??75 Kw for the Period 2022-2032F
- Historical Data and Forecast of United States (US) Motor Soft Starter Market Revenues & Volume By Above 75 Kw for the Period 2022-2032F
- Historical Data and Forecast of United States (US) Motor Soft Starter Market Revenues & Volume By Application for the Period 2022-2032F
- Historical Data and Forecast of United States (US) Motor Soft Starter Market Revenues & Volume By Pump for the Period 2022-2032F
- Historical Data and Forecast of United States (US) Motor Soft Starter Market Revenues & Volume By Fan for the Period 2022-2032F
- Historical Data and Forecast of United States (US) Motor Soft Starter Market Revenues & Volume By Compressor for the Period 2022-2032F
- Historical Data and Forecast of United States (US) Motor Soft Starter Market Revenues & Volume By Others for the Period 2022-2032F
- Historical Data and Forecast of United States (US) Motor Soft Starter Market Revenues & Volume By Industry for the Period 2022-2032F
- Historical Data and Forecast of United States (US) Motor Soft Starter Market Revenues & Volume By Oil & Gas for the Period 2022-2032F
- Historical Data and Forecast of United States (US) Motor Soft Starter Market Revenues & Volume By Water & Wastewater for the Period 2022-2032F
- Historical Data and Forecast of United States (US) Motor Soft Starter Market Revenues & Volume By Power Generation for the Period 2022-2032F
- Historical Data and Forecast of United States (US) Motor Soft Starter Market Revenues & Volume By Mining for the Period 2022-2032F
- Historical Data and Forecast of United States (US) Motor Soft Starter Market Revenues & Volume By Others for the Period 2022-2032F
- United States (US) Motor Soft Starter Import Export Trade Statistics
- Market Opportunity Assessment By Voltage
- Market Opportunity Assessment By Rated Power
- Market Opportunity Assessment By Application
- Market Opportunity Assessment By Industry
- United States (US) Motor Soft Starter Top Companies Market Share
- United States (US) Motor Soft Starter Competitive Benchmarking By Technical and Operational Parameters
- United States (US) Motor Soft Starter Company Profiles
- United States (US) Motor Soft Starter Key Strategic Recommendations
Frequently Asked Questions About the Market Study (FAQs):
The market is primarily driven by the push for energy efficiency in industrial applications and the growing adoption of advanced technologies, which enhance operational efficiency and reduce mechanical stress on motors.
The United States (US) Motor Soft Starter Market was estimated at USD 209 Million in 2025 and is projected to reach USD 246 Million by 2032, growing at a CAGR of 2.4% from 2026 to 2032.
Key sectors leveraging motor soft starters include manufacturing, oil & gas, and water treatment, where the need for energy efficiency and reduced mechanical stress is paramount.
The market is witnessing a trend towards digitalization and IoT integration, with manufacturers focusing on developing smart soft starters that offer advanced monitoring and predictive maintenance features.
Yes, government initiatives aimed at promoting energy efficiency and reducing carbon emissions are significantly shaping the market landscape, encouraging industries to adopt technologies that align with these regulatory goals.
6Wresearch actively monitors the United States (US) Motor Soft Starter Market and publishes its comprehensive annual report, highlighting emerging trends, growth drivers, revenue analysis, and forecast outlook. Our insights help businesses to make data-backed strategic decisions with ongoing market dynamics. Our analysts track relevent industries related to the United States (US) Motor Soft Starter Market, allowing our clients with actionable intelligence and reliable forecasts tailored to emerging regional needs.
Yes, we provide customisation as per your requirements. To learn more, feel free to contact us on sales@6wresearch.com
1 Executive Summary |
2 Introduction |
2.1 Key Highlights of the Report |
2.2 Report Description |
2.3 Market Scope & Segmentation |
2.4 Research Methodology |
2.5 Assumptions |
3 United States (US) Motor Soft Starter Market Overview |
3.1 United States (US) Country Macro Economic Indicators |
3.2 United States (US) Motor Soft Starter Market Revenues & Volume, 2022 & 2032F |
3.3 United States (US) Motor Soft Starter Market - Industry Life Cycle |
3.4 United States (US) Motor Soft Starter Market - Porter's Five Forces |
3.5 United States (US) Motor Soft Starter Market Revenues & Volume Share, By Voltage, 2022 & 2032F |
3.6 United States (US) Motor Soft Starter Market Revenues & Volume Share, By Rated Power, 2022 & 2032F |
3.7 United States (US) Motor Soft Starter Market Revenues & Volume Share, By Application, 2022 & 2032F |
3.8 United States (US) Motor Soft Starter Market Revenues & Volume Share, By Industry, 2022 & 2032F |
4 United States (US) Motor Soft Starter Market Dynamics |
4.1 Impact Analysis |
4.2 Market Drivers |
4.2.1 Increasing adoption of energy-efficient motor control solutions |
4.2.2 Growing industrial automation and infrastructure development in the US |
4.2.3 Focus on reducing maintenance costs and enhancing equipment lifespan |
4.3 Market Restraints |
4.3.1 High initial investment costs associated with motor soft starters |
4.3.2 Limited awareness and understanding of the benefits of motor soft starters |
4.3.3 Competition from alternative motor control technologies |
5 United States (US) Motor Soft Starter Market Trends |
6 United States (US) Motor Soft Starter Market, By Types |
6.1 United States (US) Motor Soft Starter Market, By Voltage |
6.1.1 Overview and Analysis |
6.1.2 United States (US) Motor Soft Starter Market Revenues & Volume, By Voltage, 2022-2032F |
6.1.3 United States (US) Motor Soft Starter Market Revenues & Volume, By Low Voltage, 2022-2032F |
6.1.4 United States (US) Motor Soft Starter Market Revenues & Volume, By Medium Voltage, 2022-2032F |
6.2 United States (US) Motor Soft Starter Market, By Rated Power |
6.2.1 Overview and Analysis |
6.2.2 United States (US) Motor Soft Starter Market Revenues & Volume, By Up To 750 W, 2022-2032F |
6.2.3 United States (US) Motor Soft Starter Market Revenues & Volume, By 751 W??75 Kw, 2022-2032F |
6.2.4 United States (US) Motor Soft Starter Market Revenues & Volume, By Above 75 Kw, 2022-2032F |
6.3 United States (US) Motor Soft Starter Market, By Application |
6.3.1 Overview and Analysis |
6.3.2 United States (US) Motor Soft Starter Market Revenues & Volume, By Pump, 2022-2032F |
6.3.3 United States (US) Motor Soft Starter Market Revenues & Volume, By Fan, 2022-2032F |
6.3.4 United States (US) Motor Soft Starter Market Revenues & Volume, By Compressor, 2022-2032F |
6.3.5 United States (US) Motor Soft Starter Market Revenues & Volume, By Others, 2022-2032F |
6.4 United States (US) Motor Soft Starter Market, By Industry |
6.4.1 Overview and Analysis |
6.4.2 United States (US) Motor Soft Starter Market Revenues & Volume, By Oil & Gas, 2022-2032F |
6.4.3 United States (US) Motor Soft Starter Market Revenues & Volume, By Water & Wastewater, 2022-2032F |
6.4.4 United States (US) Motor Soft Starter Market Revenues & Volume, By Power Generation, 2022-2032F |
6.4.5 United States (US) Motor Soft Starter Market Revenues & Volume, By Mining, 2022-2032F |
6.4.6 United States (US) Motor Soft Starter Market Revenues & Volume, By Others, 2022-2032F |
7 United States (US) Motor Soft Starter Market Import-Export Trade Statistics |
7.1 United States (US) Motor Soft Starter Market Export to Major Countries |
7.2 United States (US) Motor Soft Starter Market Imports from Major Countries |
8 United States (US) Motor Soft Starter Market Key Performance Indicators |
8.1 Energy savings achieved through motor soft starter implementation |
8.2 Percentage increase in the adoption of motor soft starters in key industries |
8.3 Number of government initiatives promoting energy-efficient technologies |
8.4 Average payback period for motor soft starter investments |
8.5 Number of new technological advancements in motor soft starter technology |
9 United States (US) Motor Soft Starter Market - Opportunity Assessment |
9.1 United States (US) Motor Soft Starter Market Opportunity Assessment, By Voltage, 2022 & 2032F |
9.2 United States (US) Motor Soft Starter Market Opportunity Assessment, By Rated Power, 2022 & 2032F |
9.3 United States (US) Motor Soft Starter Market Opportunity Assessment, By Application, 2022 & 2032F |
9.4 United States (US) Motor Soft Starter Market Opportunity Assessment, By Industry, 2022 & 2032F |
10 United States (US) Motor Soft Starter Market - Competitive Landscape |
10.1 United States (US) Motor Soft Starter Market Revenue Share, By Companies, 2025 |
10.2 United States (US) Motor Soft Starter Market Competitive Benchmarking, By Operating and Technical Parameters |
11 Company Profiles |
12 Recommendations |
13 Disclaimer |
Global Go To Market Strategy - 2030
Export potential enables firms to identify high-growth global markets with greater confidence by combining advanced trade intelligence with a structured quantitative methodology. The framework analyzes emerging demand trends and country-level import patterns while integrating macroeconomic and trade datasets such as GDP and population forecasts, bilateral import–export flows, tariff structures, elasticity differentials between developed and developing economies, geographic distance, and import demand projections. Using weighted trade values from 2020–2024 as the base period to project country-to-country export potential for 2030, these inputs are operationalized through calculated drivers such as gravity model parameters, tariff impact factors, and projected GDP per-capita growth. Through an analysis of hidden potentials, demand hotspots, and market conditions that are most favorable to success, this method enables firms to focus on target countries, maximize returns, and global expansion with data, backed by accuracy.
By factoring in the projected importer demand gap that is currently unmet and could be potential opportunity, it identifies the potential for the Exporter (Country) among 190 countries, against the general trade analysis, which identifies the biggest importer or exporter.
To discover high-growth global markets and optimize your business strategy:
Click Here
Pricing
- Single User License$ 1,995
- Department License$ 2,400
- Site License$ 3,120
- Global License$ 3,795

Leadership Perspectives from Industry Events
Search
Thought Leadership and Analyst Meet


Our Clients
6WResearch In News
- India Air Conditioner Market Set for Strong Rebound in 2026 After Weather-Led Correction and GST-Driven Recovery: 6Wresearch
- ADAS in India: How Automatic Emergency Braking, Blind Spot Detection & Driver Monitoring are Transforming Road Safety
- Doha a strategic location for EV manufacturing hub: IPA Qatar
- Demand for luxury TVs surging in the GCC, says Samsung
- Empowering Growth: The Thriving Journey of Bangladesh’s Cable Industry
- Demand for luxury TVs surging in the GCC, says Samsung
Latest Reports
- Nicaragua RPG Gaming Market (2026-2032)
- New Zealand RPG Gaming Market (2026-2032)
- Netherlands RPG Gaming Market (2026-2032)
- Nauru RPG Gaming Market (2026-2032)
- Namibia RPG Gaming Market (2026-2032)
- Mozambique RPG Gaming Market (2026-2032)
- Montenegro RPG Gaming Market (2026-2032)
- Mongolia RPG Gaming Market (2026-2032)
- Monaco RPG Gaming Market (2026-2032)
- Micronesia RPG Gaming Market (2026-2032)
Industry Events and Analyst Meet

EV India Expo 2026

HIMTEX 2026

India Refining Summit 2026

India EV Show 2026

EV tech India Expo 2026
Whitepaper
- Middle East & Africa Commercial Security Market Click here to view more.
- Middle East & Africa Fire Safety Systems & Equipment Market Click here to view more.
- GCC Drone Market Click here to view more.
- Middle East Lighting Fixture Market Click here to view more.
- GCC Physical & Perimeter Security Market Click here to view more.