United States (US) Perchloroethylene Market (2026-2032) Outlook | Value, Size, Revenue, Trends, Share, Companies, Forecast, Analysis, Growth & Industry
Market Forecast By Type (Ethylene Oxychlorination, Acetylene Method, Ethylene Direct Chlorination), By End-use (Dry Cleaning Agent, Solvent, Others) And Competitive Landscape
| Product Code: ETC337981 | Publication Date: Aug 2022 | Updated Date: Jul 2026 | Product Type: Market Research Report | |
| Publisher: 6Wresearch | Author: Dhaval Chaurasia | No. of Pages: 75 | No. of Figures: 35 | No. of Tables: 20 |
United States (US) Perchloroethylene Market Size, Share & Growth Rate
The United States (US) Perchloroethylene Market was estimated at USD 82 Million in 2025 and is projected to reach USD 97 Million by 2032, growing at a CAGR of 2.4% from 2026 to 2032. This growth trajectory is primarily fueled by the robust demand for perchloroethylene in the dry cleaning and textile sectors, where it remains the solvent of choice due to its unmatched stain removal capabilities. Additionally, the automotive and industrial sectors are driving further demand, although the market faces pressures from increasing environmental regulations.
United States (US) Perchloroethylene Market Year-wise Growth Rate and Key Drivers
This graph highlights how the United States (US) Perchloroethylene Market has steadily grown over the years, supported by major growth factors.
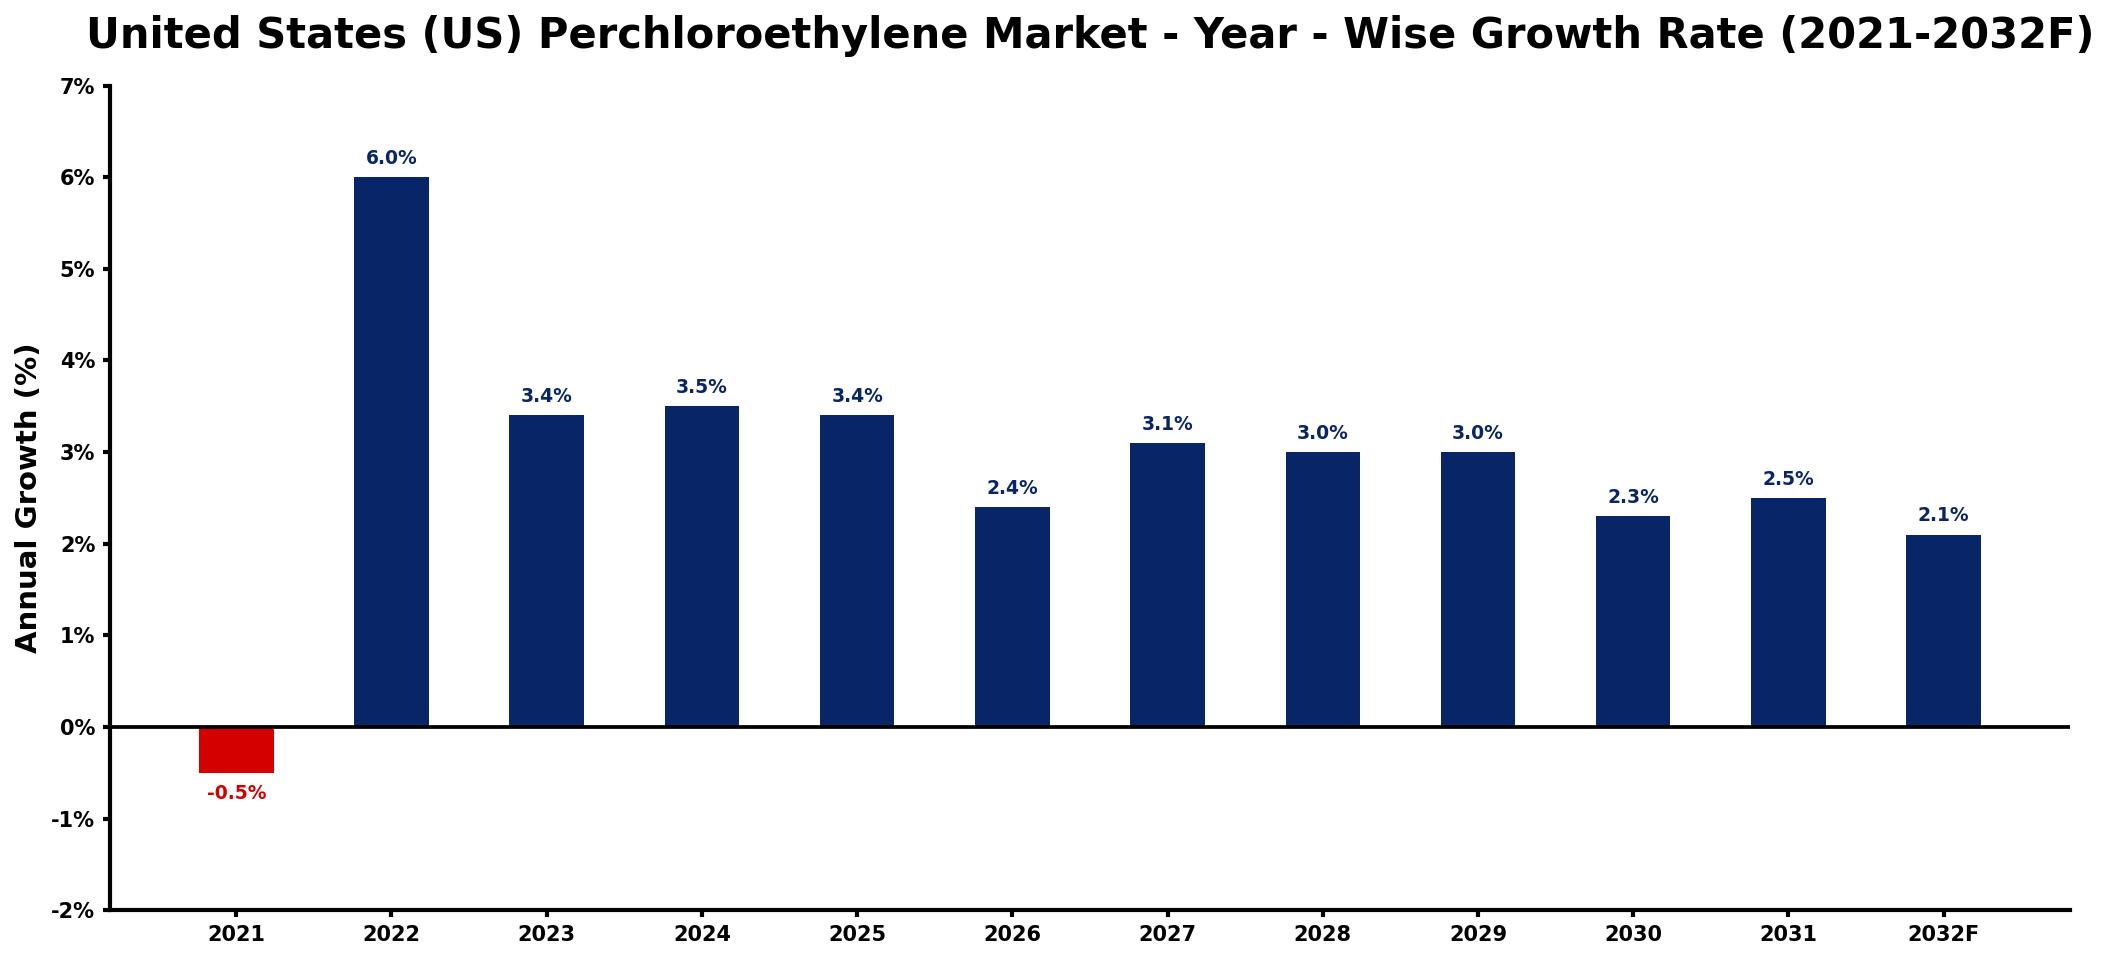
The table below presents the year‑wise growth rates along with the key drivers influencing the market
| Year | Growth Rate | Major Drivers |
| 2021 | -0.5% | Environmental regulations impacting usage |
| 2022 | 6.0% | Increased demand for dry cleaning |
| 2023 | 3.4% | Growth in industrial cleaning applications |
| 2024 | 3.5% | Expansion of automotive service sector |
| 2025 | 3.4% | Rising investments in manufacturing processes |
| 2026 | 2.4% | Increased focus on solvent recycling |
| 2027 | 3.1% | rising infrastructure development spending |
| 2028 | 3.0% | Emergence of innovative cleaning technologies |
| 2029 | 3.0% | Rising demand for specialty solvents |
| 2030 | 2.3% | improved raw material availability |
| 2031 | 2.5% | Increased adoption in electronics manufacturing |
| 2032 | 2.1% | increased pharmaceutical industry usage |
Note: Market size estimations and growth projections presented in this report are based on 6Wresearch's proprietary forecasting methodology, utilizing the latest available industry data, government publications, and primary research inputs.
United States (US) Perchloroethylene Market Synopsis
The recent performance of the US Perchloroethylene market has been marked by steady demand stemming from traditional applications in dry cleaning and textile processing. However, as awareness of environmental impacts grows, the industry is at a crossroads, navigating between established practices and the imperative for more sustainable solutions.
Looking ahead, the market is poised for transformation. While perchloroethylene continues to be essential in several industries, shifting consumer preferences and regulatory pressures may accelerate the transition towards greener alternatives. This duality presents both challenges and opportunities as stakeholders adapt to evolving market dynamics.
United States (US) Perchloroethylene Market Key Takeaways
- Perchloroethylene remains a crucial solvent in the dry cleaning and textile industries, driving market stability.
- The automotive sector is increasingly adopting perchloroethylene for its effective degreasing properties.
- Environmental regulations are leading to the development of eco-friendly alternatives, impacting traditional demand.
- Investment in R&D for sustainable practices is essential for companies to remain competitive.
- The market is expected to grow steadily, reflecting a balance between traditional usage and innovative solutions.
Evaluation of Restraints in United States (US) Perchloroethylene Market
Despite its historical importance, the US Perchloroethylene market faces significant restraints that could limit its growth potential. Chief among these are the stringent regulatory frameworks imposed by environmental agencies, which seek to mitigate the health risks associated with perchloroethylene exposure. Compliance with these regulations often necessitates costly investments in equipment upgrades and operational changes.
Moreover, the rising awareness and demand for safer, more eco-friendly cleaning solutions among consumers present a formidable challenge. As alternatives become more accessible and favored, companies reliant on perchloroethylene must adapt or risk losing market share. This shift necessitates innovative approaches to remain relevant in an evolving landscape.
United States (US) Perchloroethylene Market Trends
Several key trends are currently shaping the US Perchloroethylene market. One prominent trend is the growing emphasis on sustainability, pushing companies to explore and invest in green chemistry solutions. This includes the development of alternative cleaning agents that mitigate environmental impact while maintaining performance.
Additionally, advancements in technology are enhancing the efficiency and safety of perchloroethylene applications. As businesses strive for compliance with environmental regulations, there is a concerted effort to improve processes that minimize emissions and waste. These trends indicate a market in transition, balancing traditional practices with the necessity for innovation.
United States (US) Perchloroethylene Market Opportunities
The US Perchloroethylene market presents several promising investment opportunities for stakeholders. As demand from industries such as dry cleaning and textiles continues to rise, there is significant potential for modernizing facilities to meet new regulatory standards. Investment in R&D focused on alternative solvents is also critical, as the market shifts towards more sustainable solutions.
Moreover, opportunities exist in recycling and waste management initiatives related to perchloroethylene, addressing both environmental concerns and compliance challenges. This focus on sustainability not only aligns with current market demands but also positions companies to thrive amidst increasing regulatory scrutiny.
Government Initiatives in the United States (US) Perchloroethylene Market
The US government has enacted various initiatives aimed at regulating perchloroethylene to safeguard public health and the environment. The Environmental Protection Agency (EPA) oversees emissions controls under the Clean Air Act, imposing limits on perchloroethylene releases from dry cleaning establishments. Additionally, the Toxic Substances Control Act (TSCA) governs the entire lifecycle of perchloroethylene, from manufacturing to disposal.
These initiatives reinforce the importance of safe handling and usage practices. The Occupational Safety and Health Administration (OSHA) further regulates workplace exposure standards to protect workers in industries that utilize perchloroethylene. Collectively, these policies aim to mitigate the risks associated with perchloroethylene while encouraging the industry to evolve responsibly.
Future Insights of the United States (US) Perchloroethylene Market
Looking towards 2026-2032, the outlook for the US Perchloroethylene market remains optimistic. The demand for perchloroethylene, particularly within the dry cleaning and textile sectors, is expected to sustain steady growth. However, the push for environmental responsibility will likely catalyze innovations in production and alternative cleaning agents.
As consumer preferences shift towards more sustainable choices, companies that embrace green practices and invest in R&D are likely to gain a competitive edge. The future will require a careful balancing act, ensuring that traditional applications of perchloroethylene are maintained while embracing necessary changes to align with environmental standards.
United States (US) Perchloroethylene Market Latest Developments (2025 - 2026)
In the past year, the US Perchloroethylene market has witnessed notable developments, primarily driven by an increase in regulatory scrutiny and a rising commitment to sustainability among industry players. Several companies have announced initiatives aimed at improving their environmental footprint by investing in innovative solvent technologies and enhancing operational efficiencies. Additionally, collaborations with research institutions have emerged, focused on creating safer alternatives to perchloroethylene, reflecting the industry's shift towards greener practices.
United States (US) Perchloroethylene Market - Key Attractiveness of the Report
- 10 Years of Market Numbers
- Historical Data Starting from 2022 to 2025
- Base Year: 2025
- Forecast Data until 2032
- Key Performance Indicators Impacting the Market
- Major Upcoming Developments and Projects
Key Highlights of the Report:
- United States (US) Perchloroethylene Market Outlook
- Market Size of United States (US) Perchloroethylene Market, 2025
- Forecast of United States (US) Perchloroethylene Market, 2032
- Historical Data and Forecast of United States (US) Perchloroethylene Revenues & Volume for the Period 2022-2032F
- United States (US) Perchloroethylene Market Trend Evolution
- United States (US) Perchloroethylene Market Drivers and Challenges
- United States (US) Perchloroethylene Price Trends
- United States (US) Perchloroethylene Porter's Five Forces
- United States (US) Perchloroethylene Industry Life Cycle
- Historical Data and Forecast of United States (US) Perchloroethylene Market Revenues & Volume By Type for the Period 2022-2032F
- Historical Data and Forecast of United States (US) Perchloroethylene Market Revenues & Volume By Ethylene Oxychlorination for the Period 2022-2032F
- Historical Data and Forecast of United States (US) Perchloroethylene Market Revenues & Volume By Acetylene Method for the Period 2022-2032F
- Historical Data and Forecast of United States (US) Perchloroethylene Market Revenues & Volume By Ethylene Direct Chlorination for the Period 2022-2032F
- Historical Data and Forecast of United States (US) Perchloroethylene Market Revenues & Volume By End-use for the Period 2022-2032F
- Historical Data and Forecast of United States (US) Perchloroethylene Market Revenues & Volume By Dry Cleaning Agent for the Period 2022-2032F
- Historical Data and Forecast of United States (US) Perchloroethylene Market Revenues & Volume By Solvent for the Period 2022-2032F
- Historical Data and Forecast of United States (US) Perchloroethylene Market Revenues & Volume By Others for the Period 2022-2032F
- United States (US) Perchloroethylene Import Export Trade Statistics
- Market Opportunity Assessment By Type
- Market Opportunity Assessment By End-use
- United States (US) Perchloroethylene Top Companies Market Share
- United States (US) Perchloroethylene Competitive Benchmarking By Technical and Operational Parameters
- United States (US) Perchloroethylene Company Profiles
- United States (US) Perchloroethylene Key Strategic Recommendations
Frequently Asked Questions About the Market Study (FAQs):
The US Perchloroethylene market is projected to grow at a CAGR of 2.4% from 2026 to 2032, reflecting steady demand across several industries.
The dry cleaning and textile industries are the primary consumers of perchloroethylene, while its application in the automotive sector is also gaining traction due to its effectiveness in degreasing.
Stricter environmental regulations are prompting businesses to seek alternative solvents and invest in upgrading their facilities to meet compliance standards, impacting the overall demand for perchloroethylene.
Investment opportunities lie in R&D for sustainable alternatives, modernization of existing facilities, and recycling initiatives, addressing the industry's move towards eco-friendliness.
Government policies, such as the EPA regulations and OSHA standards, significantly influence the handling, usage, and emissions of perchloroethylene, ensuring public safety and environmental protection.
6Wresearch actively monitors the United States (US) Perchloroethylene Market and publishes its comprehensive annual report, highlighting emerging trends, growth drivers, revenue analysis, and forecast outlook. Our insights help businesses to make data-backed strategic decisions with ongoing market dynamics. Our analysts track relevent industries related to the United States (US) Perchloroethylene Market, allowing our clients with actionable intelligence and reliable forecasts tailored to emerging regional needs.
Yes, we provide customisation as per your requirements. To learn more, feel free to contact us on sales@6wresearch.com
1 Executive Summary |
2 Introduction |
2.1 Key Highlights of the Report |
2.2 Report Description |
2.3 Market Scope & Segmentation |
2.4 Research Methodology |
2.5 Assumptions |
3 United States (US) Perchloroethylene Market Overview |
3.1 United States (US) Country Macro Economic Indicators |
3.2 United States (US) Perchloroethylene Market Revenues & Volume, 2022 & 2032F |
3.3 United States (US) Perchloroethylene Market - Industry Life Cycle |
3.4 United States (US) Perchloroethylene Market - Porter's Five Forces |
3.5 United States (US) Perchloroethylene Market Revenues & Volume Share, By Type, 2022 & 2032F |
3.6 United States (US) Perchloroethylene Market Revenues & Volume Share, By End-use, 2022 & 2032F |
4 United States (US) Perchloroethylene Market Dynamics |
4.1 Impact Analysis |
4.2 Market Drivers |
4.2.1 Increasing demand for perchloroethylene for dry cleaning applications due to its superior cleaning properties compared to alternative solvents. |
4.2.2 Growth in the automotive industry leading to higher demand for perchloroethylene for degreasing and cleaning automotive parts. |
4.2.3 Rising adoption of perchloroethylene in the manufacturing sector for metal cleaning and as a solvent in various industrial processes. |
4.3 Market Restraints |
4.3.1 Stringent regulations regarding the use and disposal of perchloroethylene due to its potential environmental and health hazards. |
4.3.2 Shift towards eco-friendly and sustainable alternatives to perchloroethylene, such as hydrocarbon-based solvents or aqueous cleaning processes. |
5 United States (US) Perchloroethylene Market Trends |
6 United States (US) Perchloroethylene Market, By Types |
6.1 United States (US) Perchloroethylene Market, By Type |
6.1.1 Overview and Analysis |
6.1.2 United States (US) Perchloroethylene Market Revenues & Volume, By Type, 2022-2032F |
6.1.3 United States (US) Perchloroethylene Market Revenues & Volume, By Ethylene Oxychlorination, 2022-2032F |
6.1.4 United States (US) Perchloroethylene Market Revenues & Volume, By Acetylene Method, 2022-2032F |
6.1.5 United States (US) Perchloroethylene Market Revenues & Volume, By Ethylene Direct Chlorination, 2022-2032F |
6.2 United States (US) Perchloroethylene Market, By End-use |
6.2.1 Overview and Analysis |
6.2.2 United States (US) Perchloroethylene Market Revenues & Volume, By Dry Cleaning Agent, 2022-2032F |
6.2.3 United States (US) Perchloroethylene Market Revenues & Volume, By Solvent, 2022-2032F |
6.2.4 United States (US) Perchloroethylene Market Revenues & Volume, By Others, 2022-2032F |
7 United States (US) Perchloroethylene Market Import-Export Trade Statistics |
7.1 United States (US) Perchloroethylene Market Export to Major Countries |
7.2 United States (US) Perchloroethylene Market Imports from Major Countries |
8 United States (US) Perchloroethylene Market Key Performance Indicators |
8.1 Research and development investments in developing safer and more sustainable production methods for perchloroethylene. |
8.2 Adoption rate of alternative solvents in key industries that traditionally use perchloroethylene. |
8.3 Environmental impact assessments and remediation efforts related to perchloroethylene contamination sites. |
9 United States (US) Perchloroethylene Market - Opportunity Assessment |
9.1 United States (US) Perchloroethylene Market Opportunity Assessment, By Type, 2022 & 2032F |
9.2 United States (US) Perchloroethylene Market Opportunity Assessment, By End-use, 2022 & 2032F |
10 United States (US) Perchloroethylene Market - Competitive Landscape |
10.1 United States (US) Perchloroethylene Market Revenue Share, By Companies, 2025 |
10.2 United States (US) Perchloroethylene Market Competitive Benchmarking, By Operating and Technical Parameters |
11 Company Profiles |
12 Recommendations |
13 Disclaimer |
Global Go To Market Strategy - 2030
Export potential enables firms to identify high-growth global markets with greater confidence by combining advanced trade intelligence with a structured quantitative methodology. The framework analyzes emerging demand trends and country-level import patterns while integrating macroeconomic and trade datasets such as GDP and population forecasts, bilateral import–export flows, tariff structures, elasticity differentials between developed and developing economies, geographic distance, and import demand projections. Using weighted trade values from 2020–2024 as the base period to project country-to-country export potential for 2030, these inputs are operationalized through calculated drivers such as gravity model parameters, tariff impact factors, and projected GDP per-capita growth. Through an analysis of hidden potentials, demand hotspots, and market conditions that are most favorable to success, this method enables firms to focus on target countries, maximize returns, and global expansion with data, backed by accuracy.
By factoring in the projected importer demand gap that is currently unmet and could be potential opportunity, it identifies the potential for the Exporter (Country) among 190 countries, against the general trade analysis, which identifies the biggest importer or exporter.
To discover high-growth global markets and optimize your business strategy:
Click Here
Pricing
- Single User License$ 1,995
- Department License$ 2,400
- Site License$ 3,120
- Global License$ 3,795

Leadership Perspectives from Industry Events
Search
Thought Leadership and Analyst Meet


Our Clients
6WResearch In News
- India Air Conditioner Market Set for Strong Rebound in 2026 After Weather-Led Correction and GST-Driven Recovery: 6Wresearch
- ADAS in India: How Automatic Emergency Braking, Blind Spot Detection & Driver Monitoring are Transforming Road Safety
- Doha a strategic location for EV manufacturing hub: IPA Qatar
- Demand for luxury TVs surging in the GCC, says Samsung
- Empowering Growth: The Thriving Journey of Bangladesh’s Cable Industry
- Demand for luxury TVs surging in the GCC, says Samsung
Latest Reports
- Nicaragua RPG Gaming Market (2026-2032)
- New Zealand RPG Gaming Market (2026-2032)
- Netherlands RPG Gaming Market (2026-2032)
- Nauru RPG Gaming Market (2026-2032)
- Namibia RPG Gaming Market (2026-2032)
- Mozambique RPG Gaming Market (2026-2032)
- Montenegro RPG Gaming Market (2026-2032)
- Mongolia RPG Gaming Market (2026-2032)
- Monaco RPG Gaming Market (2026-2032)
- Micronesia RPG Gaming Market (2026-2032)
Industry Events and Analyst Meet

EV India Expo 2026

HIMTEX 2026

India Refining Summit 2026

India EV Show 2026

EV tech India Expo 2026
Whitepaper
- Middle East & Africa Commercial Security Market Click here to view more.
- Middle East & Africa Fire Safety Systems & Equipment Market Click here to view more.
- GCC Drone Market Click here to view more.
- Middle East Lighting Fixture Market Click here to view more.
- GCC Physical & Perimeter Security Market Click here to view more.