United States (US) Protective Clothing Market (2026-2032) Outlook | Revenue, Analysis, Share, Growth, Companies, Industry, Trends, Value, Forecast & Size
Market Forecast By Material Type (Aramid & Blends, Polyolefins & Blends, Polyamide, Pbi, Uhmw Pe, Cotton Fibers, Laminated Polyesters, Others), By Application (Thermal, Chemical, Mechanical, Biological/radiation, Visibility, Others), By End-use (Oil & Gas, Construction, Manufacturing, Healthcare/medical, Firefighting & Law Enforcement, Mining, Military, Warehouse & Logistics) And Competitive Landscape
| Product Code: ETC275581 | Publication Date: Aug 2022 | Updated Date: Jul 2026 | Product Type: Market Research Report | |
| Publisher: 6Wresearch | Author: Vasudha | No. of Pages: 75 | No. of Figures: 35 | No. of Tables: 20 |
United States (US) Protective Clothing Market Size, Share & Growth Rate
The United States (US) Protective Clothing Market was estimated at USD 151 Million in 2025 and is projected to reach USD 178 Million by 2032, growing at a CAGR of 2.4% from 2026 to 2032. This steady growth trajectory is primarily fueled by increasing regulatory requirements related to worker safety, along with heightened awareness regarding workplace hazards across various industries. As companies continue to prioritize employee protection, demand for diverse protective clothing solutions is expected to rise, driving innovations in material technology and design.
United States (US) Protective Clothing Market Year-wise Growth Rate and Key Drivers
This graph highlights how the United States (US) Protective Clothing Market has steadily grown over the years, supported by major growth factors.
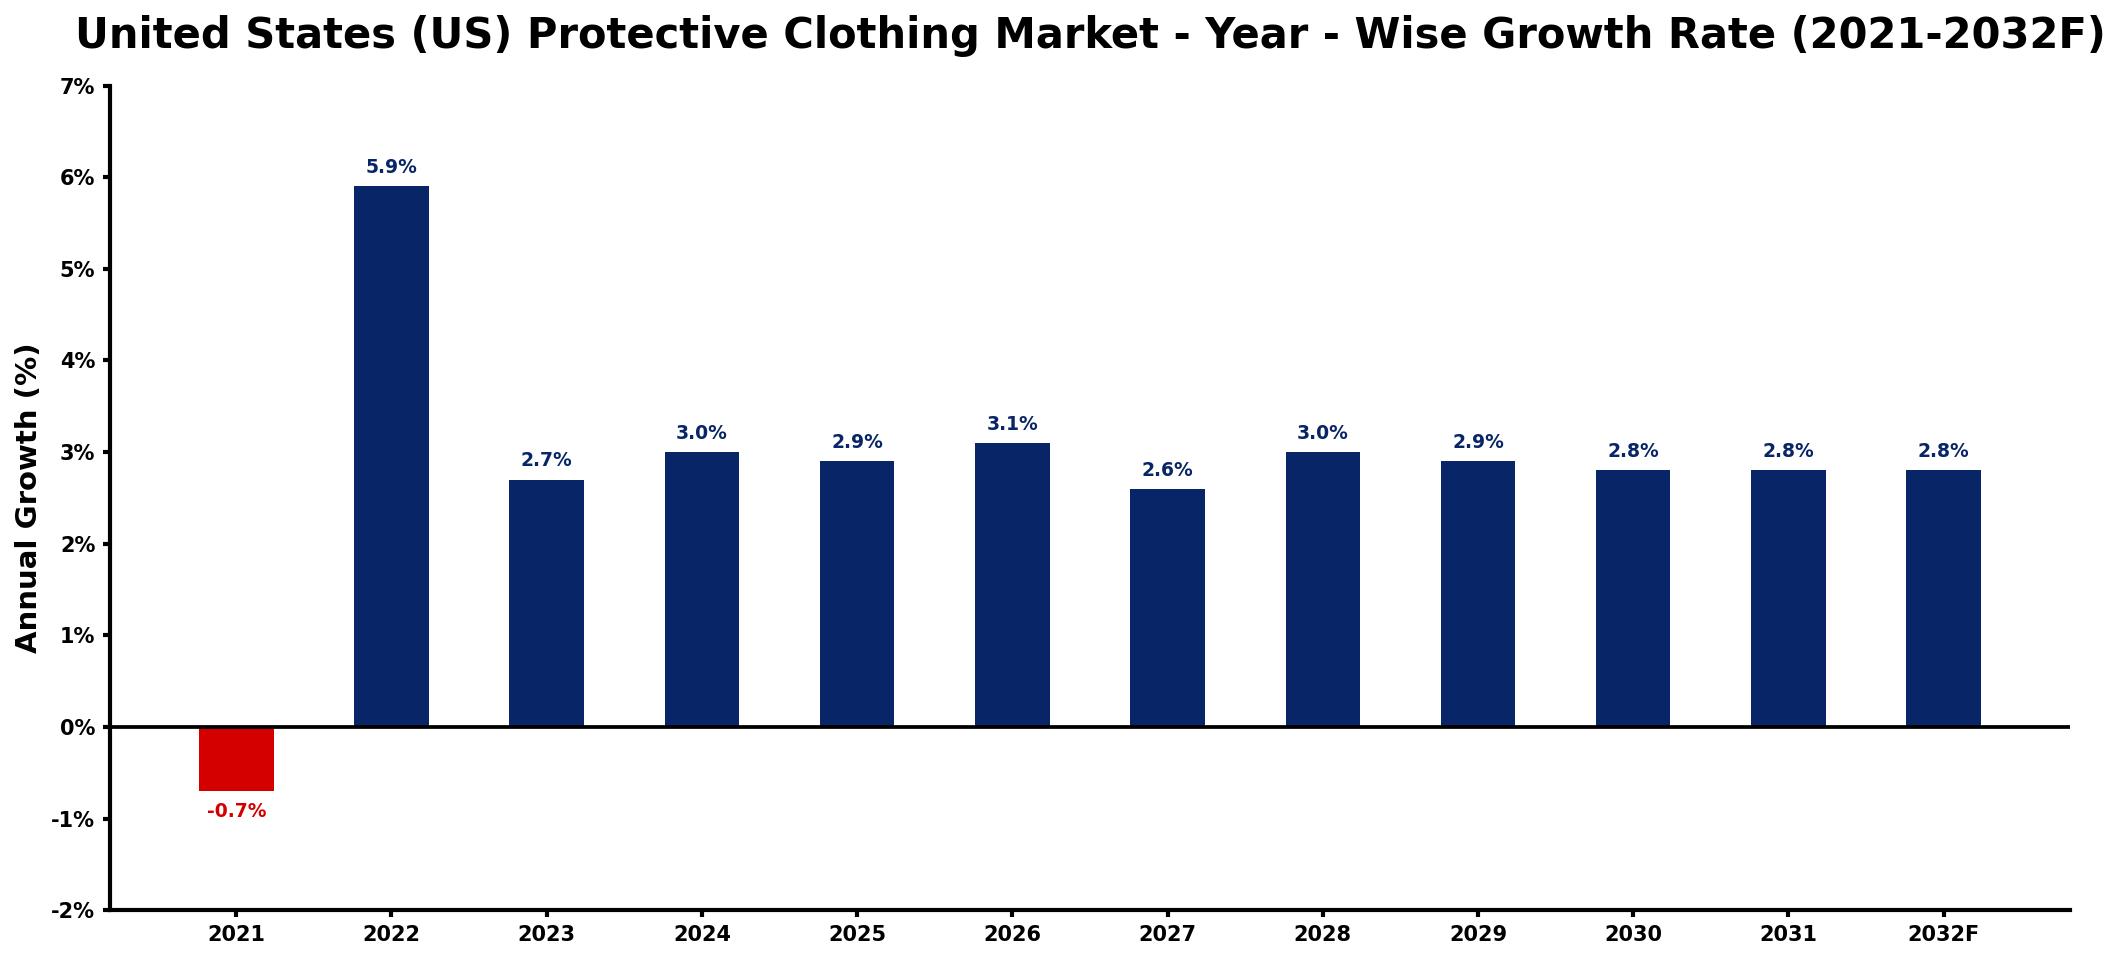
The table below presents the year‑wise growth rates along with the key drivers influencing the market
| Year | Growth Rate | Major Drivers |
| 2021 | -0.7% | COVID-19 pandemic impacts operations |
| 2022 | 5.9% | Increased industrial safety regulations |
| 2023 | 2.7% | Expansion of healthcare facilities investment |
| 2024 | 3.0% | Rise in construction sector activities |
| 2025 | 2.9% | Growth in manufacturing sector demand |
| 2026 | 3.1% | enhanced product quality standards |
| 2027 | 2.6% | Enhanced focus on worker safety |
| 2028 | 3.0% | Advancements in material technology |
| 2029 | 2.9% | Growing awareness of workplace hazards |
| 2030 | 2.8% | Increase in emergency response training |
| 2031 | 2.8% | expanding manufacturing base activity |
| 2032 | 2.8% | Investment in sustainable production methods |
Note: Market size estimations and growth projections presented in this report are based on 6Wresearch's proprietary forecasting methodology, utilizing the latest available industry data, government publications, and primary research inputs.
United States (US) Protective Clothing Market Synopsis
In the US, the demand for protective clothing has gained significant momentum, particularly within the construction and manufacturing sectors. These industries are increasingly recognizing the importance of high-quality protective gear that not only ensures safety but also complies with stringent regulatory frameworks.
Moreover, healthcare professionals are actively seeking protective clothing that combines safety with comfort and style. The market has thus seen an emergence of fashionable yet functional options, catering to diverse consumer needs while promoting adherence to safety standards.
United States (US) Protective Clothing Market Key Takeaways
- The US Protective Clothing Market is projected to grow steadily, reflecting increasing safety regulations and awareness.
- Advancements in material technologies are paving the way for innovative product offerings.
- Sustainability initiatives are influencing manufacturers to develop eco-friendly protective clothing options.
- Customization and fashionable designs are becoming vital factors in consumer purchasing decisions.
- Investment opportunities are notably strong in specialized sectors such as healthcare and oil & gas.
Evaluation of Restraints in United States (US) Protective Clothing Market
Despite its growth prospects, the US Protective Clothing Market faces considerable restraints. Intense competition among manufacturers often leads to pricing pressures, affecting profit margins. Moreover, the necessity for continuous innovation poses a challenge, as firms must adapt to evolving safety regulations to stay relevant. The fluctuations in raw material costs, compounded by supply chain disruptions from global events, further complicate the operational landscape for manufacturers. These factors necessitate strategic planning and robust management to navigate effectively.
United States (US) Protective Clothing Market Trends
A significant trend in the US Protective Clothing Market is the shift towards sustainability. As environmental concerns gain traction, manufacturers are increasingly incorporating recycled and biodegradable materials into their offerings. Additionally, the introduction of smart textiles, embedded with wearable sensors, is revolutionizing the functionality of protective clothing, enhancing safety and monitoring capabilities. The demand for stylish yet protective gear is also rising, particularly in sectors where appearance and safety are both critical.
United States (US) Protective Clothing Market Opportunities
The landscape for investment in the US protective clothing market is promising, especially with the consistent push for enhanced worker safety across various sectors. There is a significant demand for high-quality protective gear that addresses risks such as chemical exposure, flames, and biological hazards. Notably, companies focusing on the development of cutting-edge materials and smart technology stand to gain substantial market traction. Furthermore, the growing inclination towards sustainable practices opens avenues for businesses specializing in eco-friendly protective clothing solutions.
Government Initiatives in the United States (US) Protective Clothing Market
Government policies in the US protective clothing sector emphasize ensuring worker safety through compliance with standards set forth by organizations like OSHA and NIOSH. These regulations mandate the use of suitable protective clothing to mitigate workplace injuries and illnesses. Additionally, government procurement policies can significantly influence demand in key sectors such as healthcare and defense, where adherence to safety regulations is paramount. The government also supports R&D initiatives, fostering innovation within the protective clothing market.
Future Insights of the United States (US) Protective Clothing Market
Looking ahead, the US Protective Clothing Market is poised for ongoing growth from 2026 to 2032, propelled by a combination of heightened awareness of workplace safety and the advent of innovative materials technology. As regulations continue to tighten, demand for protective clothing across construction, healthcare, and manufacturing will likely increase, reinforcing the importance of worker safety. Companies that prioritize employee well-being and adapt to evolving standards will be well-positioned to capture market opportunities and drive sustained growth.
United States (US) Protective Clothing Market Latest Developments (2025 - 2026)
Recent developments in the US protective clothing industry highlight a notable shift toward enhanced functionality and sustainability. Manufacturers are actively pursuing innovations, integrating smart textiles that enhance user safety and comfort. Additionally, there has been an increased focus on sustainable materials, with many firms transitioning to eco-friendly production practices. The market is also seeing a rise in partnerships aimed at developing specialized protective gear tailored to unique industry requirements.
United States (US) Protective Clothing Market - Key Attractiveness of the Report
- 10 Years of Market Numbers
- Historical Data Starting from 2022 to 2025
- Base Year: 2025
- Forecast Data until 2032
- Key Performance Indicators Impacting the Market
- Major Upcoming Developments and Projects
Key Highlights of the Report:
- United States (US) Protective Clothing Market Outlook
- Market Size of United States (US) Protective Clothing Market, 2025
- Forecast of United States (US) Protective Clothing Market, 2032
- Historical Data and Forecast of United States (US) Protective Clothing Revenues & Volume for the Period 2022-2032F
- United States (US) Protective Clothing Market Trend Evolution
- United States (US) Protective Clothing Market Drivers and Challenges
- United States (US) Protective Clothing Price Trends
- United States (US) Protective Clothing Porter's Five Forces
- United States (US) Protective Clothing Industry Life Cycle
- Historical Data and Forecast of United States (US) Protective Clothing Market Revenues & Volume By Material Type for the Period 2022-2032F
- Historical Data and Forecast of United States (US) Protective Clothing Market Revenues & Volume By Aramid & Blends for the Period 2022-2032F
- Historical Data and Forecast of United States (US) Protective Clothing Market Revenues & Volume By Polyolefins & Blends for the Period 2022-2032F
- Historical Data and Forecast of United States (US) Protective Clothing Market Revenues & Volume By Polyamide for the Period 2022-2032F
- Historical Data and Forecast of United States (US) Protective Clothing Market Revenues & Volume By Pbi for the Period 2022-2032F
- Historical Data and Forecast of United States (US) Protective Clothing Market Revenues & Volume By Uhmw Pe for the Period 2022-2032F
- Historical Data and Forecast of United States (US) Protective Clothing Market Revenues & Volume By Cotton Fibers for the Period 2022-2032F
- Historical Data and Forecast of United States (US) Protective Clothing Market Revenues & Volume By Laminated Polyesters for the Period 2022-2032F
- Historical Data and Forecast of United States (US) Aramid & Blends Protective Clothing Market Revenues & Volume By Others for the Period 2022-2032F
- Historical Data and Forecast of United States (US) Protective Clothing Market Revenues & Volume By Application for the Period 2022-2032F
- Historical Data and Forecast of United States (US) Protective Clothing Market Revenues & Volume By Thermal for the Period 2022-2032F
- Historical Data and Forecast of United States (US) Protective Clothing Market Revenues & Volume By Chemical for the Period 2022-2032F
- Historical Data and Forecast of United States (US) Protective Clothing Market Revenues & Volume By Mechanical for the Period 2022-2032F
- Historical Data and Forecast of United States (US) Protective Clothing Market Revenues & Volume By Biological/radiation for the Period 2022-2032F
- Historical Data and Forecast of United States (US) Protective Clothing Market Revenues & Volume By Visibility for the Period 2022-2032F
- Historical Data and Forecast of United States (US) Protective Clothing Market Revenues & Volume By Others for the Period 2022-2032F
- Historical Data and Forecast of United States (US) Protective Clothing Market Revenues & Volume By End-use for the Period 2022-2032F
- Historical Data and Forecast of United States (US) Protective Clothing Market Revenues & Volume By Oil & Gas for the Period 2022-2032F
- Historical Data and Forecast of United States (US) Protective Clothing Market Revenues & Volume By Construction for the Period 2022-2032F
- Historical Data and Forecast of United States (US) Protective Clothing Market Revenues & Volume By Manufacturing for the Period 2022-2032F
- Historical Data and Forecast of United States (US) Protective Clothing Market Revenues & Volume By Healthcare/medical for the Period 2022-2032F
- Historical Data and Forecast of United States (US) Protective Clothing Market Revenues & Volume By Firefighting & Law Enforcement for the Period 2022-2032F
- Historical Data and Forecast of United States (US) Protective Clothing Market Revenues & Volume By Mining for the Period 2022-2032F
- Historical Data and Forecast of United States (US) Protective Clothing Market Revenues & Volume By Military for the Period 2022-2032F
- Historical Data and Forecast of United States (US) Protective Clothing Market Revenues & Volume By Warehouse & Logistics for the Period 2022-2032F
- United States (US) Protective Clothing Import Export Trade Statistics
- Market Opportunity Assessment By Material Type
- Market Opportunity Assessment By Application
- Market Opportunity Assessment By End-use
- United States (US) Protective Clothing Top Companies Market Share
- United States (US) Protective Clothing Competitive Benchmarking By Technical and Operational Parameters
- United States (US) Protective Clothing Company Profiles
- United States (US) Protective Clothing Key Strategic Recommendations
Frequently Asked Questions About the Market Study (FAQs):
The US Protective Clothing Market is set to grow from USD 151 Million in 2025 to USD 178 Million by 2032, reflecting a CAGR of 2.4% from 2026 to 2032. This growth is mainly driven by stricter safety regulations and increasing awareness of workplace hazards.
Major sectors driving the demand include healthcare, construction, manufacturing, and oil & gas. These industries prioritize safety and are subject to stringent regulations that necessitate the use of protective clothing.
Manufacturers are increasingly adopting eco-friendly materials and practices, utilizing recycled and biodegradable fabrics to cater to environmentally-conscious consumers. This shift is becoming critical as sustainability concerns grow.
The integration of smart textiles and wearable technology is revolutionizing the industry, enhancing the functionality and safety of protective clothing. These innovations allow for real-time monitoring of worker conditions, significantly improving safety standards.
Government policies set by OSHA and NIOSH play a vital role in shaping the market. Regulations mandate the use of appropriate protective clothing in various industries to mitigate workplace injuries, directly influencing demand.
6Wresearch actively monitors the United States (US) Protective Clothing Market and publishes its comprehensive annual report, highlighting emerging trends, growth drivers, revenue analysis, and forecast outlook. Our insights help businesses to make data-backed strategic decisions with ongoing market dynamics. Our analysts track relevent industries related to the United States (US) Protective Clothing Market, allowing our clients with actionable intelligence and reliable forecasts tailored to emerging regional needs.
Yes, we provide customisation as per your requirements. To learn more, feel free to contact us on sales@6wresearch.com
1 Executive Summary |
2 Introduction |
2.1 Key Highlights of the Report |
2.2 Report Description |
2.3 Market Scope & Segmentation |
2.4 Research Methodology |
2.5 Assumptions |
3 United States (US) Protective Clothing Market Overview |
3.1 United States (US) Country Macro Economic Indicators |
3.2 United States (US) Protective Clothing Market Revenues & Volume, 2022 & 2032F |
3.3 United States (US) Protective Clothing Market - Industry Life Cycle |
3.4 United States (US) Protective Clothing Market - Porter's Five Forces |
3.5 United States (US) Protective Clothing Market Revenues & Volume Share, By Material Type, 2022 & 2032F |
3.6 United States (US) Protective Clothing Market Revenues & Volume Share, By Application, 2022 & 2032F |
3.7 United States (US) Protective Clothing Market Revenues & Volume Share, By End-use, 2022 & 2032F |
4 United States (US) Protective Clothing Market Dynamics |
4.1 Impact Analysis |
4.2 Market Drivers |
4.2.1 Stringent workplace safety regulations in the US requiring the use of protective clothing |
4.2.2 Increasing awareness about the importance of personal protective equipment (PPE) among workers |
4.2.3 Growth in industries such as construction, healthcare, and manufacturing that require protective clothing |
4.3 Market Restraints |
4.3.1 Fluctuating raw material prices affecting the production cost of protective clothing |
4.3.2 Competition from low-cost manufacturers in other countries impacting domestic market share |
4.3.3 Economic downturns leading to reduced spending on non-essential items like protective clothing |
5 United States (US) Protective Clothing Market Trends |
6 United States (US) Protective Clothing Market, By Types |
6.1 United States (US) Protective Clothing Market, By Material Type |
6.1.1 Overview and Analysis |
6.1.2 United States (US) Protective Clothing Market Revenues & Volume, By Material Type, 2022-2032F |
6.1.3 United States (US) Protective Clothing Market Revenues & Volume, By Aramid & Blends, 2022-2032F |
6.1.4 United States (US) Protective Clothing Market Revenues & Volume, By Polyolefins & Blends, 2022-2032F |
6.1.5 United States (US) Protective Clothing Market Revenues & Volume, By Polyamide, 2022-2032F |
6.1.6 United States (US) Protective Clothing Market Revenues & Volume, By Pbi, 2022-2032F |
6.1.7 United States (US) Protective Clothing Market Revenues & Volume, By Uhmw Pe, 2022-2032F |
6.1.8 United States (US) Protective Clothing Market Revenues & Volume, By Cotton Fibers, 2022-2032F |
6.1.9 United States (US) Protective Clothing Market Revenues & Volume, By Others, 2022-2032F |
6.1.10 United States (US) Protective Clothing Market Revenues & Volume, By Others, 2022-2032F |
6.2 United States (US) Protective Clothing Market, By Application |
6.2.1 Overview and Analysis |
6.2.2 United States (US) Protective Clothing Market Revenues & Volume, By Thermal, 2022-2032F |
6.2.3 United States (US) Protective Clothing Market Revenues & Volume, By Chemical, 2022-2032F |
6.2.4 United States (US) Protective Clothing Market Revenues & Volume, By Mechanical, 2022-2032F |
6.2.5 United States (US) Protective Clothing Market Revenues & Volume, By Biological/radiation, 2022-2032F |
6.2.6 United States (US) Protective Clothing Market Revenues & Volume, By Visibility, 2022-2032F |
6.2.7 United States (US) Protective Clothing Market Revenues & Volume, By Others, 2022-2032F |
6.3 United States (US) Protective Clothing Market, By End-use |
6.3.1 Overview and Analysis |
6.3.2 United States (US) Protective Clothing Market Revenues & Volume, By Oil & Gas, 2022-2032F |
6.3.3 United States (US) Protective Clothing Market Revenues & Volume, By Construction, 2022-2032F |
6.3.4 United States (US) Protective Clothing Market Revenues & Volume, By Manufacturing, 2022-2032F |
6.3.5 United States (US) Protective Clothing Market Revenues & Volume, By Healthcare/medical, 2022-2032F |
6.3.6 United States (US) Protective Clothing Market Revenues & Volume, By Firefighting & Law Enforcement, 2022-2032F |
6.3.7 United States (US) Protective Clothing Market Revenues & Volume, By Mining, 2022-2032F |
6.3.8 United States (US) Protective Clothing Market Revenues & Volume, By Warehouse & Logistics, 2022-2032F |
6.3.9 United States (US) Protective Clothing Market Revenues & Volume, By Warehouse & Logistics, 2022-2032F |
7 United States (US) Protective Clothing Market Import-Export Trade Statistics |
7.1 United States (US) Protective Clothing Market Export to Major Countries |
7.2 United States (US) Protective Clothing Market Imports from Major Countries |
8 United States (US) Protective Clothing Market Key Performance Indicators |
8.1 Percentage of companies compliant with safety regulations regarding protective clothing usage |
8.2 Number of workplace accidents or injuries reported in industries requiring protective clothing |
8.3 Adoption rate of innovative materials or technologies in the production of protective clothing |
9 United States (US) Protective Clothing Market - Opportunity Assessment |
9.1 United States (US) Protective Clothing Market Opportunity Assessment, By Material Type, 2022 & 2032F |
9.2 United States (US) Protective Clothing Market Opportunity Assessment, By Application, 2022 & 2032F |
9.3 United States (US) Protective Clothing Market Opportunity Assessment, By End-use, 2022 & 2032F |
10 United States (US) Protective Clothing Market - Competitive Landscape |
10.1 United States (US) Protective Clothing Market Revenue Share, By Companies, 2025 |
10.2 United States (US) Protective Clothing Market Competitive Benchmarking, By Operating and Technical Parameters |
11 Company Profiles |
12 Recommendations |
13 Disclaimer |
Global Go To Market Strategy - 2030
Export potential enables firms to identify high-growth global markets with greater confidence by combining advanced trade intelligence with a structured quantitative methodology. The framework analyzes emerging demand trends and country-level import patterns while integrating macroeconomic and trade datasets such as GDP and population forecasts, bilateral import–export flows, tariff structures, elasticity differentials between developed and developing economies, geographic distance, and import demand projections. Using weighted trade values from 2020–2024 as the base period to project country-to-country export potential for 2030, these inputs are operationalized through calculated drivers such as gravity model parameters, tariff impact factors, and projected GDP per-capita growth. Through an analysis of hidden potentials, demand hotspots, and market conditions that are most favorable to success, this method enables firms to focus on target countries, maximize returns, and global expansion with data, backed by accuracy.
By factoring in the projected importer demand gap that is currently unmet and could be potential opportunity, it identifies the potential for the Exporter (Country) among 190 countries, against the general trade analysis, which identifies the biggest importer or exporter.
To discover high-growth global markets and optimize your business strategy:
Click Here
Pricing
- Single User License$ 1,995
- Department License$ 2,400
- Site License$ 3,120
- Global License$ 3,795

Leadership Perspectives from Industry Events
Search
Thought Leadership and Analyst Meet


Our Clients
6WResearch In News
- India Air Conditioner Market Set for Strong Rebound in 2026 After Weather-Led Correction and GST-Driven Recovery: 6Wresearch
- ADAS in India: How Automatic Emergency Braking, Blind Spot Detection & Driver Monitoring are Transforming Road Safety
- Doha a strategic location for EV manufacturing hub: IPA Qatar
- Demand for luxury TVs surging in the GCC, says Samsung
- Empowering Growth: The Thriving Journey of Bangladesh’s Cable Industry
- Demand for luxury TVs surging in the GCC, says Samsung
Latest Reports
- Nicaragua RPG Gaming Market (2026-2032)
- New Zealand RPG Gaming Market (2026-2032)
- Netherlands RPG Gaming Market (2026-2032)
- Nauru RPG Gaming Market (2026-2032)
- Namibia RPG Gaming Market (2026-2032)
- Mozambique RPG Gaming Market (2026-2032)
- Montenegro RPG Gaming Market (2026-2032)
- Mongolia RPG Gaming Market (2026-2032)
- Monaco RPG Gaming Market (2026-2032)
- Micronesia RPG Gaming Market (2026-2032)
Industry Events and Analyst Meet

EV India Expo 2026

HIMTEX 2026

India Refining Summit 2026

India EV Show 2026

EV tech India Expo 2026
Whitepaper
- Middle East & Africa Commercial Security Market Click here to view more.
- Middle East & Africa Fire Safety Systems & Equipment Market Click here to view more.
- GCC Drone Market Click here to view more.
- Middle East Lighting Fixture Market Click here to view more.
- GCC Physical & Perimeter Security Market Click here to view more.