United States (US) Silver Cyanide Market (2026-2032) Outlook | Growth, Trends, Size, Value, Analysis, Forecast, Share, Industry, Revenue, Companies
Market Forecast By Purity (Low Purity , High Purity), By Form (Solid, Powder), By Application (Electronic Components , Silver Plating , Metal Surface Treatment , Chemicals & Salts , Research), By End-Use Industries (Manufacturing , Laboratory , Chemicals) And Competitive Landscape
| Product Code: ETC199573 | Publication Date: May 2022 | Updated Date: Jun 2026 | Product Type: Market Research Report | |
| Publisher: 6Wresearch | Author: Vasudha | No. of Pages: 60 | No. of Figures: 40 | No. of Tables: 7 |
United States (US) Silver Cyanide Market Size, Share & Growth Rate
The United States (US) Silver Cyanide Market was estimated at USD 203 Million in 2025 and is projected to reach USD 238 Million by 2032, growing at a CAGR of 2.3% from 2026 to 2032. This steady growth trajectory is fueled primarily by the increasing demand from the electronics, jewelry, and automotive sectors, which utilize silver cyanide for its superior conductive properties. As these industries advance, particularly with new electroplating techniques, the need for high-quality silver-coated products will continue to drive market expansion.
United States (US) Silver Cyanide Market Year-wise Growth Rate and Key Drivers
This graph highlights how the United States (US) Silver Cyanide Market has steadily grown over the years, supported by major growth factors.
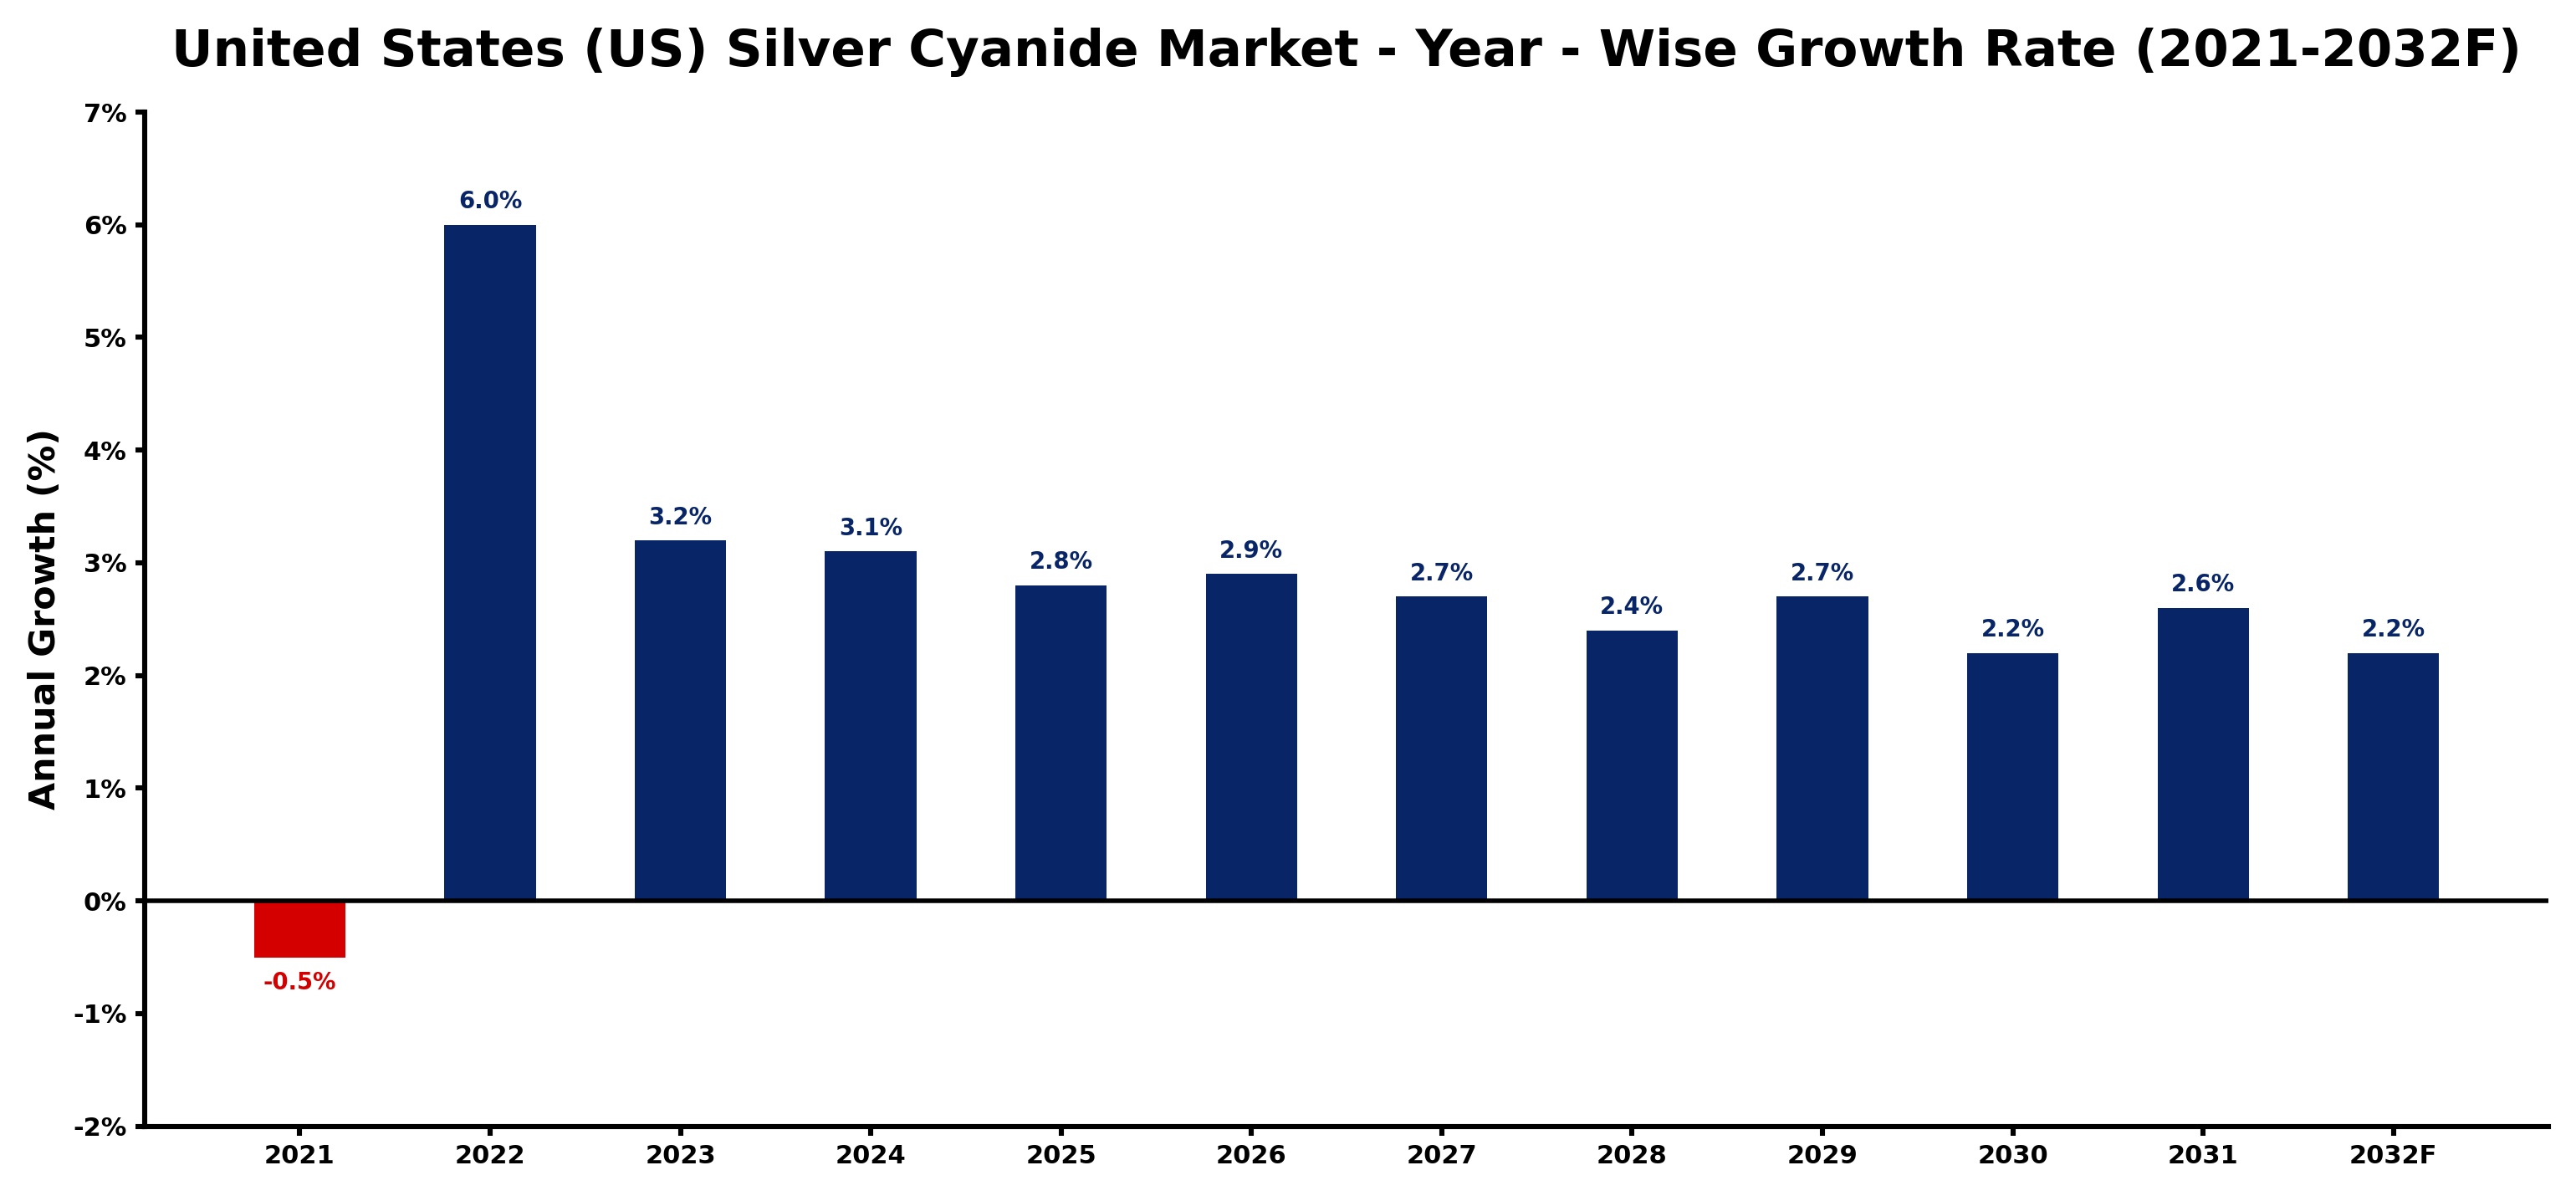
The table below presents the year‑wise growth rates along with the key drivers influencing the market
| Year | Growth Rate | Major Drivers |
| 2021 | -0.5% | Regulatory scrutiny limited production |
| 2022 | 6.0% | Increased industrial applications emerged |
| 2023 | 3.2% | Rising demand from electronics sector |
| 2024 | 3.1% | Growth in jewelry manufacturing sector |
| 2025 | 2.8% | Expansion of mining operations occurred |
| 2026 | 2.9% | Technological advancements enhanced efficiency |
| 2027 | 2.7% | Emerging markets increased consumption rates |
| 2028 | 2.4% | Sustainability initiatives drove innovation |
| 2029 | 2.7% | Collaborations with manufacturers expanded |
| 2030 | 2.2% | Market diversification strategies implemented |
| 2031 | 2.6% | Investment in research and development |
| 2032 | 2.2% | Consumer awareness of quality improved |
Note - Market size estimations and growth projections presented in this report are based on 6Wresearch’s advanced forecasting approach, validated with industry datasets as of June 2026.
United States (US) Silver Cyanide Market Synopsis
In recent years, the US Silver Cyanide Market has demonstrated a resilient momentum, primarily due to a robust demand for silver in various applications. However, as the landscape evolves, the market is increasingly navigating a path defined by environmental regulations and a shift towards alternative, less toxic compounds. This creates a complex duality where growth and sustainability must coexist.
Looking ahead, the market is expected to maintain its moderate growth, driven by innovation in electroplating and an evolving regulatory environment. The ongoing emphasis on sustainable practices within the manufacturing sectors poses both challenges and opportunities, prompting businesses to innovate while adhering to strict compliance standards.
United States (US) Silver Cyanide Market Key Takeaways
- The market is influenced by the dual forces of increasing demand from traditional industries and the rising call for sustainable practices.
- Regulatory compliance related to cyanide usage is becoming increasingly complex, impacting operational strategies.
- There is notable interest in developing alternative compounds to silver cyanide in various sectors, particularly in response to environmental concerns.
- Investment opportunities are burgeoning in silver mining and eco-friendly chemical manufacturing as market players adapt to changing demands.
- The jewelry manufacturing segment is projected to experience growth driven by the demand for high-quality silver products.
Evaluation of Restraints in United States (US) Silver Cyanide Market
The US Silver Cyanide Market faces significant restraints primarily rooted in stringent regulatory frameworks governing the use and disposal of cyanide compounds. These regulations often increase compliance costs and operational complexities, deterring new entrants and challenging existing players. Furthermore, the volatility in silver prices introduces another layer of unpredictability, influencing production costs and market demand. The emergence of alternative technologies, such as non-cyanide plating solutions, also competes directly with traditional silver cyanide applications, posing a threat to market stability.
United States (US) Silver Cyanide Market Trends
Several current and emerging trends are shaping the US Silver Cyanide Market. The acceleration of technological advancements in electroplating is enhancing the efficiency and effectiveness of silver applications, driving demand. Additionally, the push for eco-friendliness is compelling manufacturers to explore and develop safer alternatives to conventional cyanide compounds. There is a growing awareness surrounding the toxicity of cyanide, which is resulting in a strong shift towards sustainable manufacturing practices that balance productivity and environmental responsibility.
United States (US) Silver Cyanide Market Opportunities
Investment opportunities abound in the US Silver Cyanide Market, particularly within the realms of mining, chemical manufacturing, and sustainable jewelry production. The increasing need for silver across various industries, such as electronics and healthcare, solidifies silver cyanide's status as a critical component in electroplating. Moreover, investors can benefit from aligning with companies that prioritize eco-friendly practices, catering to the growing market demand for ethically sourced materials and processes.
Government Initiatives in the United States (US) Silver Cyanide Market
The regulatory environment surrounding the US Silver Cyanide Market is predominantly shaped by agencies like the Environmental Protection Agency (EPA) and the Occupational Safety and Health Administration (OSHA). These organizations establish safety and compliance standards aimed at minimizing the environmental and health impacts of cyanide use. Furthermore, the FDA may impose specific regulations regarding silver cyanide applications in pharmaceuticals and food packaging, reflecting the market's diverse applications. These regulatory frameworks necessitate that businesses remain vigilant and proactive in their compliance efforts to ensure long-term operational viability.
Future Insights of the United States (US) Silver Cyanide Market
The future of the United States Silver Cyanide Market appears bright, with steady demand anticipated from key sectors like electronics, automotive, and healthcare. As advancements in technology and sustainable practices continue to evolve, the market is poised for moderate growth. Regulatory pressures will remain a key factor influencing market dynamics, necessitating ongoing innovation and adaptation among industry players. The successful navigation of these opportunities, combined with a commitment to sustainable practices, will define the market landscape from 2026 to 2032.
United States (US) Silver Cyanide Market Latest Developments (May 2025 - June 2026)
Recent developments in the US Silver Cyanide Market indicate a shift towards incorporating more sustainable practices in manufacturing processes. Companies are increasingly exploring advanced electroplating technologies that reduce the environmental impact of cyanide usage. Additionally, partnerships and collaborations focused on research and innovation are becoming more prevalent, as market players strive to develop safer alternatives to traditional silver cyanide products.
United States (US) Silver Cyanide Market - Key Attractiveness of the Report
- 10 Years of Market Numbers
- Historical Data Starting from 2022 to 2025
- Base Year: 2025
- Forecast Data until 2032
- Key Performance Indicators Impacting the Market
- Major Upcoming Developments and Projects
Key Highlights of the Report:
- United States (US) Silver Cyanide Market Outlook
- Market Size of United States (US) Silver Cyanide Market, 2025
- Forecast of United States (US) Silver Cyanide Market, 2032
- Historical Data and Forecast of United States (US) Silver Cyanide Revenues & Volume for the Period 2022-2032F
- United States (US) Silver Cyanide Market Trend Evolution
- United States (US) Silver Cyanide Market Drivers and Challenges
- United States (US) Silver Cyanide Price Trends
- United States (US) Silver Cyanide Porter's Five Forces
- United States (US) Silver Cyanide Industry Life Cycle
- Historical Data and Forecast of United States (US) Silver Cyanide Market Revenues & Volume By Purity for the Period 2022-2032F
- Historical Data and Forecast of United States (US) Silver Cyanide Market Revenues & Volume By Low Purity for the Period 2022-2032F
- Historical Data and Forecast of United States (US) Silver Cyanide Market Revenues & Volume By High Purity for the Period 2022-2032F
- Historical Data and Forecast of United States (US) Silver Cyanide Market Revenues & Volume By Form for the Period 2022-2032F
- Historical Data and Forecast of United States (US) Silver Cyanide Market Revenues & Volume By Solid for the Period 2022-2032F
- Historical Data and Forecast of United States (US) Silver Cyanide Market Revenues & Volume By Powder for the Period 2022-2032F
- Historical Data and Forecast of United States (US) Silver Cyanide Market Revenues & Volume By Application for the Period 2022-2032F
- Historical Data and Forecast of United States (US) Silver Cyanide Market Revenues & Volume By Electronic Components for the Period 2022-2032F
- Historical Data and Forecast of United States (US) Silver Cyanide Market Revenues & Volume By Silver Plating for the Period 2022-2032F
- Historical Data and Forecast of United States (US) Silver Cyanide Market Revenues & Volume By Metal Surface Treatment for the Period 2022-2032F
- Historical Data and Forecast of United States (US) Silver Cyanide Market Revenues & Volume By Chemicals & Salts for the Period 2022-2032F
- Historical Data and Forecast of United States (US) Silver Cyanide Market Revenues & Volume By Research for the Period 2022-2032F
- Historical Data and Forecast of United States (US) Silver Cyanide Market Revenues & Volume By End-Use Industries for the Period 2022-2032F
- Historical Data and Forecast of United States (US) Silver Cyanide Market Revenues & Volume By Manufacturing for the Period 2022-2032F
- Historical Data and Forecast of United States (US) Silver Cyanide Market Revenues & Volume By Laboratory for the Period 2022-2032F
- Historical Data and Forecast of United States (US) Silver Cyanide Market Revenues & Volume By Chemicals for the Period 2022-2032F
- United States (US) Silver Cyanide Import Export Trade Statistics
- Market Opportunity Assessment By Purity
- Market Opportunity Assessment By Form
- Market Opportunity Assessment By Application
- Market Opportunity Assessment By End-Use Industries
- United States (US) Silver Cyanide Top Companies Market Share
- United States (US) Silver Cyanide Competitive Benchmarking By Technical and Operational Parameters
- United States (US) Silver Cyanide Company Profiles
- United States (US) Silver Cyanide Key Strategic Recommendations
United States (US) Silver Cyanide Market - Frequently Asked Questions
The market was estimated at USD 203 Million in 2025 and is projected to reach USD 238 Million by 2032, growing at a CAGR of 2.3% from 2026 to 2032. This growth will primarily be driven by the demand from the electronics and automotive industries.
The primary industries driving demand include electronics, jewelry, automotive, and pharmaceuticals. Each of these sectors relies on silver cyanide for its excellent conductivity and corrosion resistance properties.
Companies face strict regulations regarding the handling, usage, and disposal of cyanide compounds due to their toxic nature. Compliance with these regulations is essential to avoid penalties and maintain safe operations.
Many manufacturers are investing in research and development to create safer alternatives to silver cyanide and to adopt eco-friendly practices in their production processes. This shift aims to align with increasing regulatory demands and consumer preferences.
Investors can find opportunities in silver mining, eco-friendly chemical manufacturing, and sustainable jewelry production. The ongoing demand across diverse industries ensures a steady market outlook for potential investments.
6Wresearch actively monitors the United States (US) Silver Cyanide Market and publishes its comprehensive annual report, highlighting emerging trends, growth drivers, revenue analysis, and forecast outlook. Our insights help businesses to make data-backed strategic decisions with ongoing market dynamics. Our analysts track relevent industries related to the United States (US) Silver Cyanide Market, allowing our clients with actionable intelligence and reliable forecasts tailored to emerging regional needs.
Yes, we provide customisation as per your requirements. To learn more, feel free to contact us on sales@6wresearch.com
1 Executive Summary |
2 Introduction |
2.1 Key Highlights of the Report |
2.2 Report Description |
2.3 Market Scope & Segmentation |
2.4 Research Methodology |
2.5 Assumptions |
3 United States (US) Silver Cyanide Market Overview |
3.1 United States (US) Country Macro Economic Indicators |
3.2 United States (US) Silver Cyanide Market Revenues & Volume, 2022 & 2032F |
3.3 United States (US) Silver Cyanide Market - Industry Life Cycle |
3.4 United States (US) Silver Cyanide Market - Porter's Five Forces |
3.5 United States (US) Silver Cyanide Market Revenues & Volume Share, By Purity, 2022 & 2032F |
3.6 United States (US) Silver Cyanide Market Revenues & Volume Share, By Form, 2022 & 2032F |
3.7 United States (US) Silver Cyanide Market Revenues & Volume Share, By Application, 2022 & 2032F |
3.8 United States (US) Silver Cyanide Market Revenues & Volume Share, By End-Use Industries, 2022 & 2032F |
4 United States (US) Silver Cyanide Market Dynamics |
4.1 Impact Analysis |
4.2 Market Drivers |
4.2.1 Growing demand for silver cyanide in the electronics industry for electroplating applications |
4.2.2 Increasing use of silver cyanide in the pharmaceutical industry for chemical synthesis processes |
4.2.3 Rise in silver mining activities leading to higher production of silver cyanide |
4.3 Market Restraints |
4.3.1 Stringent regulations and environmental concerns regarding the handling and disposal of silver cyanide |
4.3.2 Fluctuating silver prices affecting the cost of production for silver cyanide manufacturers |
5 United States (US) Silver Cyanide Market Trends |
6 United States (US) Silver Cyanide Market, By Types |
6.1 United States (US) Silver Cyanide Market, By Purity |
6.1.1 Overview and Analysis |
6.1.2 United States (US) Silver Cyanide Market Revenues & Volume, By Purity, 2022-2032F |
6.1.3 United States (US) Silver Cyanide Market Revenues & Volume, By Low Purity , 2022-2032F |
6.1.4 United States (US) Silver Cyanide Market Revenues & Volume, By High Purity, 2022-2032F |
6.2 United States (US) Silver Cyanide Market, By Form |
6.2.1 Overview and Analysis |
6.2.2 United States (US) Silver Cyanide Market Revenues & Volume, By Solid, 2022-2032F |
6.2.3 United States (US) Silver Cyanide Market Revenues & Volume, By Powder, 2022-2032F |
6.3 United States (US) Silver Cyanide Market, By Application |
6.3.1 Overview and Analysis |
6.3.2 United States (US) Silver Cyanide Market Revenues & Volume, By Electronic Components , 2022-2032F |
6.3.3 United States (US) Silver Cyanide Market Revenues & Volume, By Silver Plating , 2022-2032F |
6.3.4 United States (US) Silver Cyanide Market Revenues & Volume, By Metal Surface Treatment , 2022-2032F |
6.3.5 United States (US) Silver Cyanide Market Revenues & Volume, By Chemicals & Salts , 2022-2032F |
6.3.6 United States (US) Silver Cyanide Market Revenues & Volume, By Research, 2022-2032F |
6.4 United States (US) Silver Cyanide Market, By End-Use Industries |
6.4.1 Overview and Analysis |
6.4.2 United States (US) Silver Cyanide Market Revenues & Volume, By Manufacturing , 2022-2032F |
6.4.3 United States (US) Silver Cyanide Market Revenues & Volume, By Laboratory , 2022-2032F |
6.4.4 United States (US) Silver Cyanide Market Revenues & Volume, By Chemicals, 2022-2032F |
7 United States (US) Silver Cyanide Market Import-Export Trade Statistics |
7.1 United States (US) Silver Cyanide Market Export to Major Countries |
7.2 United States (US) Silver Cyanide Market Imports from Major Countries |
8 United States (US) Silver Cyanide Market Key Performance Indicators |
8.1 Average selling price of silver cyanide in the US market |
8.2 Number of patents filed for silver cyanide-related technologies |
8.3 Amount of silver cyanide used in key industries such as electronics and pharmaceuticals |
9 United States (US) Silver Cyanide Market - Opportunity Assessment |
9.1 United States (US) Silver Cyanide Market Opportunity Assessment, By Purity, 2022 & 2032F |
9.2 United States (US) Silver Cyanide Market Opportunity Assessment, By Form, 2022 & 2032F |
9.3 United States (US) Silver Cyanide Market Opportunity Assessment, By Application, 2022 & 2032F |
9.4 United States (US) Silver Cyanide Market Opportunity Assessment, By End-Use Industries, 2022 & 2032F |
10 United States (US) Silver Cyanide Market - Competitive Landscape |
10.1 United States (US) Silver Cyanide Market Revenue Share, By Companies, 2025 |
10.2 United States (US) Silver Cyanide Market Competitive Benchmarking, By Operating and Technical Parameters |
11 Company Profiles |
12 Recommendations |
13 Disclaimer |
Global Go To Market Strategy - 2030
Export potential enables firms to identify high-growth global markets with greater confidence by combining advanced trade intelligence with a structured quantitative methodology. The framework analyzes emerging demand trends and country-level import patterns while integrating macroeconomic and trade datasets such as GDP and population forecasts, bilateral import–export flows, tariff structures, elasticity differentials between developed and developing economies, geographic distance, and import demand projections. Using weighted trade values from 2020–2024 as the base period to project country-to-country export potential for 2030, these inputs are operationalized through calculated drivers such as gravity model parameters, tariff impact factors, and projected GDP per-capita growth. Through an analysis of hidden potentials, demand hotspots, and market conditions that are most favorable to success, this method enables firms to focus on target countries, maximize returns, and global expansion with data, backed by accuracy.
By factoring in the projected importer demand gap that is currently unmet and could be potential opportunity, it identifies the potential for the Exporter (Country) among 190 countries, against the general trade analysis, which identifies the biggest importer or exporter.
To discover high-growth global markets and optimize your business strategy:
Click Here
Pricing
- Single User License$ 1,995
- Department License$ 2,400
- Site License$ 3,120
- Global License$ 3,795

Leadership Perspectives from Industry Events
Search
Thought Leadership and Analyst Meet


Our Clients
6WResearch In News
- India Air Conditioner Market Set for Strong Rebound in 2026 After Weather-Led Correction and GST-Driven Recovery: 6Wresearch
- ADAS in India: How Automatic Emergency Braking, Blind Spot Detection & Driver Monitoring are Transforming Road Safety
- Doha a strategic location for EV manufacturing hub: IPA Qatar
- Demand for luxury TVs surging in the GCC, says Samsung
- Empowering Growth: The Thriving Journey of Bangladesh’s Cable Industry
- Demand for luxury TVs surging in the GCC, says Samsung
Latest Reports
- Nicaragua RPG Gaming Market (2026-2032)
- New Zealand RPG Gaming Market (2026-2032)
- Netherlands RPG Gaming Market (2026-2032)
- Nauru RPG Gaming Market (2026-2032)
- Namibia RPG Gaming Market (2026-2032)
- Mozambique RPG Gaming Market (2026-2032)
- Montenegro RPG Gaming Market (2026-2032)
- Mongolia RPG Gaming Market (2026-2032)
- Monaco RPG Gaming Market (2026-2032)
- Micronesia RPG Gaming Market (2026-2032)
Industry Events and Analyst Meet

EV India Expo 2026

HIMTEX 2026

India Refining Summit 2026

India EV Show 2026

EV tech India Expo 2026
Whitepaper
- Middle East & Africa Commercial Security Market Click here to view more.
- Middle East & Africa Fire Safety Systems & Equipment Market Click here to view more.
- GCC Drone Market Click here to view more.
- Middle East Lighting Fixture Market Click here to view more.
- GCC Physical & Perimeter Security Market Click here to view more.