United States (US) Sodium Percarbonate Market (2026-2032) Outlook | Revenue, Forecast, Size, Companies, Analysis, Value, Trends, Growth, Share & Industry
Market Forecast By Type (Coated, Uncoated, Tablet), By Application (Detergent Agent, Cleaning Agent, Bleaching Agent, Water Treatment, Others), By End-users (Household Cleaning, Laundry, Industrial Cleaning, Textile Industry, Chemical Industry, Papermaking Industry, Food Industry, Others) And Competitive Landscape
| Product Code: ETC091220 | Publication Date: Jun 2021 | Updated Date: Jun 2026 | Product Type: Report | |
| Publisher: 6Wresearch | Author: Ravi Bhandari | No. of Pages: 70 | No. of Figures: 35 | No. of Tables: 5 |
United States (US) Sodium Percarbonate Market Size, Share & Growth Rate
The United States (US) Sodium Percarbonate Market was estimated at USD 228 Million in 2025 and is projected to reach USD 268 Million by 2032, growing at a CAGR of 2.3% from 2026 to 2032. This growth trajectory is primarily fueled by a notable increase in consumer preference for eco-friendly and sustainable cleaning products, which has become a hallmark of modern purchasing behavior. The market is further propelled by the rising awareness surrounding the adverse effects of traditional chlorine-based cleaners on both human health and the environment.
United States (US) Sodium Percarbonate Market Year-wise Growth Rate and Key Drivers
This graph highlights how the United States (US) Sodium Percarbonate Market has steadily grown over the years, supported by major growth factors.
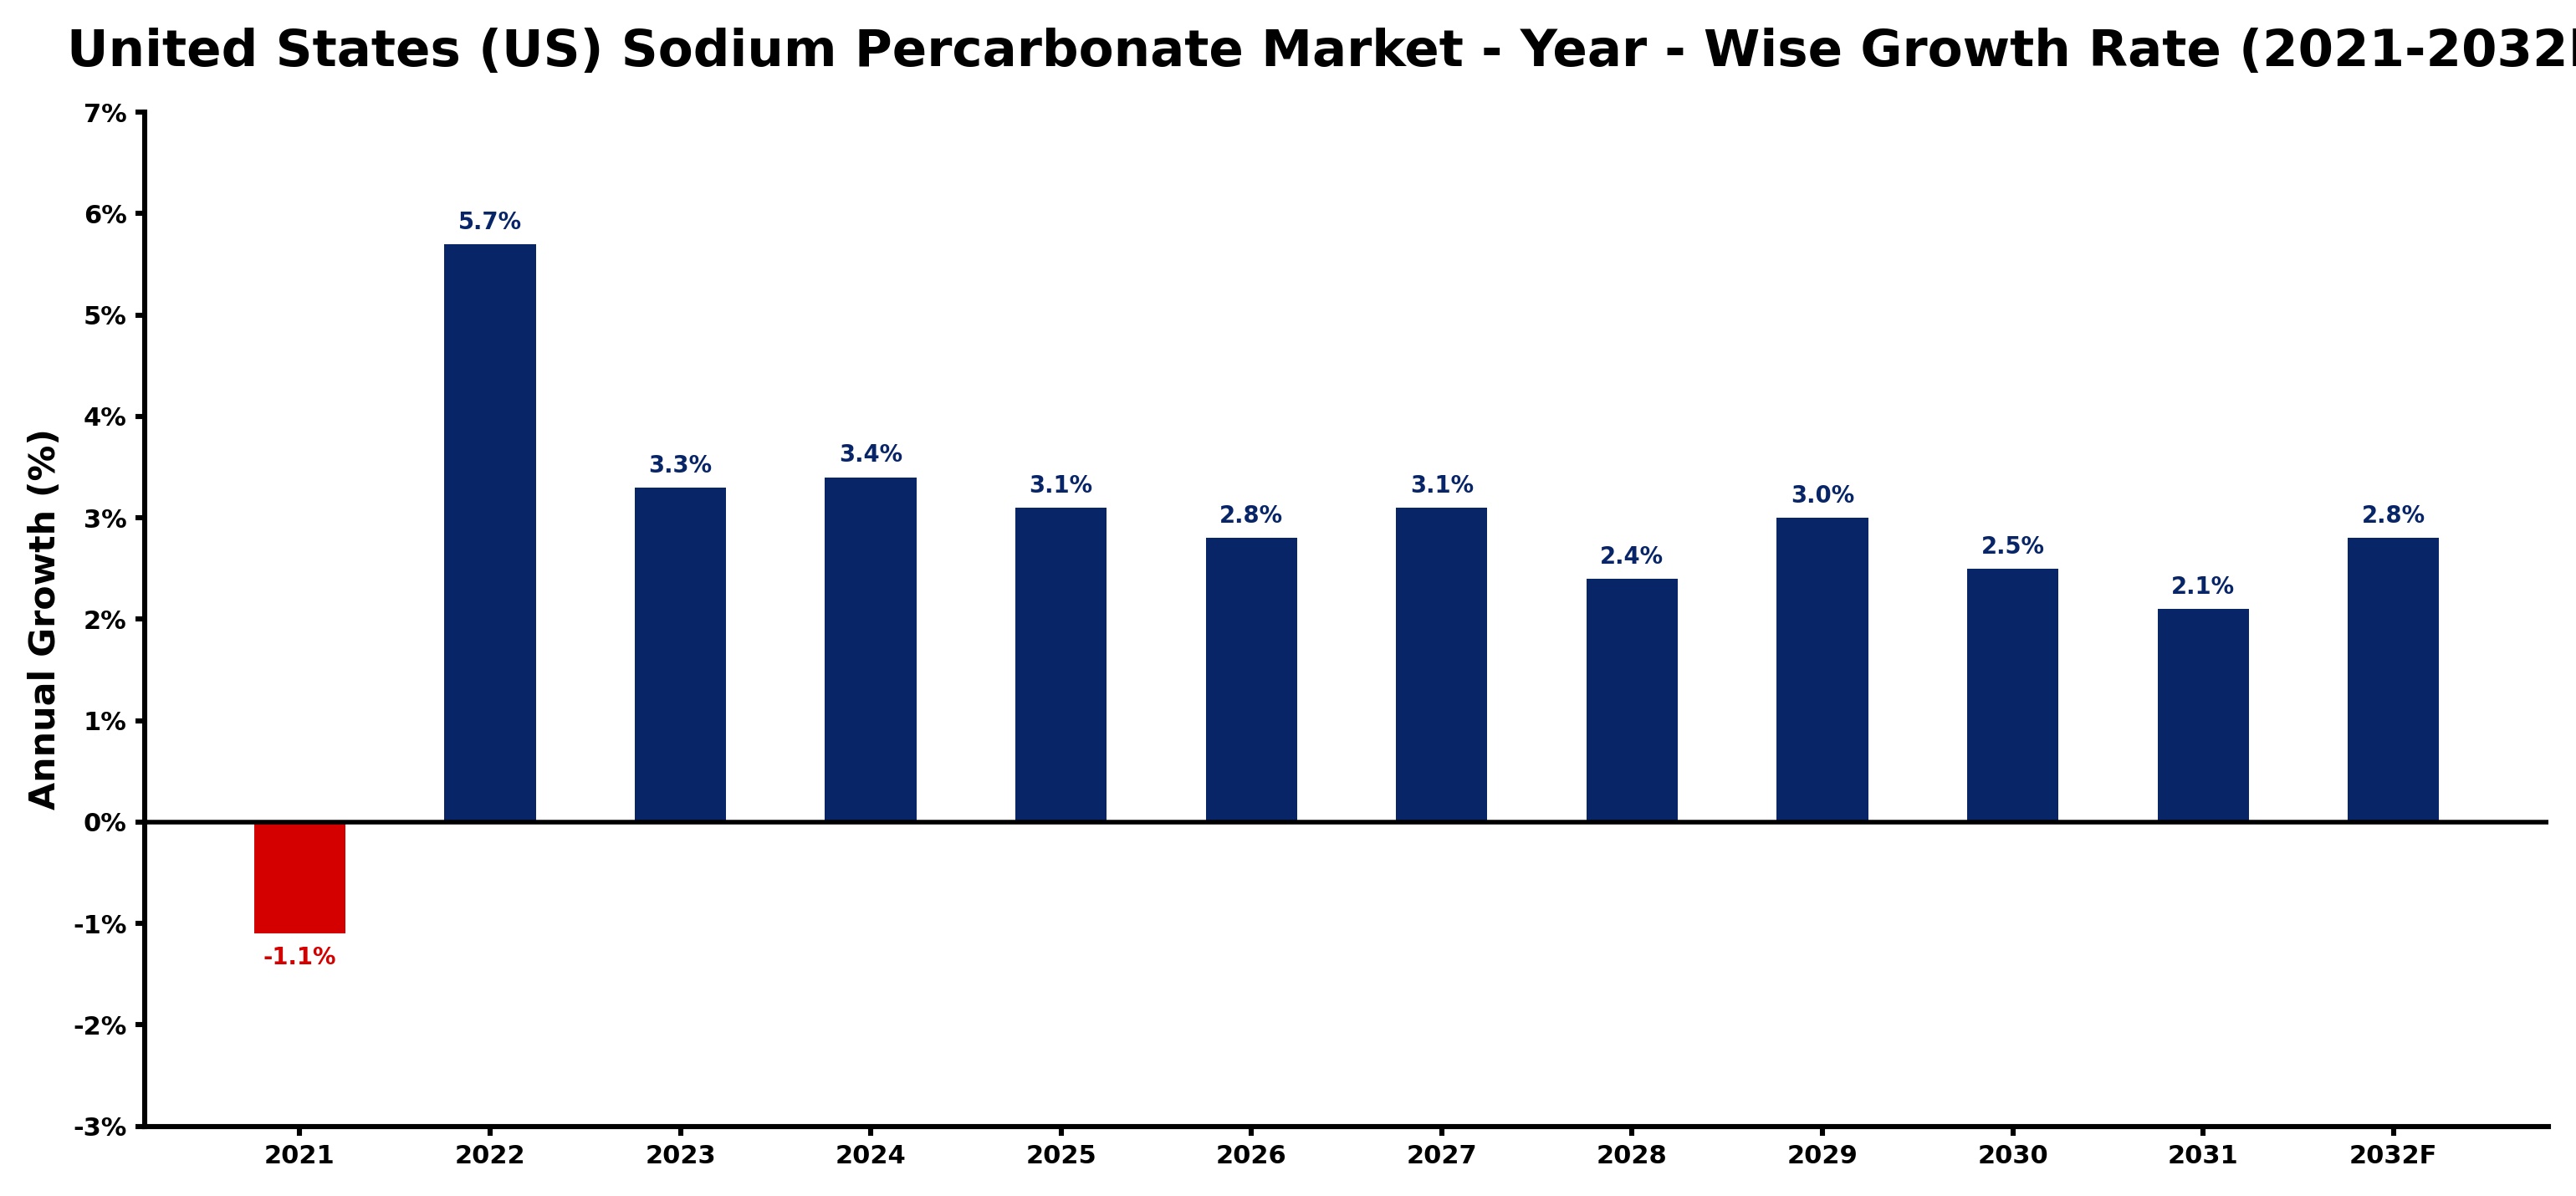
The table below presents the year‑wise growth rates along with the key drivers influencing the market
| Year | Growth Rate | Major Drivers |
| 2021 | -1.1% | Reduced consumer demand weakened sodium percarbonate production levels |
| 2022 | 5.7% | Domestic demand recovery boosts sodium percarbonate manufacturing output |
| 2023 | 3.3% | Technology integration in cleaning solutions boosts sodium percarbonate demand |
| 2024 | 3.4% | New manufacturing plants boost sodium percarbonate production capabilities |
| 2025 | 3.1% | New production facilities enhance sodium percarbonate supply chain resilience |
| 2026 | 2.8% | Improved production schedules boosted sodium percarbonate output efficiency |
| 2027 | 3.1% | Advanced manufacturing technology adoption drives sodium percarbonate production efficiency |
| 2028 | 2.4% | Sodium percarbonate production expansion bolstered household cleaning product formulation |
| 2029 | 3.0% | Consumer product manufacturers boost demand for cleaner production chemicals |
| 2030 | 2.5% | Improved manufacturing efficiency boosts sodium percarbonate production capabilities |
| 2031 | 2.1% | Domestic production investments boosted sodium percarbonate manufacturing capacity |
| 2032 | 2.8% | Chemical manufacturing investments boosted sodium percarbonate production efficiency |
Note - Market size estimations and growth projections presented in this report are based on 6Wresearch’s advanced forecasting approach, validated with industry datasets as of June 2026.
United States (US) Sodium Percarbonate Market Synopsis
The strongest force currently shaping the US Sodium Percarbonate Market is the shift towards environmentally sustainable cleaning solutions. As consumers become more environmentally conscious, the demand for sodium percarbonate, recognized for its oxygen-based bleaching capabilities, continues to rise. This trend is evidenced by its increasing incorporation into laundry detergents and household cleaning products.
In addition to consumer preferences, the expanding applications of sodium percarbonate in various industrial sectors, such as wastewater treatment and pulp bleaching, are also contributing to market growth. Manufacturers are now focusing on innovation and sustainable practices to meet the evolving expectations of eco-conscious consumers, which is further enhancing the market landscape.
United States (US) Sodium Percarbonate Market Key Takeaways
- The market is expected to grow steadily, driven by increasing demand for sustainable cleaning solutions.
- Awareness of the harmful impacts of traditional chemicals is pushing consumers towards sodium percarbonate.
- Investment opportunities are prevalent in production facilities and innovative formulation development.
- Government regulations are influencing the market, emphasizing environmental safety and worker protection.
- Strategic partnerships within the detergent and cleaning industries are critical for market competitiveness.
Evaluation of Restraints in United States (US) Sodium Percarbonate Market
While the US Sodium Percarbonate Market is on an upward trend, it faces several challenges that could impact its growth. Fluctuating raw material prices can significantly affect production costs, leading to pricing pressures in the market. Additionally, stringent regulatory measures related to environmental safety necessitate compliance that can be burdensome for manufacturers. The intense competition among key players further complicates market dynamics, as companies strive for product differentiation amidst a landscape of increasing consumer demand for sustainability. These challenges necessitate strategic approaches to R&D and marketing to maintain a competitive edge.
United States (US) Sodium Percarbonate Market Trends
Current trends are distinctly leaning towards the adoption of sodium percarbonate as a safe and eco-friendly alternative in the home cleaning product sector. This includes a growing interest in DIY cleaning solutions, where consumers are increasingly creating their own eco-friendly products at home using sodium percarbonate. The rise of e-commerce has also facilitated easier access to these products, thus broadening the consumer base. As manufacturers focus on product innovation, we can expect a wave of new formulations that combine efficacy with sustainability.
United States (US) Sodium Percarbonate Market Opportunities
The US Sodium Percarbonate Market presents significant investment opportunities, particularly in sectors that prioritize eco-friendly solutions. The expansion of production facilities tailored for sodium percarbonate and the research and development of innovative applications are poised to attract investors. Moreover, partnerships with cleaning product companies can enhance market reach and improve brand visibility, capitalizing on the growing consumer shift towards sustainability. As regulations become more stringent, businesses that prioritize compliance and innovation in sustainable practices stand to gain a competitive advantage.
Government Initiatives in the United States (US) Sodium Percarbonate Market
Government policies in the US significantly impact the Sodium Percarbonate Market, particularly regarding environmental regulations and safety standards. The Environmental Protection Agency (EPA) oversees the usage and disposal of sodium percarbonate, ensuring that environmental concerns are addressed. Manufacturers are required to adhere to strict guidelines regarding the handling, storage, and transportation of the chemical. Furthermore, the Occupational Safety and Health Administration (OSHA) enforces safety standards in workplaces, ensuring the well-being of employees involved in sodium percarbonate production and handling. Compliance with these regulations is imperative for companies operating within this space.
Future Insights of the United States (US) Sodium Percarbonate Market
Looking ahead to 2026-2032, the US Sodium Percarbonate Market is well-positioned for further expansion. As consumer demand for environmentally friendly products continues to grow, sodium percarbonate is likely to gain more prominence in both consumer and industrial applications. The increasing utilization of sodium percarbonate in agricultural practices for its oxygen-releasing properties will also provide new avenues for market growth. Furthermore, as regulatory pressures on conventional chemical cleaners tighten, the favorable eco-profile of sodium percarbonate will ensure its relevance and appeal in the evolving market landscape.
United States (US) Sodium Percarbonate Market Latest Developments (May 2025 - June 2026)
Recent industry developments indicate a surge in innovation as manufacturers explore new formulations of sodium percarbonate to meet changing consumer preferences. There is a growing focus on eco-friendly and biodegradable products in the cleaning sector, prompting brands to rethink their ingredient lists. Additionally, partnerships are being formed between key players in the detergent industry and research institutions to drive product innovation. These developments reflect an industry increasingly responsive to the call for sustainability and consumer safety.
United States (US) Sodium Percarbonate Market - Key Attractiveness of the Report
- 10 Years of Market Numbers
- Historical Data Starting from 2022 to 2025
- Base Year: 2025
- Forecast Data until 2032
- Key Performance Indicators Impacting the Market
- Major Upcoming Developments and Projects
Key Highlights of the Report:
- United States (US) Sodium Percarbonate Market Outlook
- Market Size of United States (US) Sodium Percarbonate Market, 2025
- Forecast of United States (US) Sodium Percarbonate Market, 2032
- Historical Data and Forecast of United States (US) Sodium Percarbonate Revenues & Volume for the Period 2022-2032F
- United States (US) Sodium Percarbonate Market Trend Evolution
- United States (US) Sodium Percarbonate Market Drivers and Challenges
- United States (US) Sodium Percarbonate Price Trends
- United States (US) Sodium Percarbonate Porter's Five Forces
- United States (US) Sodium Percarbonate Industry Life Cycle
- Historical Data and Forecast of United States (US) Sodium Percarbonate Market Revenues & Volume By Type for the Period 2022-2032F
- Historical Data and Forecast of United States (US) Sodium Percarbonate Market Revenues & Volume By Coated for the Period 2022-2032F
- Historical Data and Forecast of United States (US) Sodium Percarbonate Market Revenues & Volume By Uncoated for the Period 2022-2032F
- Historical Data and Forecast of United States (US) Sodium Percarbonate Market Revenues & Volume By Tablet for the Period 2022-2032F
- Historical Data and Forecast of United States (US) Sodium Percarbonate Market Revenues & Volume By Application for the Period 2022-2032F
- Historical Data and Forecast of United States (US) Sodium Percarbonate Market Revenues & Volume By Detergent Agent for the Period 2022-2032F
- Historical Data and Forecast of United States (US) Sodium Percarbonate Market Revenues & Volume By Cleaning Agent for the Period 2022-2032F
- Historical Data and Forecast of United States (US) Sodium Percarbonate Market Revenues & Volume By Bleaching Agent for the Period 2022-2032F
- Historical Data and Forecast of United States (US) Sodium Percarbonate Market Revenues & Volume By Water Treatment for the Period 2022-2032F
- Historical Data and Forecast of United States (US) Sodium Percarbonate Market Revenues & Volume By Others for the Period 2022-2032F
- Historical Data and Forecast of United States (US) Sodium Percarbonate Market Revenues & Volume By End-users for the Period 2022-2032F
- Historical Data and Forecast of United States (US) Sodium Percarbonate Market Revenues & Volume By Household Cleaning for the Period 2022-2032F
- Historical Data and Forecast of United States (US) Sodium Percarbonate Market Revenues & Volume By Laundry for the Period 2022-2032F
- Historical Data and Forecast of United States (US) Sodium Percarbonate Market Revenues & Volume By Industrial Cleaning for the Period 2022-2032F
- Historical Data and Forecast of United States (US) Sodium Percarbonate Market Revenues & Volume By Textile Industry for the Period 2022-2032F
- Historical Data and Forecast of United States (US) Sodium Percarbonate Market Revenues & Volume By Chemical Industry for the Period 2022-2032F
- Historical Data and Forecast of United States (US) Sodium Percarbonate Market Revenues & Volume By Papermaking Industry for the Period 2022-2032F
- Historical Data and Forecast of United States (US) Sodium Percarbonate Market Revenues & Volume By Food Industry for the Period 2022-2032F
- Historical Data and Forecast of United States (US) Sodium Percarbonate Market Revenues & Volume By Others for the Period 2022-2032F
- United States (US) Sodium Percarbonate Import Export Trade Statistics
- Market Opportunity Assessment By Type
- Market Opportunity Assessment By Application
- Market Opportunity Assessment By End-users
- United States (US) Sodium Percarbonate Top Companies Market Share
- United States (US) Sodium Percarbonate Competitive Benchmarking By Technical and Operational Parameters
- United States (US) Sodium Percarbonate Company Profiles
- United States (US) Sodium Percarbonate Key Strategic Recommendations
United States (US) Sodium Percarbonate Market - Frequently Asked Questions
The Sodium Percarbonate Market in the United States was valued at USD 228 Million in 2025 and is projected to reach USD 268 Million by 2032, growing at a CAGR of 2.3% from 2026 to 2032.
The rising consumer consciousness about the environmental impacts of traditional cleaning chemicals is driving the demand for sodium percarbonate. Its eco-friendly, oxygen-based bleaching properties make it a preferred choice for sustainable cleaning applications.
Government regulations, particularly from the EPA and OSHA, play a crucial role in shaping the sodium percarbonate market. Strict guidelines ensure manufacturers prioritize environmental safety and worker health, influencing product formulations and market operations.
Sodium percarbonate is primarily used in household cleaning products, laundry detergents, and increasingly in industrial applications such as wastewater treatment and pulp bleaching due to its strong oxidizing properties.
Yes, there is a notable trend towards DIY cleaning solutions as consumers seek to create their own eco-friendly products. Additionally, a shift towards online retail has broadened access to sodium percarbonate products for consumers.
6Wresearch actively monitors the United States (US) Sodium Percarbonate Market and publishes its comprehensive annual report, highlighting emerging trends, growth drivers, revenue analysis, and forecast outlook. Our insights help businesses to make data-backed strategic decisions with ongoing market dynamics. Our analysts track relevent industries related to the United States (US) Sodium Percarbonate Market, allowing our clients with actionable intelligence and reliable forecasts tailored to emerging regional needs.
Yes, we provide customisation as per your requirements. To learn more, feel free to contact us on sales@6wresearch.com
1 Executive Summary |
2 Introduction |
2.1 Key Highlights of the Report |
2.2 Report Description |
2.3 Market Scope & Segmentation |
2.4 Research Methodology |
2.5 Assumptions |
3 United States (US) Sodium Percarbonate Market Overview |
3.1 United States (US) Country Macro Economic Indicators |
3.2 United States (US) Sodium Percarbonate Market Revenues & Volume, 2022 & 2032F |
3.3 United States (US) Sodium Percarbonate Market - Industry Life Cycle |
3.4 United States (US) Sodium Percarbonate Market - Porter's Five Forces |
3.5 United States (US) Sodium Percarbonate Market Revenues & Volume Share, By Type, 2022 & 2032F |
3.6 United States (US) Sodium Percarbonate Market Revenues & Volume Share, By Form, 2022 & 2032F |
3.7 United States (US) Sodium Percarbonate Market Revenues & Volume Share, By End-users, 2022 & 2032F |
4 United States (US) Sodium Percarbonate Market Dynamics |
4.1 Impact Analysis |
4.2 Market Drivers |
4.2.1 Increasing demand for eco-friendly cleaning products |
4.2.2 Growth in the laundry and detergent industry |
4.2.3 Rising awareness about the benefits of sodium percarbonate as a bleaching agent |
4.3 Market Restraints |
4.3.1 Fluctuations in raw material prices |
4.3.2 Environmental concerns related to the manufacturing process of sodium percarbonate |
4.3.3 Competition from alternative bleaching agents |
5 United States (US) Sodium Percarbonate Market Trends |
6 United States (US) Sodium Percarbonate Market, By Types |
6.1 United States (US) Sodium Percarbonate Market, By Type |
6.1.1 Overview and Analysis |
6.1.2 United States (US) Sodium Percarbonate Market Revenues & Volume, By Type, 2022-2032F |
6.1.3 United States (US) Sodium Percarbonate Market Revenues & Volume, By Coated, 2022-2032F |
6.1.4 United States (US) Sodium Percarbonate Market Revenues & Volume, By Uncoated, 2022-2032F |
6.1.5 United States (US) Sodium Percarbonate Market Revenues & Volume, By Tablet, 2022-2032F |
6.2 United States (US) Sodium Percarbonate Market, By Application |
6.2.1 Overview and Analysis |
6.2.2 United States (US) Sodium Percarbonate Market Revenues & Volume, By Detergent Agent, 2022-2032F |
6.2.3 United States (US) Sodium Percarbonate Market Revenues & Volume, By Cleaning Agent, 2022-2032F |
6.2.4 United States (US) Sodium Percarbonate Market Revenues & Volume, By Bleaching Agent, 2022-2032F |
6.2.5 United States (US) Sodium Percarbonate Market Revenues & Volume, By Water Treatment, 2022-2032F |
6.2.6 United States (US) Sodium Percarbonate Market Revenues & Volume, By Others, 2022-2032F |
6.3 United States (US) Sodium Percarbonate Market, By End-users |
6.3.1 Overview and Analysis |
6.3.2 United States (US) Sodium Percarbonate Market Revenues & Volume, By Household Cleaning, 2022-2032F |
6.3.3 United States (US) Sodium Percarbonate Market Revenues & Volume, By Laundry, 2022-2032F |
6.3.4 United States (US) Sodium Percarbonate Market Revenues & Volume, By Industrial Cleaning, 2022-2032F |
6.3.5 United States (US) Sodium Percarbonate Market Revenues & Volume, By Textile Industry, 2022-2032F |
6.3.6 United States (US) Sodium Percarbonate Market Revenues & Volume, By Chemical Industry, 2022-2032F |
6.3.7 United States (US) Sodium Percarbonate Market Revenues & Volume, By Papermaking Industry, 2022-2032F |
6.3.8 United States (US) Sodium Percarbonate Market Revenues & Volume, By Others, 2022-2032F |
6.3.9 United States (US) Sodium Percarbonate Market Revenues & Volume, By Others, 2022-2032F |
7 United States (US) Sodium Percarbonate Market Import-Export Trade Statistics |
7.1 United States (US) Sodium Percarbonate Market Export to Major Countries |
7.2 United States (US) Sodium Percarbonate Market Imports from Major Countries |
8 United States (US) Sodium Percarbonate Market Key Performance Indicators |
8.1 Adoption rate of eco-friendly cleaning products in the US market |
8.2 Market penetration of sodium percarbonate in the laundry and detergent industry |
8.3 Consumer awareness levels regarding the advantages of using sodium percarbonate |
9 United States (US) Sodium Percarbonate Market - Opportunity Assessment |
9.1 United States (US) Sodium Percarbonate Market Opportunity Assessment, By Type, 2022 & 2032F |
9.2 United States (US) Sodium Percarbonate Market Opportunity Assessment, By Application, 2022 & 2032F |
9.3 United States (US) Sodium Percarbonate Market Opportunity Assessment, By End-users, 2022 & 2032F |
10 United States (US) Sodium Percarbonate Market - Competitive Landscape |
10.1 United States (US) Sodium Percarbonate Market Revenue Share, By Companies, 2025 |
10.2 United States (US) Sodium Percarbonate Market Competitive Benchmarking, By Operating and Technical Parameters |
11 Company Profiles |
12 Recommendations |
13 Disclaimer |
Global Go To Market Strategy - 2030
Export potential enables firms to identify high-growth global markets with greater confidence by combining advanced trade intelligence with a structured quantitative methodology. The framework analyzes emerging demand trends and country-level import patterns while integrating macroeconomic and trade datasets such as GDP and population forecasts, bilateral import–export flows, tariff structures, elasticity differentials between developed and developing economies, geographic distance, and import demand projections. Using weighted trade values from 2020–2024 as the base period to project country-to-country export potential for 2030, these inputs are operationalized through calculated drivers such as gravity model parameters, tariff impact factors, and projected GDP per-capita growth. Through an analysis of hidden potentials, demand hotspots, and market conditions that are most favorable to success, this method enables firms to focus on target countries, maximize returns, and global expansion with data, backed by accuracy.
By factoring in the projected importer demand gap that is currently unmet and could be potential opportunity, it identifies the potential for the Exporter (Country) among 190 countries, against the general trade analysis, which identifies the biggest importer or exporter.
To discover high-growth global markets and optimize your business strategy:
Click Here
Pricing
- Single User License$ 1,995
- Department License$ 2,400
- Site License$ 3,120
- Global License$ 3,795

Leadership Perspectives from Industry Events
Search
Thought Leadership and Analyst Meet


Our Clients
6WResearch In News
- India Air Conditioner Market Set for Strong Rebound in 2026 After Weather-Led Correction and GST-Driven Recovery: 6Wresearch
- ADAS in India: How Automatic Emergency Braking, Blind Spot Detection & Driver Monitoring are Transforming Road Safety
- Doha a strategic location for EV manufacturing hub: IPA Qatar
- Demand for luxury TVs surging in the GCC, says Samsung
- Empowering Growth: The Thriving Journey of Bangladesh’s Cable Industry
- Demand for luxury TVs surging in the GCC, says Samsung
Latest Reports
- Nicaragua RPG Gaming Market (2026-2032)
- New Zealand RPG Gaming Market (2026-2032)
- Netherlands RPG Gaming Market (2026-2032)
- Nauru RPG Gaming Market (2026-2032)
- Namibia RPG Gaming Market (2026-2032)
- Mozambique RPG Gaming Market (2026-2032)
- Montenegro RPG Gaming Market (2026-2032)
- Mongolia RPG Gaming Market (2026-2032)
- Monaco RPG Gaming Market (2026-2032)
- Micronesia RPG Gaming Market (2026-2032)
Industry Events and Analyst Meet

EV India Expo 2026

HIMTEX 2026

India Refining Summit 2026

India EV Show 2026

EV tech India Expo 2026
Whitepaper
- Middle East & Africa Commercial Security Market Click here to view more.
- Middle East & Africa Fire Safety Systems & Equipment Market Click here to view more.
- GCC Drone Market Click here to view more.
- Middle East Lighting Fixture Market Click here to view more.
- GCC Physical & Perimeter Security Market Click here to view more.