United States (US) Solenoid Valve Market (2026-2032) Outlook | Trends, Revenue, Companies, Value, Share, Growth, Industry, Forecast, Size & Analysis
Market Forecast By Body Material (Stainless Steel, Brass, Aluminium, Plastic), By Valve Design Type (2-way, 3-way, 4-way, 5-way), By Industry (Oil & Gas, Chemical & Petrochemical, Water & Wastewater, Food & Beverages, Power Generation, Pharmaceuticals, Automotive, Others) And Competitive Landscape
| Product Code: ETC129279 | Publication Date: Jun 2021 | Updated Date: Jun 2026 | Product Type: Report | |
| Publisher: 6Wresearch | Author: Shubham Padhi | No. of Pages: 70 | No. of Figures: 35 | No. of Tables: 5 |
United States (US) Solenoid Valve Market Size, Share & Growth Rate
The United States (US) Solenoid Valve Market was estimated at USD 108 Million in 2025 and is projected to reach USD 127 Million by 2032, growing at a CAGR of 2.3% from 2026 to 2032. This growth trajectory is primarily driven by the accelerating demand for automation and efficient control systems across various sectors, including automotive, oil and gas, and healthcare. As industries increasingly seek to enhance their operational efficiency and reduce costs, solenoid valves have become integral components in fluid control systems.
United States (US) Solenoid Valve Market Year-wise Growth Rate and Key Drivers
This graph highlights how the United States (US) Solenoid Valve Market has steadily grown over the years, supported by major growth factors.
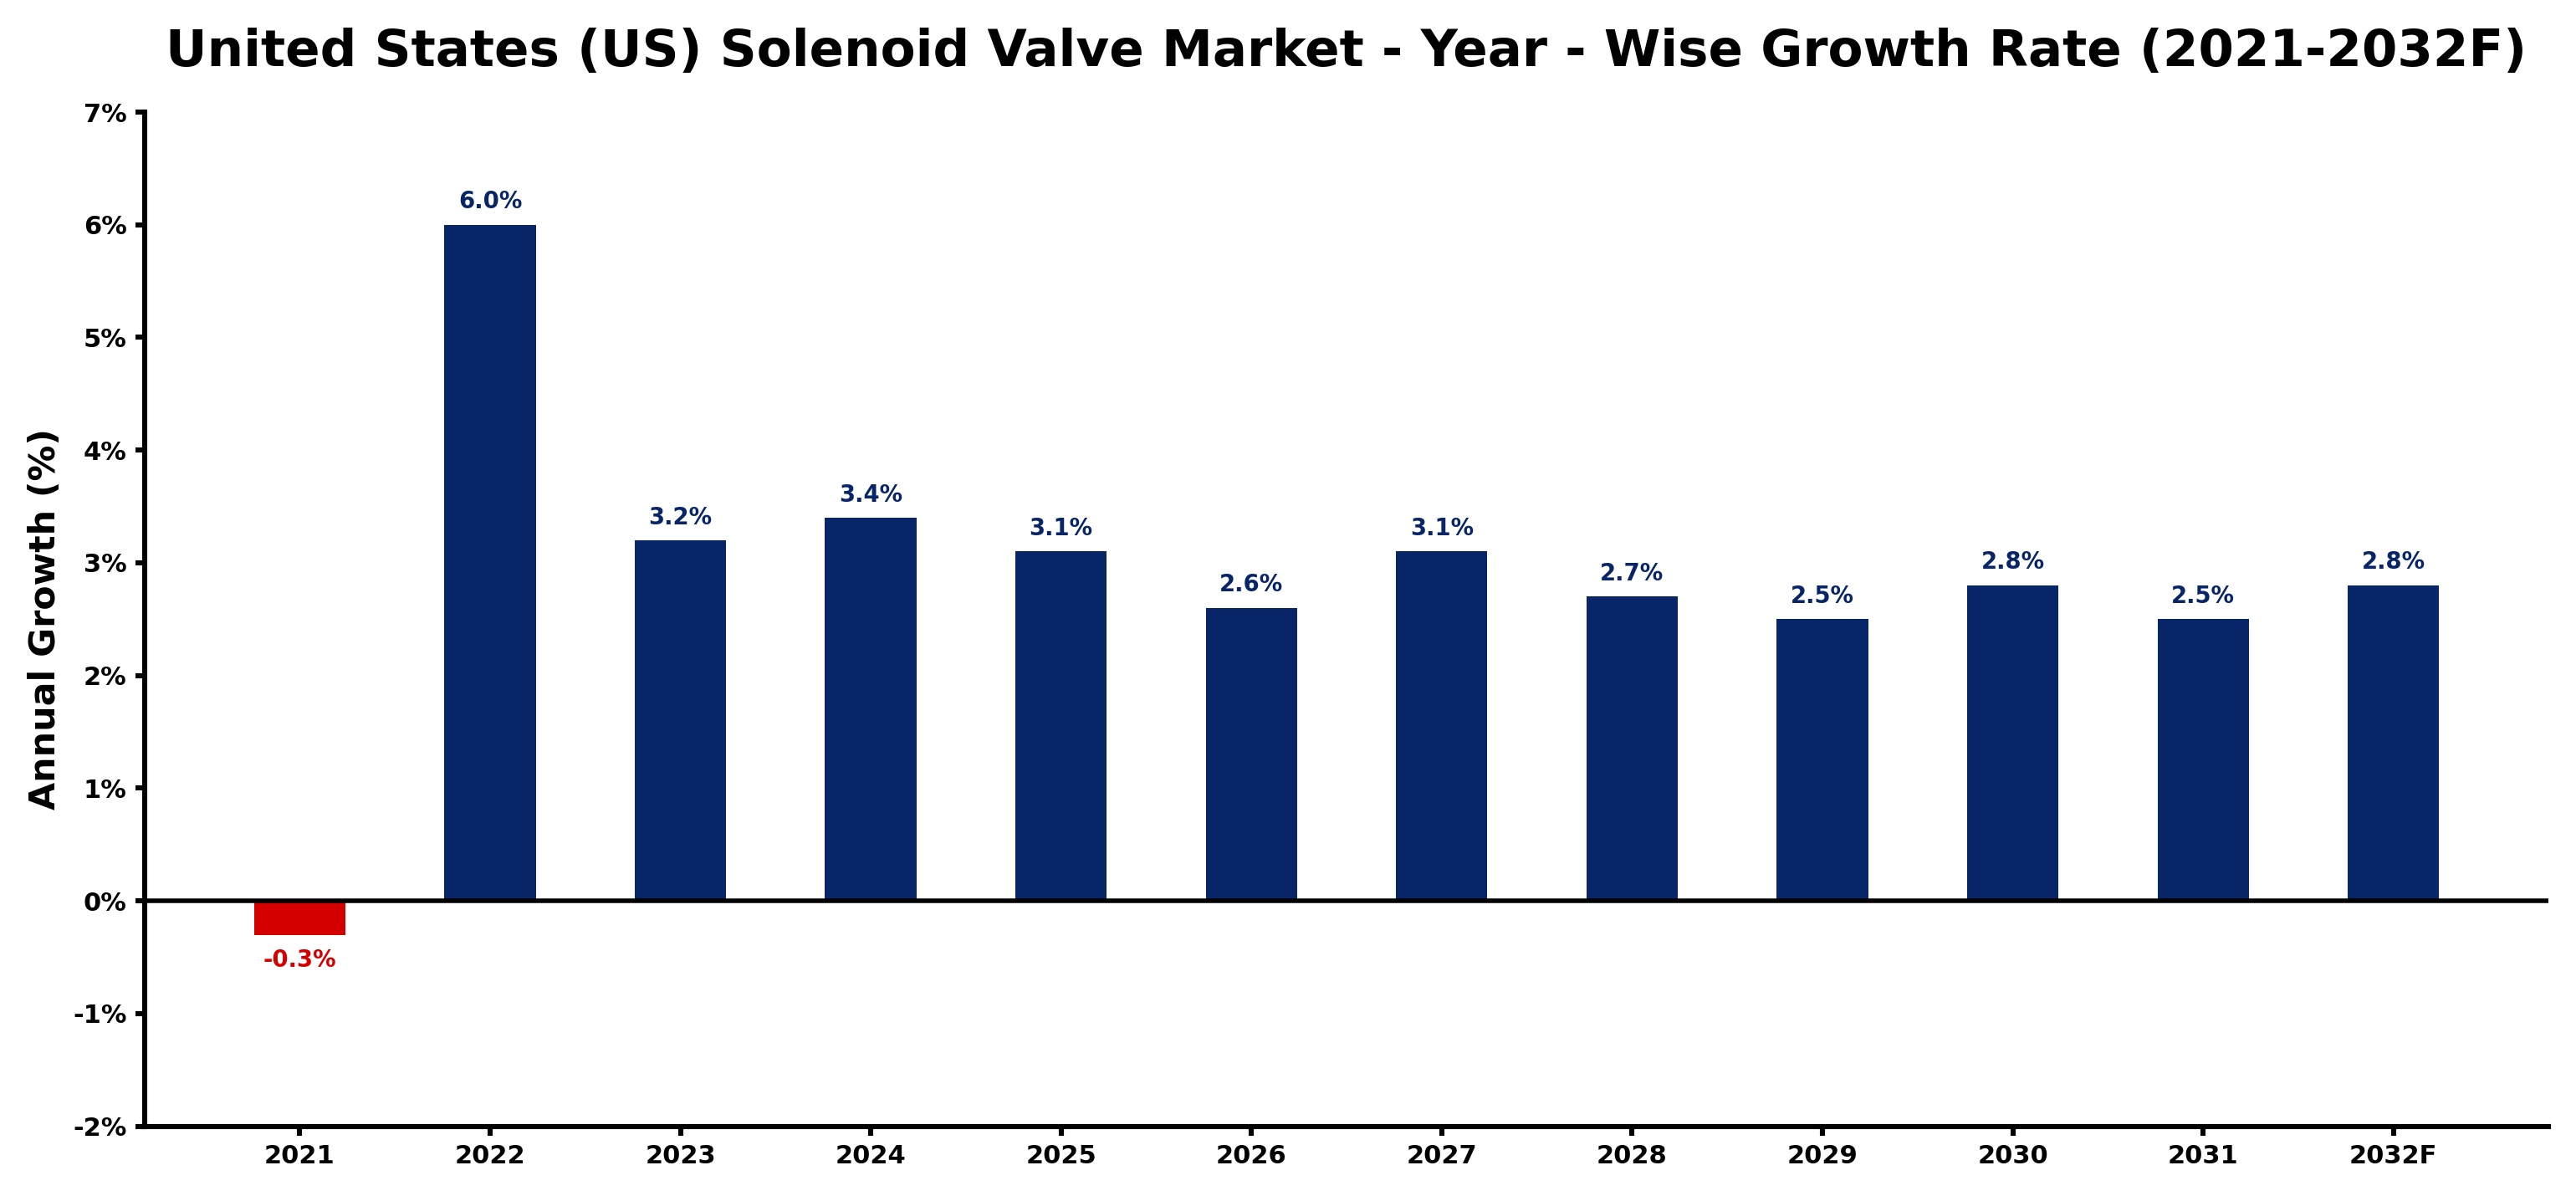
The table below presents the year‑wise growth rates along with the key drivers influencing the market
| Year | Growth Rate | Major Drivers |
| 2021 | -0.3% | Rising electricity demand across industries |
| 2022 | 6.0% | Increasing smart city development projects |
| 2023 | 3.2% | Increasing smart city development projects |
| 2024 | 3.4% | Expansion of transportation and logistics networks |
| 2025 | 3.1% | Rapid growth in telecom and data center sectors |
| 2026 | 2.6% | Expansion of commercial construction activities |
| 2027 | 3.1% | Expansion of transportation and logistics networks |
| 2028 | 2.7% | Increasing adoption of advanced technologies |
| 2029 | 2.5% | Increasing smart city development projects |
| 2030 | 2.8% | Rising electricity demand across industries |
| 2031 | 2.5% | Rising electricity demand across industries |
| 2032 | 2.8% | Government infrastructure modernization initiatives |
Note - Market size estimations and growth projections presented in this report are based on 6Wresearch’s advanced forecasting approach, validated with industry datasets as of June 2026.
United States (US) Solenoid Valve Market Synopsis
While the US solenoid valve market has experienced consistent growth in recent years, future prospects suggest an even more dynamic landscape. The ongoing integration of smart technologies and IoT in solenoid valve designs positions the market for substantial advancements, responding to a growing preference for intelligent automation.
Moreover, the emphasis on sustainability and energy efficiency is reshaping product development, compelling manufacturers to innovate and offer solutions that align with environmental goals. As these trends gain momentum, the market is set to evolve rapidly, presenting a range of opportunities for stakeholders.
United States (US) Solenoid Valve Market Key Takeaways
- Smart solenoid valves with remote monitoring and automation capabilities are gaining traction.
- Energy efficiency and sustainability drive product innovation in the market.
- Technological advancements, including IoT integration, enhance operational performance.
- Investment opportunities are expanding within industries adopting automation solutions.
- Competition and regulatory compliance necessitate agility among manufacturers.
Evaluation of Restraints in United States (US) Solenoid Valve Market
The United States solenoid valve market faces several notable constraints that can impede growth. Intense competition from both domestic and international manufacturers creates pricing pressures, potentially leading to margin erosion for established players. Moreover, the continuous need for innovation to address the evolving demands of various sectors adds another layer of complexity. Manufacturers must remain vigilant and adapt to stringent regulatory requirements and environmental standards, which can further complicate market dynamics. Additionally, fluctuations in raw material prices and supply chain disruptions pose risks to market stability, challenging companies to maintain their operational efficiency while managing costs effectively.
United States (US) Solenoid Valve Market Trends
The US solenoid valve market is shaped by several significant trends, most notably the increasing adoption of smart solenoid valves. These advanced devices are equipped with features such as real-time diagnostics, remote monitoring, and automation capabilities. This trend aligns with the broader industry shift towards more efficient, connected systems that leverage IoT technology. Furthermore, manufacturers are focusing on developing energy-efficient solutions to meet sustainability targets, especially in sectors like water treatment and HVAC. The integration of IoT in solenoid valves enables real-time data collection, allowing for predictive maintenance and optimized operational processes, marking a transformative phase in the market.
United States (US) Solenoid Valve Market Opportunities
The United States solenoid valve market presents a wealth of investment opportunities, particularly driven by the ongoing automation trends across key industries. The demand for efficient fluid control systems is set to rise, underpinned by technological advancements in valve design and materials. Furthermore, as companies prioritize energy efficiency and sustainability, sectors such as HVAC and water treatment are likely to see increased adoption of innovative solenoid valve solutions. Investors may find significant potential in companies committed to enhancing operational efficiency and developing cutting-edge products tailored to meet evolving customer needs.
Government Initiatives in the United States (US) Solenoid Valve Market
Government policies significantly influence the solenoid valve market in the US, particularly through regulations set by agencies like the Environmental Protection Agency (EPA). These regulations are designed to ensure compliance with environmental standards, contributing to the reduction of emissions and promoting sustainable practices. Trade policies and tariffs also play a crucial role in shaping the market dynamics, impacting the import and export landscape for solenoid valves. Additionally, government initiatives that encourage research and innovation in energy-efficient technologies support the advancement of the industry, fostering an environment conducive to growth and technological development.
Future Insights of the United States (US) Solenoid Valve Market
Looking ahead to 2026-2032, the United States solenoid valve market is expected to continue its upward trajectory. The demand for automation is anticipated to intensify, particularly in industries such as manufacturing, oil and gas, and healthcare, driving the need for reliable solenoid valves. Moreover, technological innovations such as smart valves with IoT capabilities will play a pivotal role in enhancing operational efficiency. However, stakeholders must navigate the challenges posed by competition from alternative technologies and fluctuations in raw material prices. Overall, the market is poised for growth, fueled by advancements in technology and an increasing push towards industrial automation.
United States (US) Solenoid Valve Market Latest Developments (May 2025 - June 2026)
In recent months, the US solenoid valve market has witnessed a significant shift towards digital transformation, with many manufacturers investing heavily in smart technologies. This trend reflects the broader demand for improved efficiency and connectivity in industrial processes. Additionally, there has been a marked increase in collaborative efforts between companies to develop innovative solutions that prioritize sustainability and energy efficiency. Such initiatives highlight the industry's commitment to adapting to market demands while ensuring compliance with evolving regulatory standards.
United States (US) Solenoid Valve Market - Key Attractiveness of the Report
- 10 Years of Market Numbers
- Historical Data Starting from 2022 to 2025
- Base Year: 2025
- Forecast Data until 2032
- Key Performance Indicators Impacting the Market
- Major Upcoming Developments and Projects
Key Highlights of the Report:
- United States (US) Solenoid Valve Market Outlook
- Market Size of United States (US) Solenoid Valve Market, 2025
- Forecast of United States (US) Solenoid Valve Market, 2032
- Historical Data and Forecast of United States (US) Solenoid Valve Revenues & Volume for the Period 2022-2032F
- United States (US) Solenoid Valve Market Trend Evolution
- United States (US) Solenoid Valve Market Drivers and Challenges
- United States (US) Solenoid Valve Price Trends
- United States (US) Solenoid Valve Porter's Five Forces
- United States (US) Solenoid Valve Industry Life Cycle
- Historical Data and Forecast of United States (US) Solenoid Valve Market Revenues & Volume By Body Material for the Period 2022-2032F
- Historical Data and Forecast of United States (US) Solenoid Valve Market Revenues & Volume By Stainless Steel for the Period 2022-2032F
- Historical Data and Forecast of United States (US) Solenoid Valve Market Revenues & Volume By Brass for the Period 2022-2032F
- Historical Data and Forecast of United States (US) Solenoid Valve Market Revenues & Volume By Aluminium for the Period 2022-2032F
- Historical Data and Forecast of United States (US) Solenoid Valve Market Revenues & Volume By Plastic for the Period 2022-2032F
- Historical Data and Forecast of United States (US) Solenoid Valve Market Revenues & Volume By Valve Design Type for the Period 2022-2032F
- Historical Data and Forecast of United States (US) Solenoid Valve Market Revenues & Volume By 2-way for the Period 2022-2032F
- Historical Data and Forecast of United States (US) Solenoid Valve Market Revenues & Volume By 3-way for the Period 2022-2032F
- Historical Data and Forecast of United States (US) Solenoid Valve Market Revenues & Volume By 4-way for the Period 2022-2032F
- Historical Data and Forecast of United States (US) Solenoid Valve Market Revenues & Volume By 5-way for the Period 2022-2032F
- Historical Data and Forecast of United States (US) Solenoid Valve Market Revenues & Volume By Industry for the Period 2022-2032F
- Historical Data and Forecast of United States (US) Solenoid Valve Market Revenues & Volume By Oil & Gas for the Period 2022-2032F
- Historical Data and Forecast of United States (US) Solenoid Valve Market Revenues & Volume By Chemical & Petrochemical for the Period 2022-2032F
- Historical Data and Forecast of United States (US) Solenoid Valve Market Revenues & Volume By Water & Wastewater for the Period 2022-2032F
- Historical Data and Forecast of United States (US) Solenoid Valve Market Revenues & Volume By Food & Beverages for the Period 2022-2032F
- Historical Data and Forecast of United States (US) Solenoid Valve Market Revenues & Volume By Power Generation for the Period 2022-2032F
- Historical Data and Forecast of United States (US) Solenoid Valve Market Revenues & Volume By Pharmaceuticals for the Period 2022-2032F
- Historical Data and Forecast of United States (US) Solenoid Valve Market Revenues & Volume By Automotive for the Period 2022-2032F
- Historical Data and Forecast of United States (US) Solenoid Valve Market Revenues & Volume By Others for the Period 2022-2032F
- United States (US) Solenoid Valve Import Export Trade Statistics
- Market Opportunity Assessment By Body Material
- Market Opportunity Assessment By Valve Design Type
- Market Opportunity Assessment By Industry
- United States (US) Solenoid Valve Top Companies Market Share
- United States (US) Solenoid Valve Competitive Benchmarking By Technical and Operational Parameters
- United States (US) Solenoid Valve Company Profiles
- United States (US) Solenoid Valve Key Strategic Recommendations
United States (US) Solenoid Valve Market - Frequently Asked Questions
The growth in the US solenoid valve market is being driven by the increasing automation across various industries, a growing emphasis on energy efficiency, and technological advancements such as IoT integration.
The market was estimated at USD 108 Million in 2025 and is projected to reach USD 127 Million by 2032, growing at a CAGR of 2.3% from 2026 to 2032.
Sustainability is increasingly influencing product design and development within the market, as companies focus on creating energy-efficient solutions to meet regulatory standards and customer expectations.
Key sectors driving demand include automotive, oil and gas, healthcare, and water treatment, where automation and efficient fluid control systems are paramount.
Government regulations, particularly environmental standards set by the EPA, are crucial in shaping market dynamics by driving companies to innovate and comply with sustainability requirements.
6Wresearch actively monitors the United States (US) Solenoid Valve Market and publishes its comprehensive annual report, highlighting emerging trends, growth drivers, revenue analysis, and forecast outlook. Our insights help businesses to make data-backed strategic decisions with ongoing market dynamics. Our analysts track relevent industries related to the United States (US) Solenoid Valve Market, allowing our clients with actionable intelligence and reliable forecasts tailored to emerging regional needs.
Yes, we provide customisation as per your requirements. To learn more, feel free to contact us on sales@6wresearch.com
United States (US) Solenoid Valve |
1 Executive Summary |
2 Introduction |
2.1 Key Highlights of the Report |
2.2 Report Description |
2.3 Market Scope & Segmentation |
2.4 Research Methodology |
2.5 Assumptions |
3 United States (US) Solenoid Valve Market Overview |
3.1 United States (US) Country Macro Economic Indicators |
3.2 United States (US) Solenoid Valve Market Revenues & Volume, 2022 & 2032F |
3.3 United States (US) Solenoid Valve Market - Industry Life Cycle |
3.4 United States (US) Solenoid Valve Market - Porter's Five Forces |
3.5 United States (US) Solenoid Valve Market Revenues & Volume Share, By Body Material, 2022 & 2032F |
3.6 United States (US) Solenoid Valve Market Revenues & Volume Share, By Valve Design Type, 2022 & 2032F |
3.7 United States (US) Solenoid Valve Market Revenues & Volume Share, By Industry, 2022 & 2032F |
4 United States (US) Solenoid Valve Market Dynamics |
4.1 Impact Analysis |
4.2 Market Drivers |
4.2.1 Increasing automation across industries driving the demand for solenoid valves |
4.2.2 Growing adoption of IoT and smart technologies in manufacturing processes |
4.2.3 Stringent regulations promoting energy efficiency and sustainability in operations |
4.3 Market Restraints |
4.3.1 Volatility in raw material prices impacting manufacturing costs |
4.3.2 Intense competition leading to pricing pressures |
4.3.3 Disruptions in the supply chain affecting production and delivery timelines |
5 United States (US) Solenoid Valve Market Trends |
6 United States (US) Solenoid Valve Market, By Types |
6.1 United States (US) Solenoid Valve Market, By Body Material |
6.1.1 Overview and Analysis |
6.1.2 United States (US) Solenoid Valve Market Revenues & Volume, By Body Material, 2022-2032F |
6.1.3 United States (US) Solenoid Valve Market Revenues & Volume, By Stainless Steel, 2022-2032F |
6.1.4 United States (US) Solenoid Valve Market Revenues & Volume, By Brass, 2022-2032F |
6.1.5 United States (US) Solenoid Valve Market Revenues & Volume, By Aluminium, 2022-2032F |
6.1.6 United States (US) Solenoid Valve Market Revenues & Volume, By Plastic, 2022-2032F |
6.2 United States (US) Solenoid Valve Market, By Valve Design Type |
6.2.1 Overview and Analysis |
6.2.2 United States (US) Solenoid Valve Market Revenues & Volume, By 2-way, 2022-2032F |
6.2.3 United States (US) Solenoid Valve Market Revenues & Volume, By 3-way, 2022-2032F |
6.2.4 United States (US) Solenoid Valve Market Revenues & Volume, By 4-way, 2022-2032F |
6.2.5 United States (US) Solenoid Valve Market Revenues & Volume, By 5-way, 2022-2032F |
6.3 United States (US) Solenoid Valve Market, By Industry |
6.3.1 Overview and Analysis |
6.3.2 United States (US) Solenoid Valve Market Revenues & Volume, By Oil & Gas, 2022-2032F |
6.3.3 United States (US) Solenoid Valve Market Revenues & Volume, By Chemical & Petrochemical, 2022-2032F |
6.3.4 United States (US) Solenoid Valve Market Revenues & Volume, By Water & Wastewater, 2022-2032F |
6.3.5 United States (US) Solenoid Valve Market Revenues & Volume, By Food & Beverages, 2022-2032F |
6.3.6 United States (US) Solenoid Valve Market Revenues & Volume, By Power Generation, 2022-2032F |
6.3.7 United States (US) Solenoid Valve Market Revenues & Volume, By Pharmaceuticals, 2022-2032F |
6.3.8 United States (US) Solenoid Valve Market Revenues & Volume, By Others, 2022-2032F |
6.3.9 United States (US) Solenoid Valve Market Revenues & Volume, By Others, 2022-2032F |
7 United States (US) Solenoid Valve Market Import-Export Trade Statistics |
7.1 United States (US) Solenoid Valve Market Export to Major Countries |
7.2 United States (US) Solenoid Valve Market Imports from Major Countries |
8 United States (US) Solenoid Valve Market Key Performance Indicators |
8.1 Energy efficiency improvements in solenoid valve technology |
8.2 Adoption rate of IoT-enabled solenoid valves in industrial applications |
8.3 Percentage of solenoid valve manufacturers offering customization options |
8.4 Number of patents filed for innovative solenoid valve designs |
8.5 Rate of growth in aftermarket services and solutions for solenoid valves |
9 United States (US) Solenoid Valve Market - Opportunity Assessment |
9.1 United States (US) Solenoid Valve Market Opportunity Assessment, By Body Material, 2022 & 2032F |
9.2 United States (US) Solenoid Valve Market Opportunity Assessment, By Valve Design Type, 2022 & 2032F |
9.3 United States (US) Solenoid Valve Market Opportunity Assessment, By Industry, 2022 & 2032F |
10 United States (US) Solenoid Valve Market - Competitive Landscape |
10.1 United States (US) Solenoid Valve Market Revenue Share, By Companies, 2025 |
10.2 United States (US) Solenoid Valve Market Competitive Benchmarking, By Operating and Technical Parameters |
11 Company Profiles |
12 Recommendations |
13 Disclaimer |
Global Go To Market Strategy - 2030
Export potential enables firms to identify high-growth global markets with greater confidence by combining advanced trade intelligence with a structured quantitative methodology. The framework analyzes emerging demand trends and country-level import patterns while integrating macroeconomic and trade datasets such as GDP and population forecasts, bilateral import–export flows, tariff structures, elasticity differentials between developed and developing economies, geographic distance, and import demand projections. Using weighted trade values from 2020–2024 as the base period to project country-to-country export potential for 2030, these inputs are operationalized through calculated drivers such as gravity model parameters, tariff impact factors, and projected GDP per-capita growth. Through an analysis of hidden potentials, demand hotspots, and market conditions that are most favorable to success, this method enables firms to focus on target countries, maximize returns, and global expansion with data, backed by accuracy.
By factoring in the projected importer demand gap that is currently unmet and could be potential opportunity, it identifies the potential for the Exporter (Country) among 190 countries, against the general trade analysis, which identifies the biggest importer or exporter.
To discover high-growth global markets and optimize your business strategy:
Click Here
Pricing
- Single User License$ 1,995
- Department License$ 2,400
- Site License$ 3,120
- Global License$ 3,795

Leadership Perspectives from Industry Events
Search
Thought Leadership and Analyst Meet


Our Clients
6WResearch In News
- India Air Conditioner Market Set for Strong Rebound in 2026 After Weather-Led Correction and GST-Driven Recovery: 6Wresearch
- ADAS in India: How Automatic Emergency Braking, Blind Spot Detection & Driver Monitoring are Transforming Road Safety
- Doha a strategic location for EV manufacturing hub: IPA Qatar
- Demand for luxury TVs surging in the GCC, says Samsung
- Empowering Growth: The Thriving Journey of Bangladesh’s Cable Industry
- Demand for luxury TVs surging in the GCC, says Samsung
Latest Reports
- Nicaragua RPG Gaming Market (2026-2032)
- New Zealand RPG Gaming Market (2026-2032)
- Netherlands RPG Gaming Market (2026-2032)
- Nauru RPG Gaming Market (2026-2032)
- Namibia RPG Gaming Market (2026-2032)
- Mozambique RPG Gaming Market (2026-2032)
- Montenegro RPG Gaming Market (2026-2032)
- Mongolia RPG Gaming Market (2026-2032)
- Monaco RPG Gaming Market (2026-2032)
- Micronesia RPG Gaming Market (2026-2032)
Industry Events and Analyst Meet

EV India Expo 2026

HIMTEX 2026

India Refining Summit 2026

India EV Show 2026

EV tech India Expo 2026
Whitepaper
- Middle East & Africa Commercial Security Market Click here to view more.
- Middle East & Africa Fire Safety Systems & Equipment Market Click here to view more.
- GCC Drone Market Click here to view more.
- Middle East Lighting Fixture Market Click here to view more.
- GCC Physical & Perimeter Security Market Click here to view more.