Zambia Christmas Decorations Market (2026-2032) | Segments, Analysis, Revenue, Industry, Challenges, Outlook, Trends, Restraints, Opportunities, Competitive, Companies, Demand, Strategy, Supply, Consumer Insights, Share, Pricing Analysis, Forecast, Growth, Segmentation, Size, Investment Trends, Drivers, Value, Strategic Insights, Competition
Market Forecast By Product Type (Christmas Trees, Ornaments, Garlands, Wreaths, Nativity Scenes), By Material (Plastic, Glass, Metal, Paper, Fabric), By Distribution Channel (Online Retail, Supermarkets & Hypermarkets, Specialty Stores, Local Shops), By End User (Residential, Commercial (Hotels, Shopping Malls, Offices), Public Spaces) And Competitive Landscape
| Product Code: ETC11636986 | Publication Date: Apr 2025 | Updated Date: Apr 2026 | Product Type: Market Research Report | |
| Publisher: 6Wresearch | Author: Bhawna Singh | No. of Pages: 65 | No. of Figures: 34 | No. of Tables: 19 |
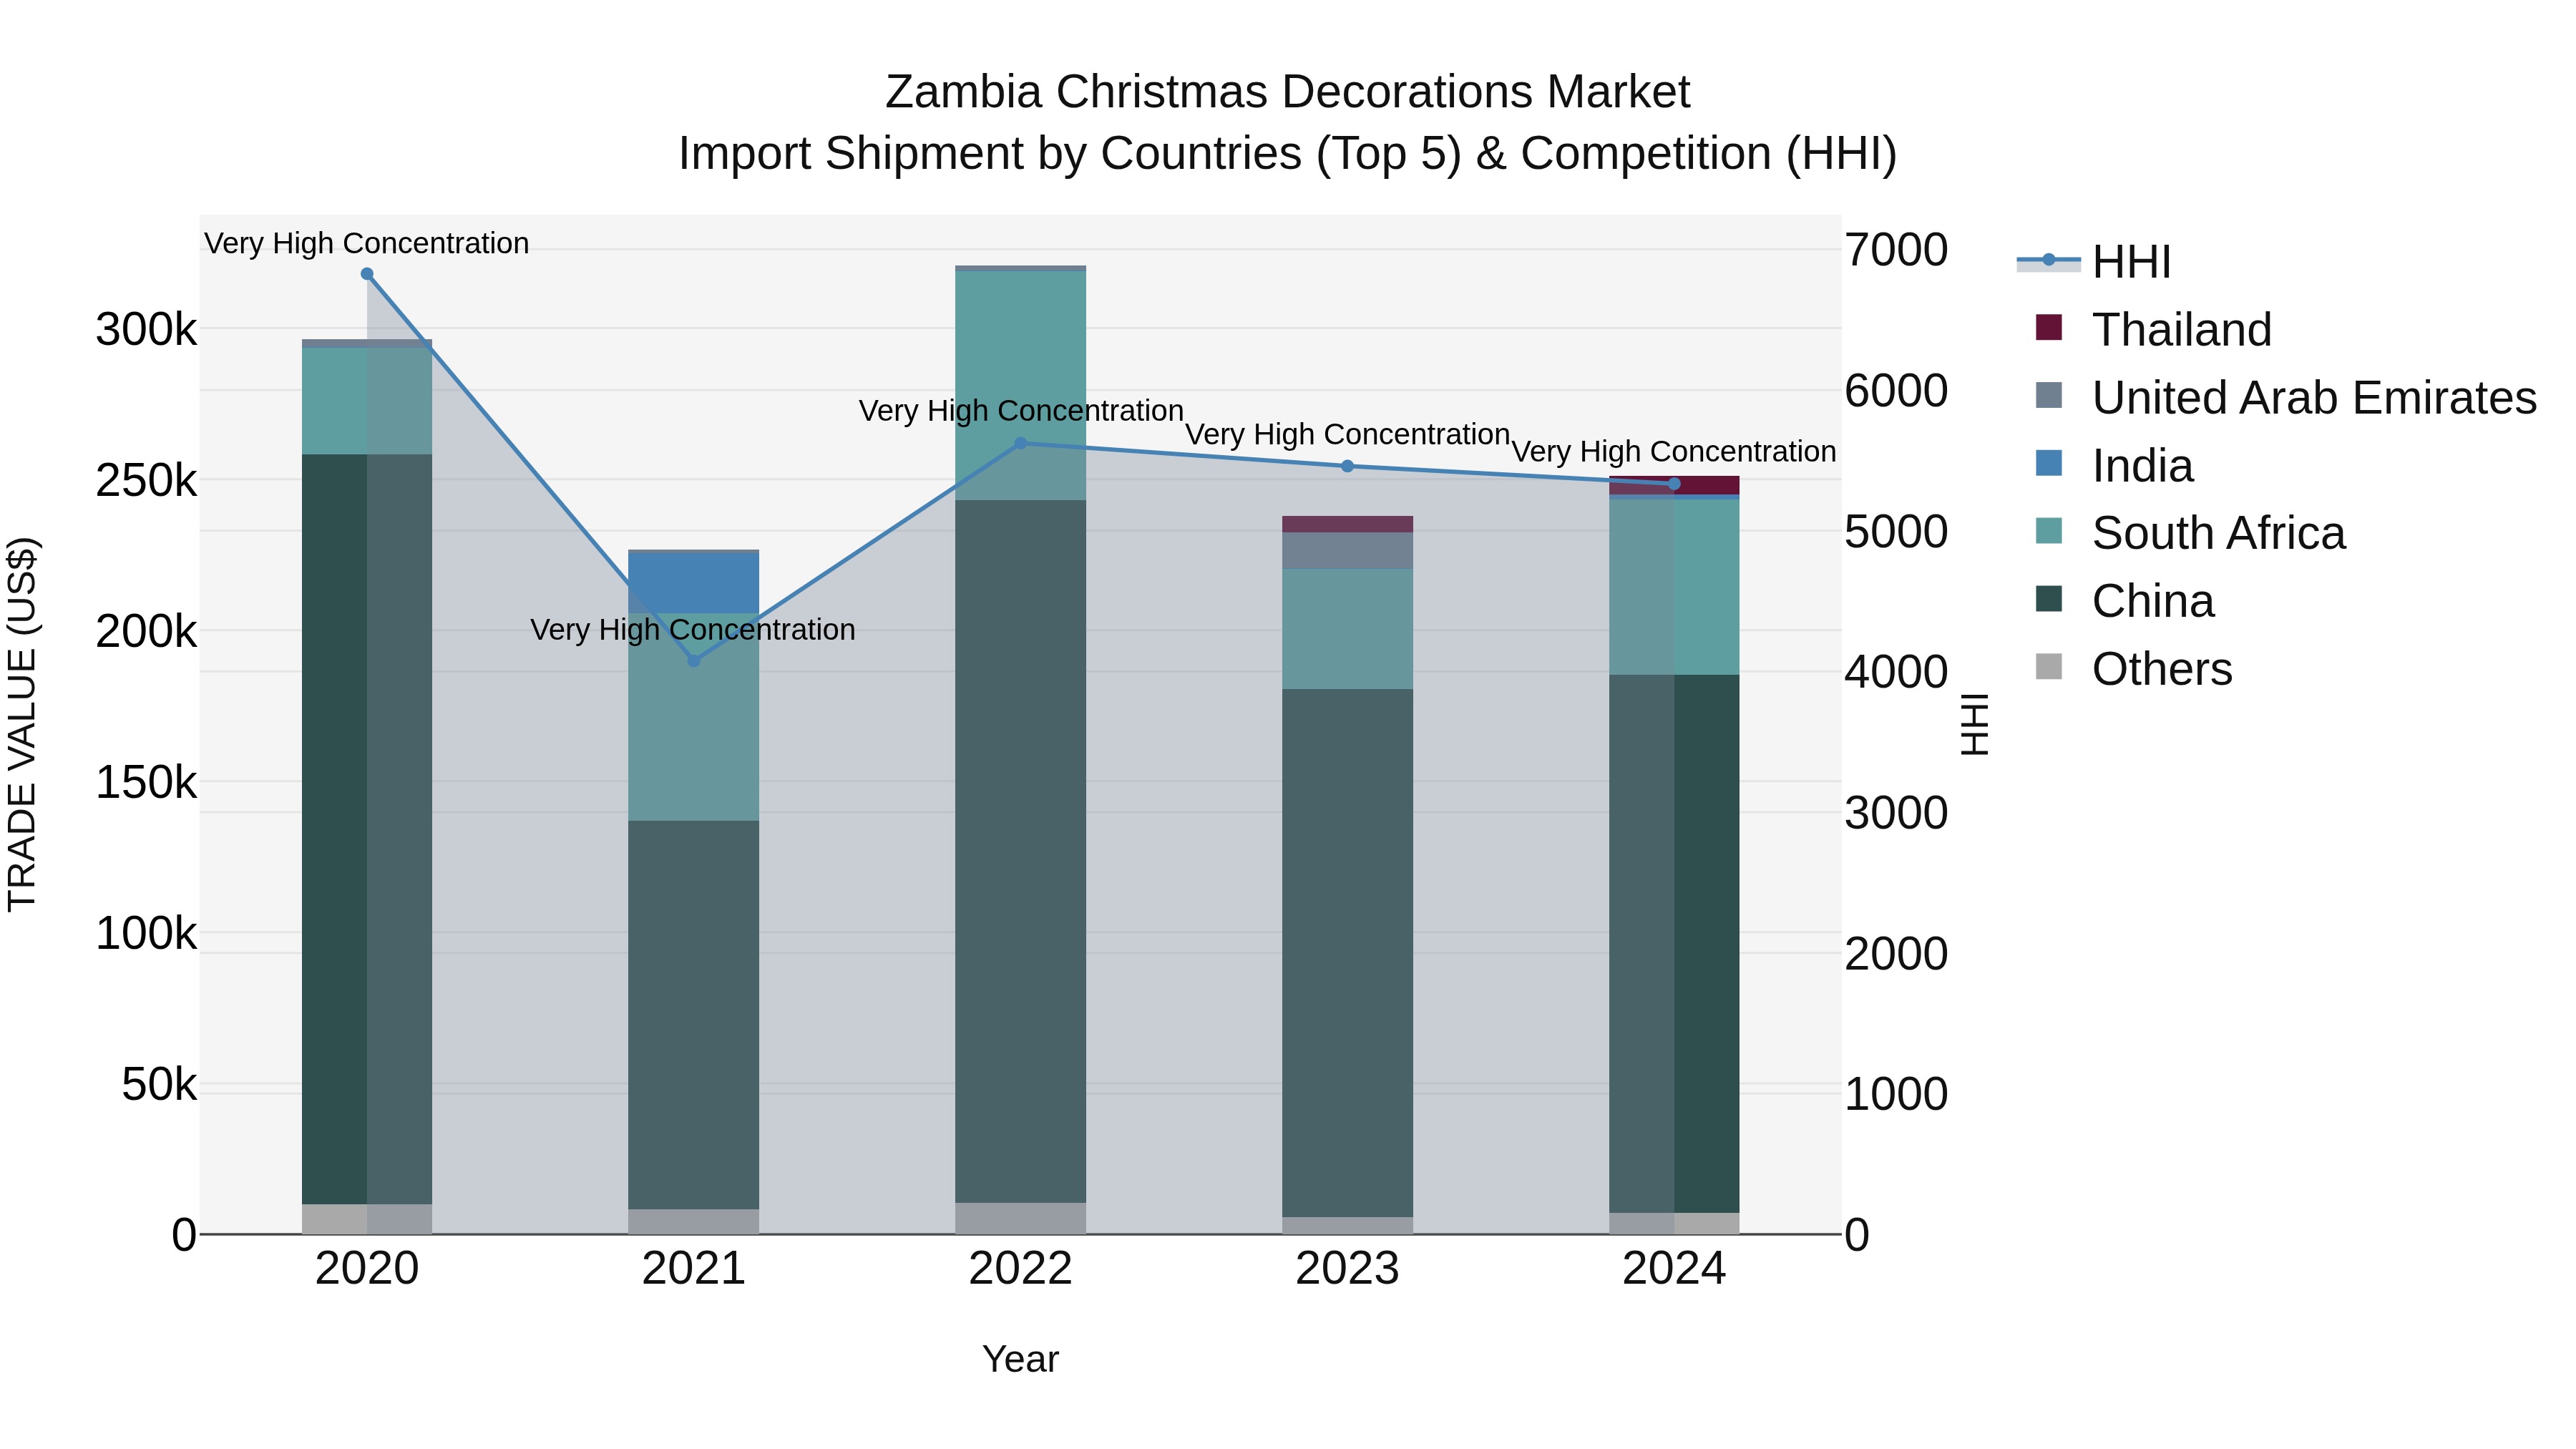
Zambia Christmas Decorations Market: Top 5 Importing Countries and Market Competition (HHI) Analysis
In 2024, Zambia continued to rely on key suppliers such as China, South Africa, Thailand, USA, and Hong Kong for Christmas decorations imports. Despite a declining CAGR of -4.05% from 2020-2024, there was a positive growth rate of 5.67% in 2023-24. The high concentration of the Herfindahl-Hirschman Index (HHI) indicates a dominant market presence of these top exporting countries. This data suggests that while the overall trend may have been negative in the past few years, there are signs of a potential turnaround in the near future for Zambia`s Christmas decorations import market.
Key Highlights of the Report:
- Zambia Christmas Decorations Market Outlook
- Market Size of Zambia Christmas Decorations Market, 2025
- Forecast of Zambia Christmas Decorations Market, 2032
- Historical Data and Forecast of Zambia Christmas Decorations Revenues & Volume for the Period 2022 - 2032F
- Zambia Christmas Decorations Market Trend Evolution
- Zambia Christmas Decorations Market Drivers and Challenges
- Zambia Christmas Decorations Price Trends
- Zambia Christmas Decorations Porter's Five Forces
- Zambia Christmas Decorations Industry Life Cycle
- Historical Data and Forecast of Zambia Christmas Decorations Market Revenues & Volume By Product Type for the Period 2022 - 2032F
- Historical Data and Forecast of Zambia Christmas Decorations Market Revenues & Volume By Christmas Trees for the Period 2022 - 2032F
- Historical Data and Forecast of Zambia Christmas Decorations Market Revenues & Volume By Ornaments for the Period 2022 - 2032F
- Historical Data and Forecast of Zambia Christmas Decorations Market Revenues & Volume By Garlands for the Period 2022 - 2032F
- Historical Data and Forecast of Zambia Christmas Decorations Market Revenues & Volume By Wreaths for the Period 2022 - 2032F
- Historical Data and Forecast of Zambia Christmas Decorations Market Revenues & Volume By Nativity Scenes for the Period 2022 - 2032F
- Historical Data and Forecast of Zambia Christmas Decorations Market Revenues & Volume By Material for the Period 2022 - 2032F
- Historical Data and Forecast of Zambia Christmas Decorations Market Revenues & Volume By Plastic for the Period 2022 - 2032F
- Historical Data and Forecast of Zambia Christmas Decorations Market Revenues & Volume By Glass for the Period 2022 - 2032F
- Historical Data and Forecast of Zambia Christmas Decorations Market Revenues & Volume By Metal for the Period 2022 - 2032F
- Historical Data and Forecast of Zambia Christmas Decorations Market Revenues & Volume By Paper for the Period 2022 - 2032F
- Historical Data and Forecast of Zambia Christmas Decorations Market Revenues & Volume By Fabric for the Period 2022 - 2032F
- Historical Data and Forecast of Zambia Christmas Decorations Market Revenues & Volume By Distribution Channel for the Period 2022 - 2032F
- Historical Data and Forecast of Zambia Christmas Decorations Market Revenues & Volume By Online Retail for the Period 2022 - 2032F
- Historical Data and Forecast of Zambia Christmas Decorations Market Revenues & Volume By Supermarkets & Hypermarkets for the Period 2022 - 2032F
- Historical Data and Forecast of Zambia Christmas Decorations Market Revenues & Volume By Specialty Stores for the Period 2022 - 2032F
- Historical Data and Forecast of Zambia Christmas Decorations Market Revenues & Volume By Local Shops for the Period 2022 - 2032F
- Historical Data and Forecast of Zambia Christmas Decorations Market Revenues & Volume By End User for the Period 2022 - 2032F
- Historical Data and Forecast of Zambia Christmas Decorations Market Revenues & Volume By Residential for the Period 2022 - 2032F
- Historical Data and Forecast of Zambia Christmas Decorations Market Revenues & Volume By Commercial (Hotels, Shopping Malls, Offices) for the Period 2022 - 2032F
- Historical Data and Forecast of Zambia Christmas Decorations Market Revenues & Volume By Public Spaces for the Period 2022 - 2032F
- Zambia Christmas Decorations Import Export Trade Statistics
- Market Opportunity Assessment By Product Type
- Market Opportunity Assessment By Material
- Market Opportunity Assessment By Distribution Channel
- Market Opportunity Assessment By End User
- Zambia Christmas Decorations Top Companies Market Share
- Zambia Christmas Decorations Competitive Benchmarking By Technical and Operational Parameters
- Zambia Christmas Decorations Company Profiles
- Zambia Christmas Decorations Key Strategic Recommendations
Frequently Asked Questions About the Market Study (FAQs):
6Wresearch actively monitors the Zambia Christmas Decorations Market and publishes its comprehensive annual report, highlighting emerging trends, growth drivers, revenue analysis, and forecast outlook. Our insights help businesses to make data-backed strategic decisions with ongoing market dynamics. Our analysts track relevent industries related to the Zambia Christmas Decorations Market, allowing our clients with actionable intelligence and reliable forecasts tailored to emerging regional needs.
Yes, we provide customisation as per your requirements. To learn more, feel free to contact us on sales@6wresearch.com
1 Executive Summary |
2 Introduction |
2.1 Key Highlights of the Report |
2.2 Report Description |
2.3 Market Scope & Segmentation |
2.4 Research Methodology |
2.5 Assumptions |
3 Zambia Christmas Decorations Market Overview |
3.1 Zambia Country Macro Economic Indicators |
3.2 Zambia Christmas Decorations Market Revenues & Volume, 2022 & 2032F |
3.3 Zambia Christmas Decorations Market - Industry Life Cycle |
3.4 Zambia Christmas Decorations Market - Porter's Five Forces |
3.5 Zambia Christmas Decorations Market Revenues & Volume Share, By Product Type, 2022 & 2032F |
3.6 Zambia Christmas Decorations Market Revenues & Volume Share, By Material, 2022 & 2032F |
3.7 Zambia Christmas Decorations Market Revenues & Volume Share, By Distribution Channel, 2022 & 2032F |
3.8 Zambia Christmas Decorations Market Revenues & Volume Share, By End User, 2022 & 2032F |
4 Zambia Christmas Decorations Market Dynamics |
4.1 Impact Analysis |
4.2 Market Drivers |
4.2.1 Growing disposable income levels in Zambia, leading to increased spending on festive decorations. |
4.2.2 Rising urbanization and modernization trends, resulting in higher demand for Christmas decorations. |
4.2.3 Cultural significance of Christmas celebrations in Zambia, driving the demand for decorations. |
4.3 Market Restraints |
4.3.1 Limited availability of locally made high-quality decorations, leading to reliance on imports. |
4.3.2 Seasonal nature of the Christmas decorations market, with demand concentrated around the holiday season. |
5 Zambia Christmas Decorations Market Trends |
6 Zambia Christmas Decorations Market, By Types |
6.1 Zambia Christmas Decorations Market, By Product Type |
6.1.1 Overview and Analysis |
6.1.2 Zambia Christmas Decorations Market Revenues & Volume, By Product Type, 2022 - 2032F |
6.1.3 Zambia Christmas Decorations Market Revenues & Volume, By Christmas Trees, 2022 - 2032F |
6.1.4 Zambia Christmas Decorations Market Revenues & Volume, By Ornaments, 2022 - 2032F |
6.1.5 Zambia Christmas Decorations Market Revenues & Volume, By Garlands, 2022 - 2032F |
6.1.6 Zambia Christmas Decorations Market Revenues & Volume, By Wreaths, 2022 - 2032F |
6.1.7 Zambia Christmas Decorations Market Revenues & Volume, By Nativity Scenes, 2022 - 2032F |
6.2 Zambia Christmas Decorations Market, By Material |
6.2.1 Overview and Analysis |
6.2.2 Zambia Christmas Decorations Market Revenues & Volume, By Plastic, 2022 - 2032F |
6.2.3 Zambia Christmas Decorations Market Revenues & Volume, By Glass, 2022 - 2032F |
6.2.4 Zambia Christmas Decorations Market Revenues & Volume, By Metal, 2022 - 2032F |
6.2.5 Zambia Christmas Decorations Market Revenues & Volume, By Paper, 2022 - 2032F |
6.2.6 Zambia Christmas Decorations Market Revenues & Volume, By Fabric, 2022 - 2032F |
6.3 Zambia Christmas Decorations Market, By Distribution Channel |
6.3.1 Overview and Analysis |
6.3.2 Zambia Christmas Decorations Market Revenues & Volume, By Online Retail, 2022 - 2032F |
6.3.3 Zambia Christmas Decorations Market Revenues & Volume, By Supermarkets & Hypermarkets, 2022 - 2032F |
6.3.4 Zambia Christmas Decorations Market Revenues & Volume, By Specialty Stores, 2022 - 2032F |
6.3.5 Zambia Christmas Decorations Market Revenues & Volume, By Local Shops, 2022 - 2032F |
6.4 Zambia Christmas Decorations Market, By End User |
6.4.1 Overview and Analysis |
6.4.2 Zambia Christmas Decorations Market Revenues & Volume, By Residential, 2022 - 2032F |
6.4.3 Zambia Christmas Decorations Market Revenues & Volume, By Commercial (Hotels, Shopping Malls, Offices), 2022 - 2032F |
6.4.4 Zambia Christmas Decorations Market Revenues & Volume, By Public Spaces, 2022 - 2032F |
7 Zambia Christmas Decorations Market Import-Export Trade Statistics |
7.1 Zambia Christmas Decorations Market Export to Major Countries |
7.2 Zambia Christmas Decorations Market Imports from Major Countries |
8 Zambia Christmas Decorations Market Key Performance Indicators |
8.1 Percentage increase in online searches for Christmas decorations in Zambia. |
8.2 Growth in the number of retail outlets stocking a wide variety of Christmas decorations. |
8.3 Increase in the number of local artisans producing unique Christmas decorations. |
8.4 Adoption rate of eco-friendly and sustainable Christmas decorations in the Zambian market. |
9 Zambia Christmas Decorations Market - Opportunity Assessment |
9.1 Zambia Christmas Decorations Market Opportunity Assessment, By Product Type, 2022 & 2032F |
9.2 Zambia Christmas Decorations Market Opportunity Assessment, By Material, 2022 & 2032F |
9.3 Zambia Christmas Decorations Market Opportunity Assessment, By Distribution Channel, 2022 & 2032F |
9.4 Zambia Christmas Decorations Market Opportunity Assessment, By End User, 2022 & 2032F |
10 Zambia Christmas Decorations Market - Competitive Landscape |
10.1 Zambia Christmas Decorations Market Revenue Share, By Companies, 2025 |
10.2 Zambia Christmas Decorations Market Competitive Benchmarking, By Operating and Technical Parameters |
11 Company Profiles |
12 Recommendations |
13 Disclaimer |
Export potential assessment - trade Analytics for 2030
Export potential enables firms to identify high-growth global markets with greater confidence by combining advanced trade intelligence with a structured quantitative methodology. The framework analyzes emerging demand trends and country-level import patterns while integrating macroeconomic and trade datasets such as GDP and population forecasts, bilateral import–export flows, tariff structures, elasticity differentials between developed and developing economies, geographic distance, and import demand projections. Using weighted trade values from 2020–2024 as the base period to project country-to-country export potential for 2030, these inputs are operationalized through calculated drivers such as gravity model parameters, tariff impact factors, and projected GDP per-capita growth. Through an analysis of hidden potentials, demand hotspots, and market conditions that are most favorable to success, this method enables firms to focus on target countries, maximize returns, and global expansion with data, backed by accuracy.
By factoring in the projected importer demand gap that is currently unmet and could be potential opportunity, it identifies the potential for the Exporter (Country) among 190 countries, against the general trade analysis, which identifies the biggest importer or exporter.
To discover high-growth global markets and optimize your business strategy:
Click Here
Pricing
- Single User License$ 1,995
- Department License$ 2,400
- Site License$ 3,120
- Global License$ 3,795

Search
Thought Leadership and Analyst Meet


Our Clients
Latest Reports
- United Kingdom (UK) Outdoor Cooking Equipment Market (2026-2032) | Investment Opportunities, Outlook, Growth, Competition, Trends, Pricing, Demand, Insights, Challenges, Drivers, Size, Restraints, segmentation, Value, Share, Forecast, Companies, Analysis, Revenue, Strategy
- United Arab Emirates (UAE) Outdoor Cooking Equipment Market (2026-2032) | Challenges, Value, Restraints, Growth, Competition, Revenue, Trends, Outlook, Analysis, Drivers, Share, Investment Opportunities, Strategy, Demand, Companies, Forecast, Pricing, segmentation, Size, Insights
- Vietnam Outdoor Cooking Equipment Market (2026-2032) | Demand, Investment Opportunities, Growth, Pricing, Trends, Restraints, Competition, Outlook, Drivers, Strategy, Challenges, Revenue, Analysis, segmentation, Value, Size, Share, Insights, Companies, Forecast
- Venezuela Outdoor Cooking Equipment Market (2026-2032) | Challenges, Revenue, Demand, Value, Pricing, Strategy, Competition, Analysis, Companies, Insights, Growth, Outlook, Forecast, Size, Restraints, segmentation, Drivers, Trends, Investment Opportunities, Share
- Uganda Outdoor Cooking Equipment Market (2026-2032) | Drivers, Pricing, Challenges, Value, Growth, Companies, segmentation, Strategy, Analysis, Demand, Outlook, Size, Competition, Restraints, Revenue, Forecast, Investment Opportunities, Insights, Trends, Share
- Turkey Outdoor Cooking Equipment Market (2026-2032) | Size, Competition, Outlook, Strategy, Forecast, Drivers, Trends, Companies, Revenue, Growth, Analysis, segmentation, Insights, Pricing, Restraints, Demand, Investment Opportunities, Value, Share, Challenges
- Tunisia Outdoor Cooking Equipment Market (2026-2032) | Analysis, Share, Pricing, Trends, Size, Outlook, Revenue, segmentation, Demand, Insights, Investment Opportunities, Restraints, Growth, Forecast, Competition, Drivers, Challenges, Companies, Strategy, Value
- Thailand Outdoor Cooking Equipment Market (2026-2032) | Growth, Revenue, Insights, Companies, Drivers, Strategy, Forecast, Size, Analysis, segmentation, Trends, Challenges, Competition, Share, Investment Opportunities, Demand, Pricing, Value, Restraints, Outlook
- Tanzania Outdoor Cooking Equipment Market (2026-2032) | Share, Drivers, Forecast, Revenue, Growth, Outlook, Analysis, Investment Opportunities, Restraints, segmentation, Demand, Pricing, Size, Insights, Challenges, Competition, Companies, Value, Trends, Strategy
- Tajikistan Outdoor Cooking Equipment Market (2026-2032) | Value, Pricing, Companies, Share, Strategy, Revenue, Investment Opportunities, Demand, Forecast, Size, Competition, Challenges, Growth, Insights, Restraints, segmentation, Analysis, Trends, Drivers, Outlook
Industry Events and Analyst Meet

HIMTEX 2026

India Refining Summit 2026

India EV Show 2026

EV tech India Expo 2026

Auto Tech Asia 2026
Whitepaper
- Middle East & Africa Commercial Security Market Click here to view more.
- Middle East & Africa Fire Safety Systems & Equipment Market Click here to view more.
- GCC Drone Market Click here to view more.
- Middle East Lighting Fixture Market Click here to view more.
- GCC Physical & Perimeter Security Market Click here to view more.
6WResearch In News
- Doha a strategic location for EV manufacturing hub: IPA Qatar
- Demand for luxury TVs surging in the GCC, says Samsung
- Empowering Growth: The Thriving Journey of Bangladesh’s Cable Industry
- Demand for luxury TVs surging in the GCC, says Samsung
- Video call with a traditional healer? Once unthinkable, it’s now common in South Africa
- Intelligent Buildings To Smooth GCC’s Path To Net Zero