Argentina Energy Saving & Fluorescent Market (2026-2032) | Outlook, Growth, Companies, Industry, Trends, Value, Size, Share, Forecast, Analysis, Revenue
Market Forecast By Sources (High-Intensity Discharge Lamps (HID), Linear Fluorescent Lamps (LFL), Light Emitting Diodes (LED)), By Applications (Commercial, Residential, Government) And Competitive Landscape
| Product Code: ETC005065 | Publication Date: Sep 2020 | Updated Date: Jun 2026 | Product Type: Report | |
| Publisher: 6Wresearch | Author: Ravi Bhandari | No. of Pages: 70 | No. of Figures: 35 | No. of Tables: 5 |
Argentina Energy Saving & Fluorescent Market Summary
The argentina energy saving & fluorescent market was estimated at USD 348 Million in 2025 and is projected to reach USD 507 Million by 2032, growing at a CAGR of 6.5% from 2026 to 2032.
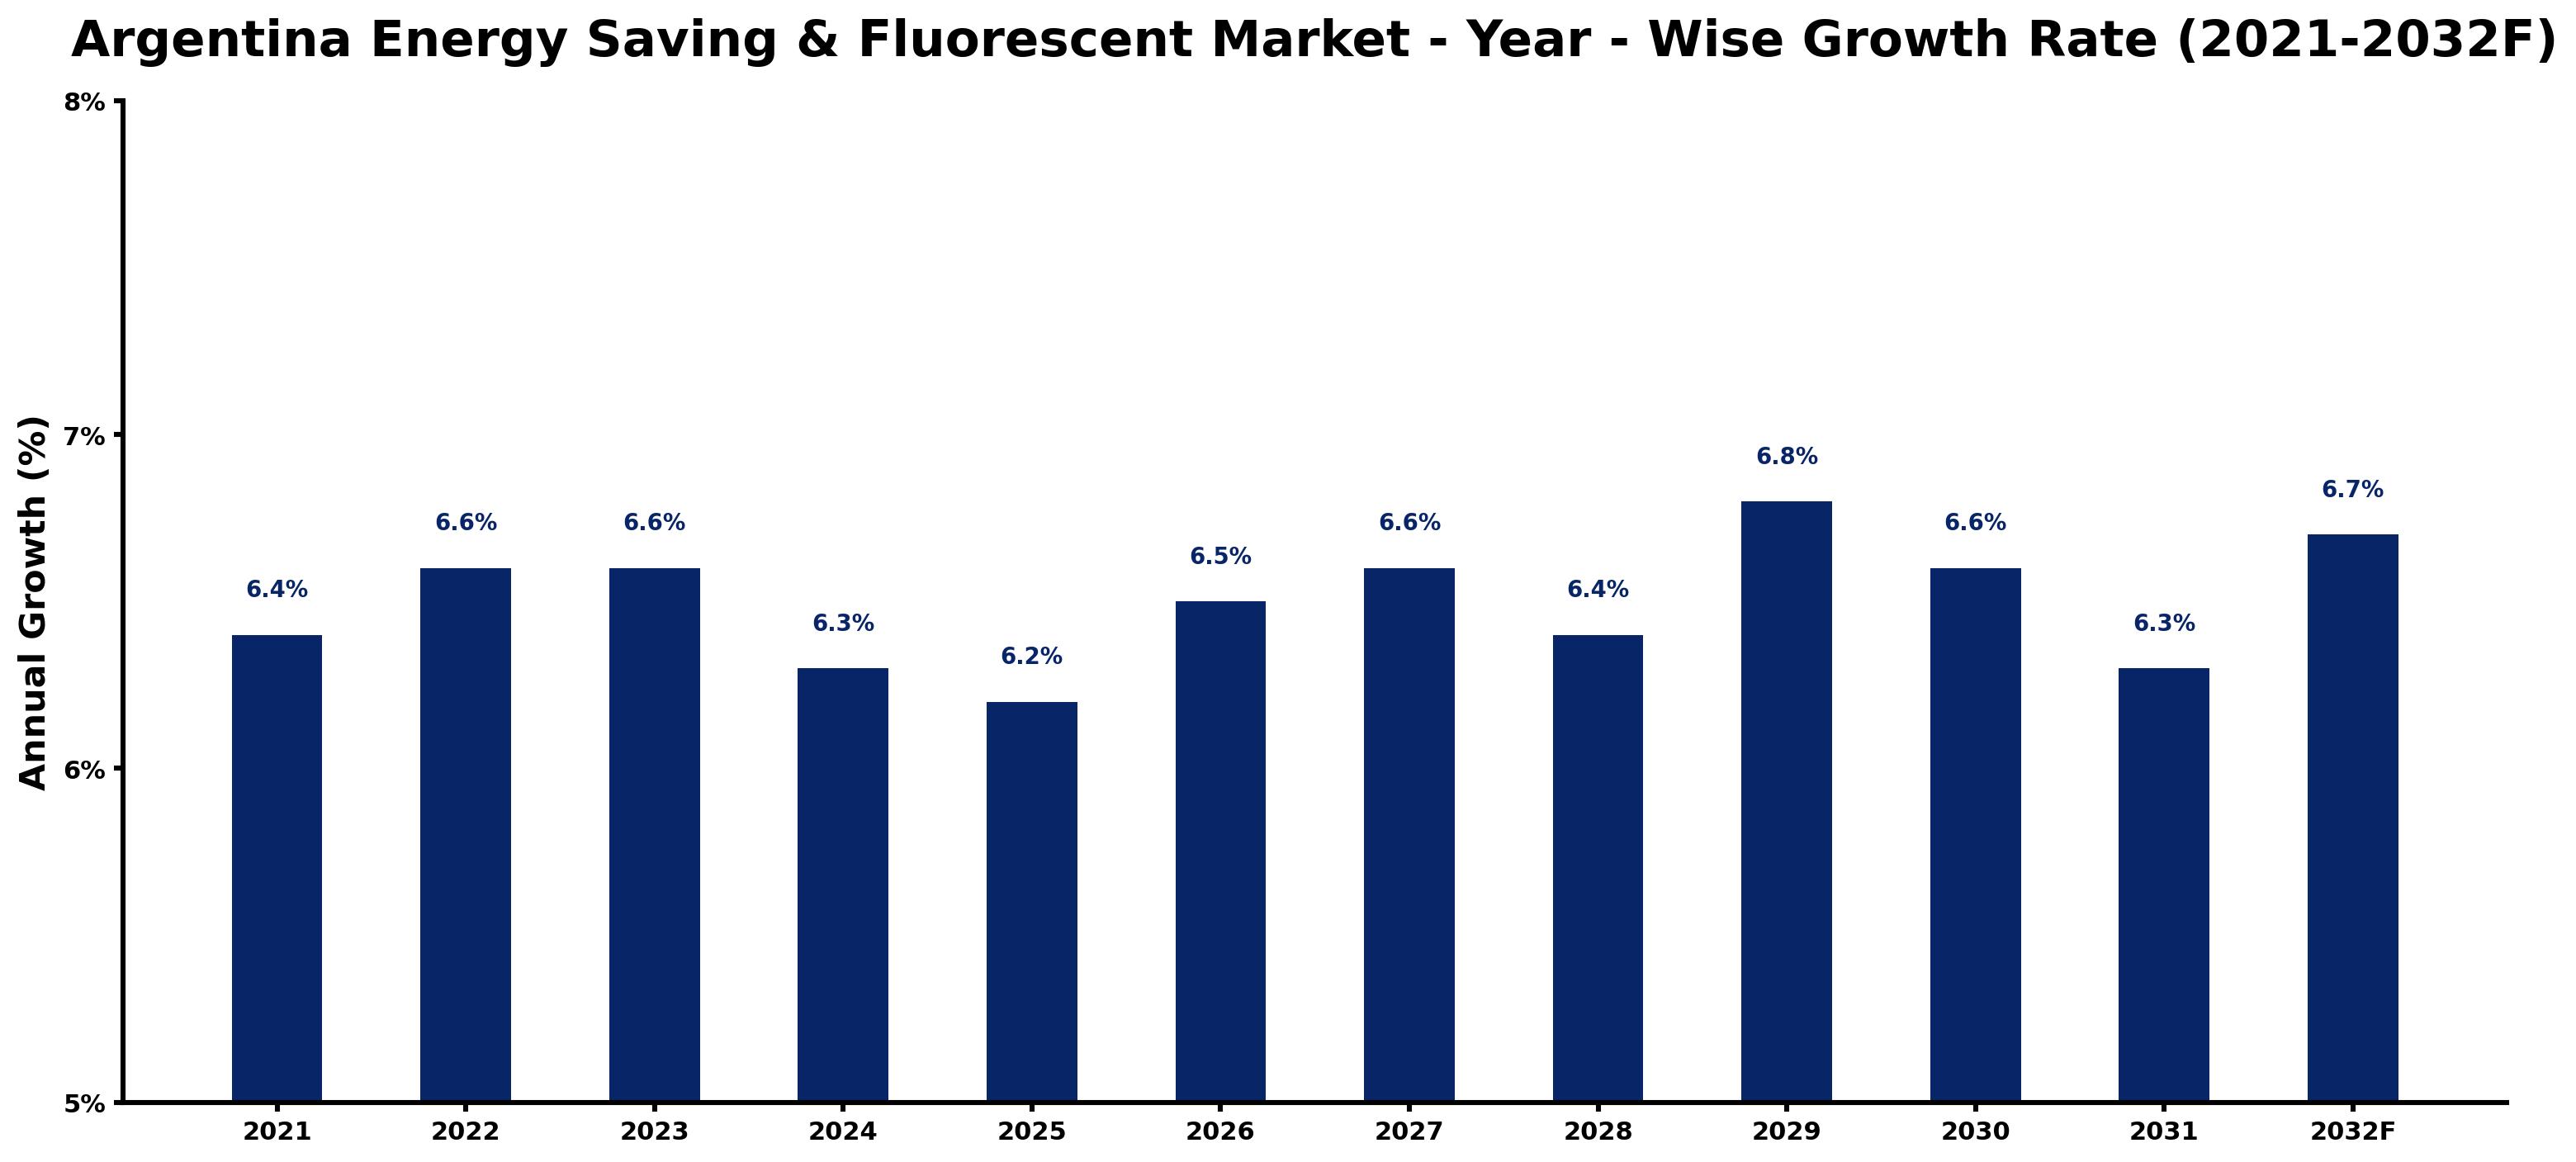
Argentina Energy Saving & Fluorescent Market Growth Rate Analysis (2021-2032)
The Argentina Energy Saving & Fluorescent market is set to experience steady growth, with annual increases ranging from 6.2% to 6.8% through 2032. Key drivers behind this positive trend include heightened consumer demand for energy-efficient solutions, bolstered by government policies promoting sustainability and emission reductions. In 2021 and 2022, growth rates peaked at 6.4% and 6.6%, reflecting increased investments in infrastructure and energy transition initiatives. Although there's a slight dip to 6.2% in 2025, the market rebounds to 6.6% by 2030, demonstrating resilience amidst fluctuating technology shifts. Overall, commitment to environmental goals continues to underpin stable advancements in the sector.
Argentina Energy Saving & Fluorescent Market Year-wise Growth Rate and Key Drivers
This graph highlights how the Argentina Energy Saving & Fluorescent Market has steadily grown over the past five years, supported by major growth factors.
The table below presents the year wise growth rates along with the key drivers influencing the market
| Year | Growth Rate | Major Drivers |
| 2021 | 6.4% | Post-lockdown retail projects emphasized energy-efficient solutions to reduce operational costs. |
| 2022 | 6.6% | Consumer awareness campaigns elevated the importance of sustainability in residential sectors. |
| 2023 | 6.6% | Local manufacturers began producing affordable fluorescent lighting options tailored for Argentine households. |
| 2024 | 6.3% | Utility companies started offering incentives for energy-efficient product purchases to reduce strain. |
| 2025 | 6.2% | Rising electricity prices prompted more businesses to seek cost-effective energy-saving solutions. |
| 2026 | 6.5% | Technological improvements in LED designs made them more accessible for mainstream consumers. |
| 2027 | 6.6% | Urban migration patterns increased reliance on efficient lighting in densely populated areas. |
| 2028 | 6.4% | Corporate social responsibility initiatives highlighted energy efficiency as a key focus area. |
| 2029 | 6.8% | Long-term energy contracts incentivized manufacturing firms to invest in energy-saving technologies. |
| 2030 | 6.6% | Public projects prioritized energy-efficient infrastructure, demonstrating commitment to sustainable development. |
| 2031 | 6.3% | Partnerships between local governments and firms fostered innovation in energy-saving products. |
| 2032 | 6.7% | Consumer trends shifted towards eco-friendly products, cementing market demand for energy-efficient solutions. |
Note - Market size estimations and growth projections presented in this report are based on 6Wresearch's advanced forecasting approach, validated with industry datasets as of June 2026.
Key Highlights of the Report:
- Argentina Energy Saving & Fluorescent Market Outlook
- Market Size of Argentina Energy Saving & Fluorescent Market, 2025
- Forecast of Argentina Energy Saving & Fluorescent Market, 2032F
- Historical Data and Forecast of Argentina Energy Saving & Fluorescent Revenues & Volume for the Period 2022-2032F
- Argentina Energy Saving & Fluorescent Market Trend Evolution
- Argentina Energy Saving & Fluorescent Market Drivers and Challenges
- Argentina Energy Saving & Fluorescent Price Trends
- Argentina Energy Saving & Fluorescent Porter's Five Forces
- Argentina Energy Saving & Fluorescent Industry Life Cycle
- Historical Data and Forecast of Argentina Energy Saving & Fluorescent Market Revenues & Volume By Sources for the Period 2022-2032F
- Historical Data and Forecast of Argentina Energy Saving & Fluorescent Market Revenues & Volume By High-Intensity Discharge Lamps (HID) for the Period 2022-2032F
- Historical Data and Forecast of Argentina Energy Saving & Fluorescent Market Revenues & Volume By Linear Fluorescent Lamps (LFL) for the Period 2022-2032F
- Historical Data and Forecast of Argentina Energy Saving & Fluorescent Market Revenues & Volume By Light Emitting Diodes (LED) for the Period 2022-2032F
- Historical Data and Forecast of Argentina Energy Saving & Fluorescent Market Revenues & Volume By Applications for the Period 2022-2032F
- Historical Data and Forecast of Argentina Energy Saving & Fluorescent Market Revenues & Volume By Commercial for the Period 2022-2032F
- Historical Data and Forecast of Argentina Energy Saving & Fluorescent Market Revenues & Volume By Residential for the Period 2022-2032F
- Historical Data and Forecast of Argentina Energy Saving & Fluorescent Market Revenues & Volume By Government for the Period 2022-2032F
- Argentina Energy Saving & Fluorescent Import Export Trade Statistics
- Market Opportunity Assessment By Sources
- Market Opportunity Assessment By Applications
- Argentina Energy Saving & Fluorescent Top Companies Market Share
- Argentina Energy Saving & Fluorescent Competitive Benchmarking By Technical and Operational Parameters
- Argentina Energy Saving & Fluorescent Company Profiles
- Argentina Energy Saving & Fluorescent Key Strategic Recommendations
Frequently Asked Questions About the Market Study (FAQs):
6Wresearch actively monitors the Argentina Energy Saving & Fluorescent Market and publishes its comprehensive annual report, highlighting emerging trends, growth drivers, revenue analysis, and forecast outlook. Our insights help businesses to make data-backed strategic decisions with ongoing market dynamics. Our analysts track relevent industries related to the Argentina Energy Saving & Fluorescent Market, allowing our clients with actionable intelligence and reliable forecasts tailored to emerging regional needs.
Yes, we provide customisation as per your requirements. To learn more, feel free to contact us on sales@6wresearch.com
1 Executive Summary |
2 Introduction |
2.1 Key Highlights of the Report |
2.2 Report Description |
2.3 Market Scope & Segmentation |
2.4 Research Methodology |
2.5 Assumptions |
3 Argentina Energy Saving & Fluorescent Market Overview |
3.1 Argentina Country Macro Economic Indicators |
3.2 Argentina Energy Saving & Fluorescent Market Revenues & Volume, 2022 & 2032F |
3.3 Argentina Energy Saving & Fluorescent Market - Industry Life Cycle |
3.4 Argentina Energy Saving & Fluorescent Market - Porter's Five Forces |
3.5 Argentina Energy Saving & Fluorescent Market Revenues & Volume Share, By Sources, 2022 & 2032F |
3.6 Argentina Energy Saving & Fluorescent Market Revenues & Volume Share, By Applications, 2022 & 2032F |
4 Argentina Energy Saving & Fluorescent Market Dynamics |
4.1 Impact Analysis |
4.2 Market Drivers |
4.3 Market Restraints |
5 Argentina Energy Saving & Fluorescent Market Trends |
6 Argentina Energy Saving & Fluorescent Market, By Types |
6.1 Argentina Energy Saving & Fluorescent Market, By Sources |
6.1.1 Overview and Analysis |
6.1.2 Argentina Energy Saving & Fluorescent Market Revenues & Volume, By Sources, 2022 - 2032F |
6.1.3 Argentina Energy Saving & Fluorescent Market Revenues & Volume, By High-Intensity Discharge Lamps (HID), 2022 - 2032F |
6.1.4 Argentina Energy Saving & Fluorescent Market Revenues & Volume, By Linear Fluorescent Lamps (LFL), 2022 - 2032F |
6.1.5 Argentina Energy Saving & Fluorescent Market Revenues & Volume, By Light Emitting Diodes (LED), 2022 - 2032F |
6.2 Argentina Energy Saving & Fluorescent Market, By Applications |
6.2.1 Overview and Analysis |
6.2.2 Argentina Energy Saving & Fluorescent Market Revenues & Volume, By Commercial, 2022 - 2032F |
6.2.3 Argentina Energy Saving & Fluorescent Market Revenues & Volume, By Residential, 2022 - 2032F |
6.2.4 Argentina Energy Saving & Fluorescent Market Revenues & Volume, By Government, 2022 - 2032F |
7 Argentina Energy Saving & Fluorescent Market Import-Export Trade Statistics |
7.1 Argentina Energy Saving & Fluorescent Market Export to Major Countries |
7.2 Argentina Energy Saving & Fluorescent Market Imports from Major Countries |
8 Argentina Energy Saving & Fluorescent Market Key Performance Indicators |
9 Argentina Energy Saving & Fluorescent Market - Opportunity Assessment |
9.1 Argentina Energy Saving & Fluorescent Market Opportunity Assessment, By Sources, 2022 & 2032F |
9.2 Argentina Energy Saving & Fluorescent Market Opportunity Assessment, By Applications, 2022 & 2032F |
10 Argentina Energy Saving & Fluorescent Market - Competitive Landscape |
10.1 Argentina Energy Saving & Fluorescent Market Revenue Share, By Companies, 2025 |
10.2 Argentina Energy Saving & Fluorescent Market Competitive Benchmarking, By Operating and Technical Parameters |
11 Company Profiles |
12 Recommendations |
13 Disclaimer |
Global Go To Market Strategy - 2030
Export potential enables firms to identify high-growth global markets with greater confidence by combining advanced trade intelligence with a structured quantitative methodology. The framework analyzes emerging demand trends and country-level import patterns while integrating macroeconomic and trade datasets such as GDP and population forecasts, bilateral import–export flows, tariff structures, elasticity differentials between developed and developing economies, geographic distance, and import demand projections. Using weighted trade values from 2020–2024 as the base period to project country-to-country export potential for 2030, these inputs are operationalized through calculated drivers such as gravity model parameters, tariff impact factors, and projected GDP per-capita growth. Through an analysis of hidden potentials, demand hotspots, and market conditions that are most favorable to success, this method enables firms to focus on target countries, maximize returns, and global expansion with data, backed by accuracy.
By factoring in the projected importer demand gap that is currently unmet and could be potential opportunity, it identifies the potential for the Exporter (Country) among 190 countries, against the general trade analysis, which identifies the biggest importer or exporter.
To discover high-growth global markets and optimize your business strategy:
Click Here
Pricing
- Single User License$ 1,995
- Department License$ 2,400
- Site License$ 3,120
- Global License$ 3,795

Leadership Perspectives from Industry Events
Search
Thought Leadership and Analyst Meet


Our Clients
6WResearch In News
- India Air Conditioner Market Set for Strong Rebound in 2026 After Weather-Led Correction and GST-Driven Recovery: 6Wresearch
- ADAS in India: How Automatic Emergency Braking, Blind Spot Detection & Driver Monitoring are Transforming Road Safety
- Doha a strategic location for EV manufacturing hub: IPA Qatar
- Demand for luxury TVs surging in the GCC, says Samsung
- Empowering Growth: The Thriving Journey of Bangladesh’s Cable Industry
- Demand for luxury TVs surging in the GCC, says Samsung
Latest Reports
- Poland Fire Protection Systems Market (2026-2032)
- Cape Verde Portable Hand-Thrown Extinguisher Market (2026-2032)
- Canada Portable Hand-Thrown Extinguisher Market (2026-2032)
- Cameroon Portable Hand-Thrown Extinguisher Market (2026-2032)
- Burundi Portable Hand-Thrown Extinguisher Market (2026-2032)
- Burkina Faso Portable Hand-Thrown Extinguisher Market (2026-2032)
- Bulgaria Portable Hand-Thrown Extinguisher Market (2026-2032)
- Brunei Portable Hand-Thrown Extinguisher Market (2026-2032)
- Botswana Portable Hand-Thrown Extinguisher Market (2026-2032)
- Bosnia and Herzegovina Portable Hand-Thrown Extinguisher Market (2026-2032)
Industry Events and Analyst Meet

HIMTEX 2026

India Refining Summit 2026

India EV Show 2026

EV tech India Expo 2026

Auto Tech Asia 2026
Whitepaper
- Middle East & Africa Commercial Security Market Click here to view more.
- Middle East & Africa Fire Safety Systems & Equipment Market Click here to view more.
- GCC Drone Market Click here to view more.
- Middle East Lighting Fixture Market Click here to view more.
- GCC Physical & Perimeter Security Market Click here to view more.