Australia Agricultural Trailers Market (2026-2032) | Revenue, Trends, Analysis, Companies, Size, Value, Forecast, Share, Growth, Industry & Outlook
Market Forecast By Agricultural Tractor Type (Utility Tractor Trailer, Orchard Type Tractor Trailer, Garden Tractor Trailer), By Product Type (Tipping Trailer, Non Tipping Trailer, Three way Tipping Trailer), By Capacity (Ton) (Less than 2, 2 to 8, Above 8), By Tractor Power (HP) (Less than 30, 30 to 50, 50 to 70, 70 to 90), By Axle (Single Axle, Double Axle, Multi Axle) And Competitive Landscape
| Product Code: ETC031675 | Publication Date: Oct 2020 | Updated Date: Jun 2026 | Product Type: Report | |
| Publisher: 6Wresearch | Author: Ravi Bhandari | No. of Pages: 70 | No. of Figures: 35 | No. of Tables: 5 |
Australia Agricultural Trailers Market Summary
The australia agricultural trailers market was estimated at USD 302 Million in 2025 and is projected to reach USD 412 Million by 2032, growing at a CAGR of 5.0% from 2026 to 2032.
Australia Agricultural Trailers Market Growth Rate Analysis (2021-2032)
The Australian agricultural trailers market is experiencing noteworthy expansion, highlighted by a steady growth rate of 7.5% in 2022 and projected to maintain momentum with increases of 6.9% in 2023 and 4.5% in 2024. This surge is propelled by growing consumer demand driven by advancements in farming technologies and increased agricultural output. Additionally, investments in infrastructure and a heightened focus on sustainability are enhancing operational efficiencies within the sector. However, as the market matures, growth rates are expected to stabilize, reflecting a decline to 4.3% in 2025, before recovering slightly to around 5.0% in 2026 and 5.2% in 2027. The integration of digital solutions and energy-efficient designs continues to shape future developments, ensuring ongoing interest in agricultural trailers.
Australia Agricultural Trailers Market Year-wise Growth Rate and Key Drivers
This graph highlights how the Australia Agricultural Trailers Market has steadily grown over the past five years, supported by major growth factors.
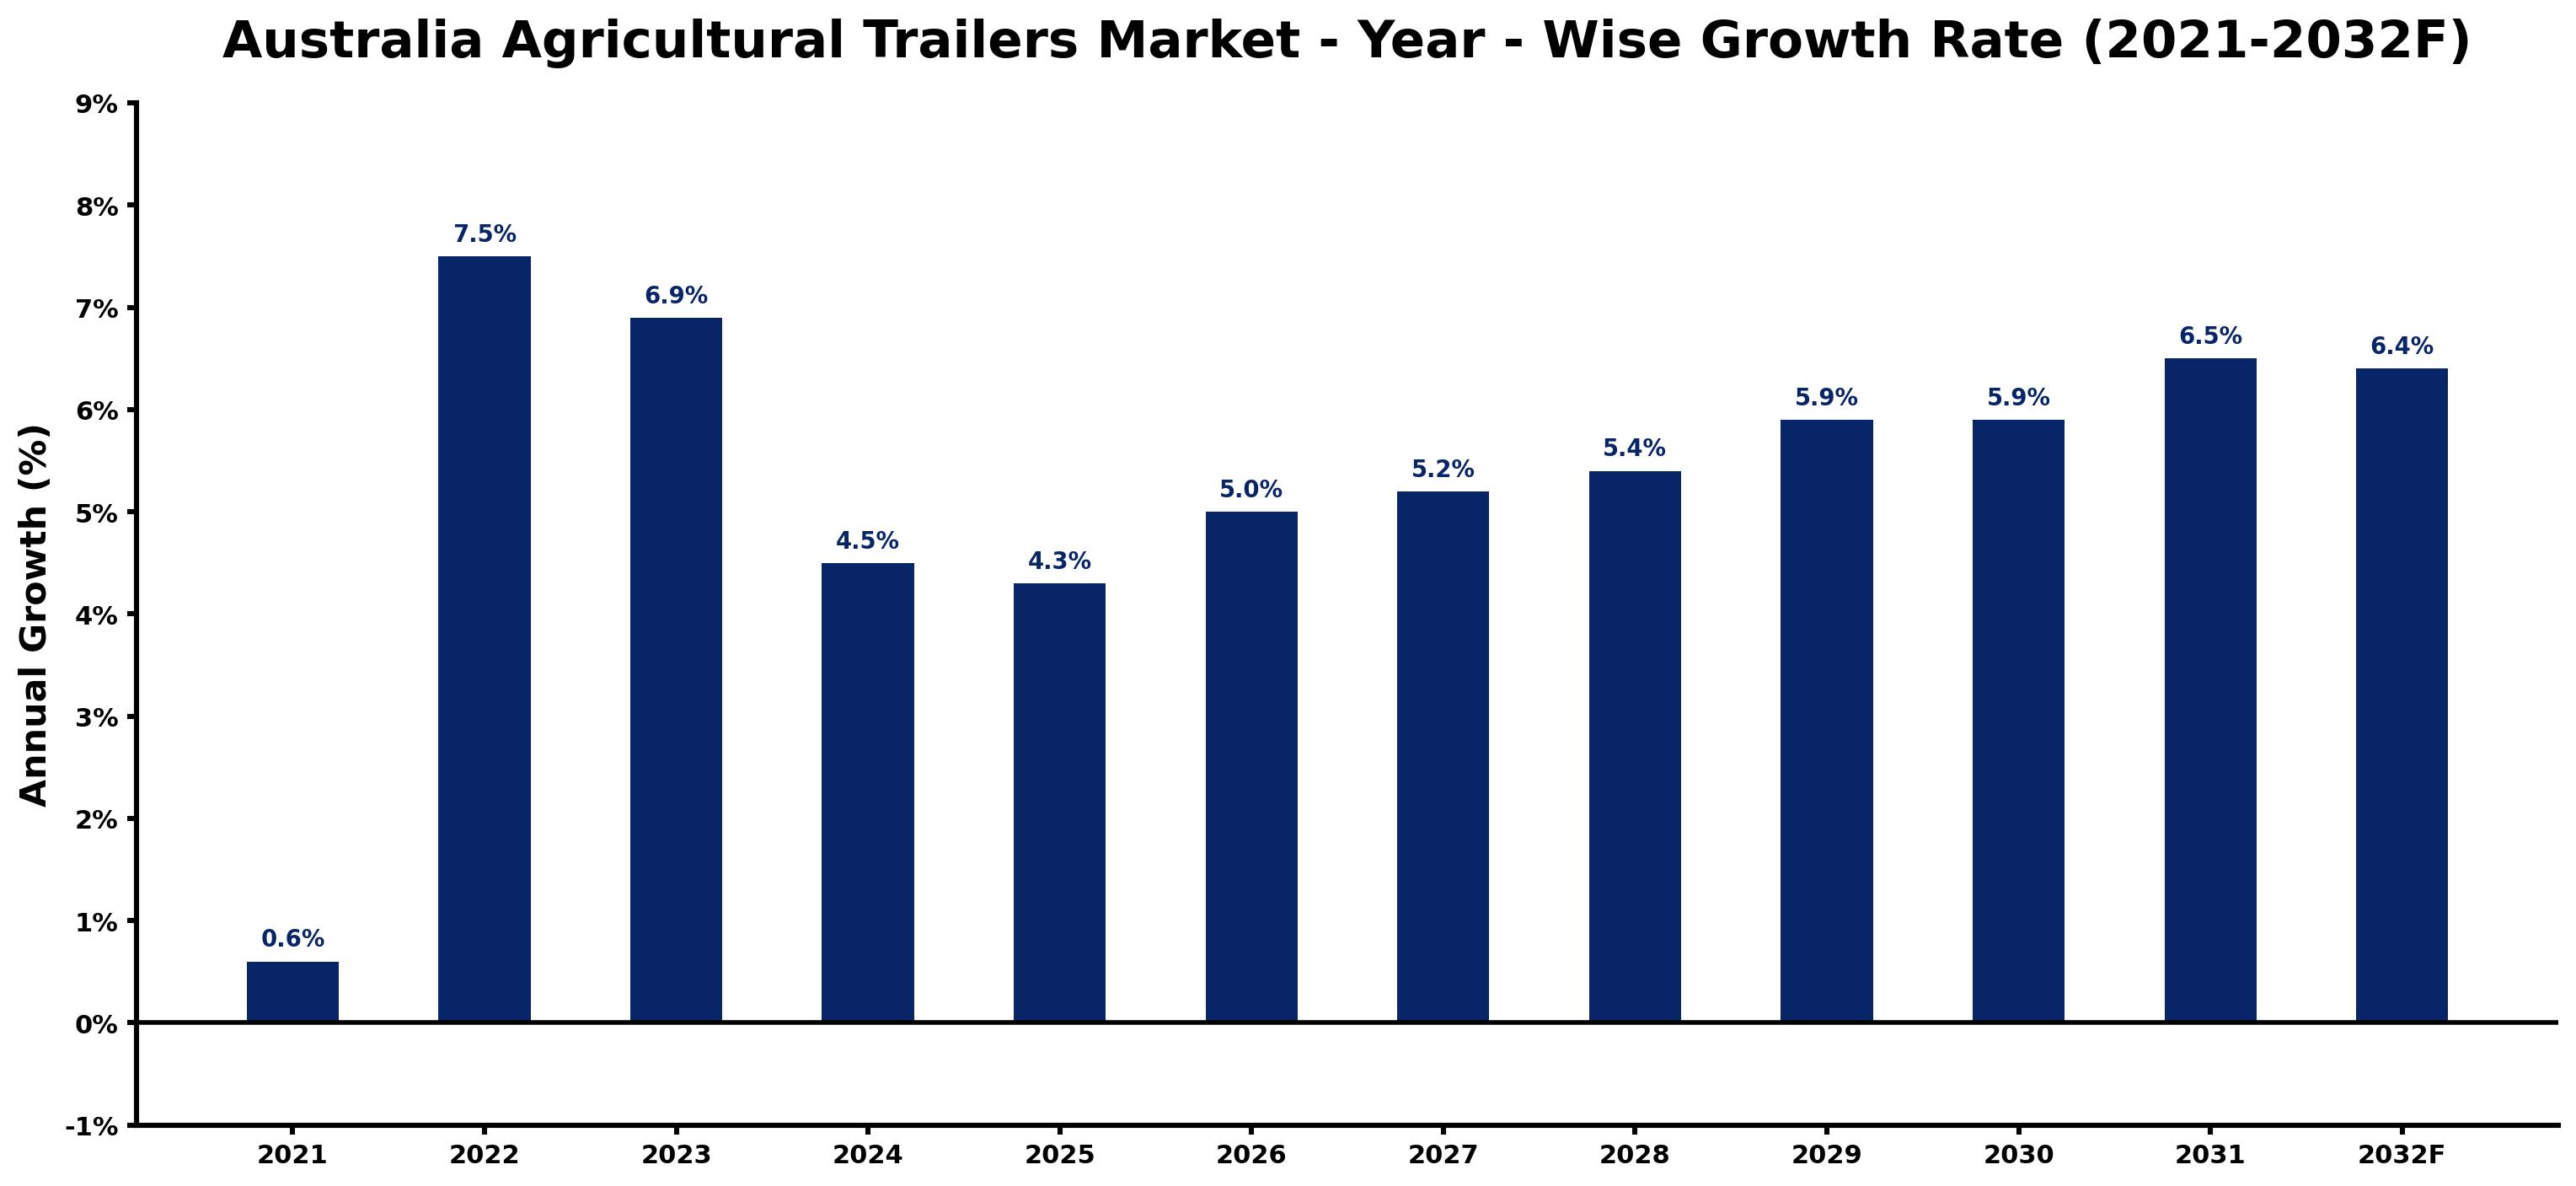
The table below presents the year wise growth rates along with the key drivers influencing the market
| Year | Growth Rate | Major Drivers |
| 2021 | 0.6% | Agricultural production recovery after pandemic spurred trailer demand in multiple sectors. |
| 2022 | 7.5% | Enhanced focus on mechanization and efficiency led to increased trailer purchases. |
| 2023 | 6.9% | Supply chain improvements facilitated better access to high-capacity agricultural trailers. |
| 2024 | 4.5% | Technological integration in farming enhanced trailer utility, attracting diverse agricultural users. |
| 2025 | 4.3% | Rural infrastructure investments prompted trailer upgrades for better transportation capabilities. |
| 2026 | 5.0% | Sustainability initiatives drove interest in environmentally friendly trailer options and designs. |
| 2027 | 5.2% | Rising labor costs motivated farmers to invest in automated agricultural trailer solutions. |
| 2028 | 5.4% | Increased export opportunities for Australian produce resulted in higher trailer demand. |
| 2029 | 5.9% | Growing climate variability prompted shifts to more versatile and durable trailer options. |
| 2030 | 5.9% | Emerging precision agriculture practices required specialized trailers for enhanced functionality. |
| 2031 | 6.5% | Strong economic performance in agriculture encouraged larger investment in trailer fleets. |
| 2032 | 6.4% | Focus on food security led to heightened interest in reliable agricultural transport solutions. |
Note - Market size estimations and growth projections presented in this report are based on 6Wresearch's advanced forecasting approach, validated with industry datasets as of June 2026.
Australia Agricultural Trailers Market Synopsis
The Australia Agricultural Trailers Market is projected to reach 5.0% and witness significant growth during the forecast period (2026-2032). This market encompasses a variety of agricultural trailers designed for diverse applications within the agricultural sector. These trailers play a critical role in the efficient transportation of crops, equipment, and agricultural inputs across various farming operations, ranging from family-owned enterprises to vast commercial farms.
Australia Agricultural Trailers Market Growth Drivers
The primary growth drivers within the Australia Agricultural Trailers Market are closely tied to evolving agricultural practices and the increasing demand for enhanced transportation solutions. The following factors are contributing to market expansion:
- The ongoing expansion of farm sizes requires more robust and efficient transportation solutions, thus driving the need for high-capacity agricultural trailers.
- Modernization in farming techniques encourages the adoption of advanced transportation methods, facilitating streamlined operations across the agricultural sector.
- Technological advancements in trailer design and materials are crucial, as farmers are increasingly looking for durable and reliable options tailored to their unique needs.
- The rising demand for versatile trailers capable of transporting varying cargo, including crops and livestock, is spurring innovation within the market.
- Government initiatives promoting agricultural productivity further enhance the demand for efficient agricultural trailers necessary to support these objectives.
Australia Agricultural Trailers Market Challenges and Restraints
Despite its growth potential, the Australia Agricultural Trailers Market faces several challenges that could hinder its progress. Key challenges include:
- Stringent safety regulations necessitate compliance from manufacturers, which can complicate the production process and increase costs.
- The logistical challenges that farmers face, particularly in remote areas, can impede the efficient distribution of agricultural trailers.
- Fluctuating commodity prices may affect farmers' ability to invest in new equipment, including agricultural trailers.
- Economic uncertainties and climatic variations could influence overall agricultural productivity, directly impacting the demand for transport solutions.
- The increasing adoption of automated farming technologies may lead to a shift in demand towards specialized transport solutions, challenging traditional trailer manufacturers.
Australia Agricultural Trailers Market Government Investment and Initiatives
Government policies play an influential role in shaping the Australia Agricultural Trailers Market. Various initiatives and investments aim to enhance agricultural productivity and support the modernization of farm operations. These include:
- Public spending on infrastructure development, which indirectly supports the agricultural sector by improving access to markets and transportation routes.
- Incentives for adopting sustainable farming practices, which may include upgrading to more efficient trailers designed to reduce environmental impact.
- Regulatory frameworks aimed at ensuring roadworthiness and safety of trailers, thereby enhancing their reliability and operational efficiency.
- Programs that provide financial assistance or subsidies for farmers to invest in modern agricultural equipment, including trailers.
- Collaborations between government entities and industry stakeholders to promote innovative agricultural technologies that include advancements in trailer design.
Australia Agricultural Trailers Market Latest Developments (May 2025 - June 2026)
From May 2025 to June 2026, the Australia Agricultural Trailers Market has experienced notable developments that indicate a shift in industry dynamics. Trends during this period include:
- An increase in investments into trailer technology focused on enhancing efficiency and reducing maintenance costs for farmers.
- A growing emphasis on sustainable materials and designs in trailer manufacturing, aligning with broader environmental goals within the agricultural sector.
- Emerging partnerships between agricultural technology firms and trailer manufacturers, which aim to integrate smart technologies into trailer designs.
- Heightened industry dialogue around safety and compliance, leading to better practices and standards among manufacturers.
- Continued advocacy for farmer-centric policies that support the adoption of modern agricultural infrastructure, including trailers.
Australia Agricultural Trailers Market - Key Attractiveness of the Report
- 10 Years of Market Numbers
- Historical Data Starting from 2022 to 2025
- Base Year: 2025
- Forecast Data until 2032
- Key Performance Indicators Impacting the Market
- Major Upcoming Developments and Projects
Key Highlights of the Report:
- Australia Agricultural Trailers Market Outlook
- Market Size of Australia Agricultural Trailers Market, 2025
- Forecast of Australia Agricultural Trailers Market, 2032
- Historical Data and Forecast of Australia Agricultural Trailers Revenues & Volume for the Period 2022-2032F
- Australia Agricultural Trailers Market Trend Evolution
- Australia Agricultural Trailers Market Drivers and Challenges
- Australia Agricultural Trailers Price Trends
- Australia Agricultural Trailers Porter's Five Forces
- Australia Agricultural Trailers Industry Life Cycle
- Historical Data and Forecast of Australia Agricultural Trailers Market Revenues & Volume By Agricultural Tractor Type for the Period 2022-2032F
- Historical Data and Forecast of Australia Agricultural Trailers Market Revenues & Volume By Utility Tractor Trailer for the Period 2022-2032F
- Historical Data and Forecast of Australia Agricultural Trailers Market Revenues & Volume By Orchard Type Tractor Trailer for the Period 2022-2032F
- Historical Data and Forecast of Australia Agricultural Trailers Market Revenues & Volume By Garden Tractor Trailer for the Period 2022-2032F
- Historical Data and Forecast of Australia Agricultural Trailers Market Revenues & Volume By Product Type for the Period 2022-2032F
- Historical Data and Forecast of Australia Agricultural Trailers Market Revenues & Volume By Tipping Trailer for the Period 2022-2032F
- Historical Data and Forecast of Australia Agricultural Trailers Market Revenues & Volume By Non Tipping Trailer for the Period 2022-2032F
- Historical Data and Forecast of Australia Agricultural Trailers Market Revenues & Volume By Three way Tipping Trailer for the Period 2022-2032F
- Historical Data and Forecast of Australia Agricultural Trailers Market Revenues & Volume By Capacity (Ton) for the Period 2022-2032F
- Historical Data and Forecast of Australia Agricultural Trailers Market Revenues & Volume By Less than 2 for the Period 2022-2032F
- Historical Data and Forecast of Australia Agricultural Trailers Market Revenues & Volume By 2 to 8 for the Period 2022-2032F
- Historical Data and Forecast of Australia Agricultural Trailers Market Revenues & Volume By Above 8 for the Period 2022-2032F
- Historical Data and Forecast of Australia Agricultural Trailers Market Revenues & Volume By Tractor Power (HP) for the Period 2022-2032F
- Historical Data and Forecast of Australia Agricultural Trailers Market Revenues & Volume By Less than 30 for the Period 2022-2032F
- Historical Data and Forecast of Australia Agricultural Trailers Market Revenues & Volume By 30 to 50 for the Period 2022-2032F
- Historical Data and Forecast of Australia Agricultural Trailers Market Revenues & Volume By 50 to 70 for the Period 2022-2032F
- Historical Data and Forecast of Australia Agricultural Trailers Market Revenues & Volume By 70 to 90 for the Period 2022-2032F
- Historical Data and Forecast of Australia Agricultural Trailers Market Revenues & Volume By Axle for the Period 2022-2032F
- Historical Data and Forecast of Australia Agricultural Trailers Market Revenues & Volume By Single Axle for the Period 2022-2032F
- Historical Data and Forecast of Australia Agricultural Trailers Market Revenues & Volume By Double Axle for the Period 2022-2032F
- Historical Data and Forecast of Australia Agricultural Trailers Market Revenues & Volume By Multi Axle for the Period 2022-2032F
- Australia Agricultural Trailers Import Export Trade Statistics
- Market Opportunity Assessment By Agricultural Tractor Type
- Market Opportunity Assessment By Product Type
- Market Opportunity Assessment By Capacity (Ton)
- Market Opportunity Assessment By Tractor Power (HP)
- Market Opportunity Assessment By Axle
- Australia Agricultural Trailers Top Companies Market Share
- Australia Agricultural Trailers Competitive Benchmarking By Technical and Operational Parameters
- Australia Agricultural Trailers Company Profiles
- Australia Agricultural Trailers Key Strategic Recommendations
Frequently Asked Questions About the Market Study (FAQs):
The primary drivers include the expansion of farm sizes, modernization of farming practices, and increasing demand for high-capacity and versatile trailers.
Key challenges include compliance with safety regulations, logistical issues faced by farmers, and fluctuating investment capabilities due to commodity price changes.
Government investment and regulatory frameworks significantly impact the market by promoting infrastructure development, providing financial incentives, and ensuring compliance with safety and quality standards.
Recent trends include increased investments in trailer technology, a focus on sustainable manufacturing practices, and collaboration with agri-tech companies to incorporate smart features into trailers.
6Wresearch actively monitors the Australia Agricultural Trailers Market and publishes its comprehensive annual report, highlighting emerging trends, growth drivers, revenue analysis, and forecast outlook. Our insights help businesses to make data-backed strategic decisions with ongoing market dynamics. Our analysts track relevent industries related to the Australia Agricultural Trailers Market, allowing our clients with actionable intelligence and reliable forecasts tailored to emerging regional needs.
Yes, we provide customisation as per your requirements. To learn more, feel free to contact us on sales@6wresearch.com
1 Executive Summary |
2 Introduction |
2.1 Key Highlights of the Report |
2.2 Report Description |
2.3 Market Scope & Segmentation |
2.4 Research Methodology |
2.5 Assumptions |
3 Australia Agricultural Trailers Market Overview |
3.1 Australia Country Macro Economic Indicators |
3.2 Australia Agricultural Trailers Market Revenues & Volume, 2022 & 2032F |
3.3 Australia Agricultural Trailers Market - Industry Life Cycle |
3.4 Australia Agricultural Trailers Market - Porter's Five Forces |
3.5 Australia Agricultural Trailers Market Revenues & Volume Share, By Agricultural Tractor Type, 2022 & 2032F |
3.6 Australia Agricultural Trailers Market Revenues & Volume Share, By Product Type, 2022 & 2032F |
3.7 Australia Agricultural Trailers Market Revenues & Volume Share, By Capacity (Ton), 2022 & 2032F |
3.8 Australia Agricultural Trailers Market Revenues & Volume Share, By Tractor Power (HP), 2022 & 2032F |
3.9 Australia Agricultural Trailers Market Revenues & Volume Share, By Axle, 2022 & 2032F |
4 Australia Agricultural Trailers Market Dynamics |
4.1 Impact Analysis |
4.2 Market Drivers |
4.2.1 Increasing mechanization in Australian agriculture sector |
4.2.2 Growing demand for efficient and high-capacity agricultural equipment |
4.2.3 Government initiatives to support agriculture and farming practices |
4.3 Market Restraints |
4.3.1 Fluctuating raw material prices affecting manufacturing costs |
4.3.2 Seasonal variations and weather conditions impacting agricultural activities |
4.3.3 Regulatory challenges related to safety and emissions standards |
5 Australia Agricultural Trailers Market Trends |
6 Australia Agricultural Trailers Market, By Types |
6.1 Australia Agricultural Trailers Market, By Agricultural Tractor Type |
6.1.1 Overview and Analysis |
6.1.2 Australia Agricultural Trailers Market Revenues & Volume, By Agricultural Tractor Type, 2022-2032F |
6.1.3 Australia Agricultural Trailers Market Revenues & Volume, By Utility Tractor Trailer, 2022-2032F |
6.1.4 Australia Agricultural Trailers Market Revenues & Volume, By Orchard Type Tractor Trailer, 2022-2032F |
6.1.5 Australia Agricultural Trailers Market Revenues & Volume, By Garden Tractor Trailer, 2022-2032F |
6.2 Australia Agricultural Trailers Market, By Product Type |
6.2.1 Overview and Analysis |
6.2.2 Australia Agricultural Trailers Market Revenues & Volume, By Tipping Trailer, 2022-2032F |
6.2.3 Australia Agricultural Trailers Market Revenues & Volume, By Non Tipping Trailer, 2022-2032F |
6.2.4 Australia Agricultural Trailers Market Revenues & Volume, By Three way Tipping Trailer, 2022-2032F |
6.3 Australia Agricultural Trailers Market, By Capacity (Ton) |
6.3.1 Overview and Analysis |
6.3.2 Australia Agricultural Trailers Market Revenues & Volume, By Less than 2, 2022-2032F |
6.3.3 Australia Agricultural Trailers Market Revenues & Volume, By 2 to 8, 2022-2032F |
6.3.4 Australia Agricultural Trailers Market Revenues & Volume, By Above 8, 2022-2032F |
6.4 Australia Agricultural Trailers Market, By Tractor Power (HP) |
6.4.1 Overview and Analysis |
6.4.2 Australia Agricultural Trailers Market Revenues & Volume, By Less than 30, 2022-2032F |
6.4.3 Australia Agricultural Trailers Market Revenues & Volume, By 30 to 50, 2022-2032F |
6.4.4 Australia Agricultural Trailers Market Revenues & Volume, By 50 to 70, 2022-2032F |
6.4.5 Australia Agricultural Trailers Market Revenues & Volume, By 70 to 90, 2022-2032F |
6.5 Australia Agricultural Trailers Market, By Axle |
6.5.1 Overview and Analysis |
6.5.2 Australia Agricultural Trailers Market Revenues & Volume, By Single Axle, 2022-2032F |
6.5.3 Australia Agricultural Trailers Market Revenues & Volume, By Double Axle, 2022-2032F |
6.5.4 Australia Agricultural Trailers Market Revenues & Volume, By Multi Axle, 2022-2032F |
7 Australia Agricultural Trailers Market Import-Export Trade Statistics |
7.1 Australia Agricultural Trailers Market Export to Major Countries |
7.2 Australia Agricultural Trailers Market Imports from Major Countries |
8 Australia Agricultural Trailers Market Key Performance Indicators |
8.1 Average age of agricultural trailers in use |
8.2 Adoption rate of precision farming technologies |
8.3 Number of agricultural trailer manufacturers introducing innovative features |
8.4 Utilization rate of agricultural trailers in different regions |
8.5 Percentage of agricultural trailers equipped with smart monitoring systems |
9 Australia Agricultural Trailers Market - Opportunity Assessment |
9.1 Australia Agricultural Trailers Market Opportunity Assessment, By Agricultural Tractor Type, 2022 & 2032F |
9.2 Australia Agricultural Trailers Market Opportunity Assessment, By Product Type, 2022 & 2032F |
9.3 Australia Agricultural Trailers Market Opportunity Assessment, By Capacity (Ton), 2022 & 2032F |
9.4 Australia Agricultural Trailers Market Opportunity Assessment, By Tractor Power (HP), 2022 & 2032F |
9.5 Australia Agricultural Trailers Market Opportunity Assessment, By Axle, 2022 & 2032F |
10 Australia Agricultural Trailers Market - Competitive Landscape |
10.1 Australia Agricultural Trailers Market Revenue Share, By Companies, 2025 |
10.2 Australia Agricultural Trailers Market Competitive Benchmarking, By Operating and Technical Parameters |
11 Company Profiles |
12 Recommendations |
13 Disclaimer |
Global Go To Market Strategy - 2030
Export potential enables firms to identify high-growth global markets with greater confidence by combining advanced trade intelligence with a structured quantitative methodology. The framework analyzes emerging demand trends and country-level import patterns while integrating macroeconomic and trade datasets such as GDP and population forecasts, bilateral import–export flows, tariff structures, elasticity differentials between developed and developing economies, geographic distance, and import demand projections. Using weighted trade values from 2020–2024 as the base period to project country-to-country export potential for 2030, these inputs are operationalized through calculated drivers such as gravity model parameters, tariff impact factors, and projected GDP per-capita growth. Through an analysis of hidden potentials, demand hotspots, and market conditions that are most favorable to success, this method enables firms to focus on target countries, maximize returns, and global expansion with data, backed by accuracy.
By factoring in the projected importer demand gap that is currently unmet and could be potential opportunity, it identifies the potential for the Exporter (Country) among 190 countries, against the general trade analysis, which identifies the biggest importer or exporter.
To discover high-growth global markets and optimize your business strategy:
Click Here
Pricing
- Single User License$ 1,995
- Department License$ 2,400
- Site License$ 3,120
- Global License$ 3,795

Leadership Perspectives from Industry Events
Search
Thought Leadership and Analyst Meet


Our Clients
6WResearch In News
- India Air Conditioner Market Set for Strong Rebound in 2026 After Weather-Led Correction and GST-Driven Recovery: 6Wresearch
- ADAS in India: How Automatic Emergency Braking, Blind Spot Detection & Driver Monitoring are Transforming Road Safety
- Doha a strategic location for EV manufacturing hub: IPA Qatar
- Demand for luxury TVs surging in the GCC, says Samsung
- Empowering Growth: The Thriving Journey of Bangladesh’s Cable Industry
- Demand for luxury TVs surging in the GCC, says Samsung
Latest Reports
- Poland Fire Protection Systems Market (2026-2032)
- Cape Verde Portable Hand-Thrown Extinguisher Market (2026-2032)
- Canada Portable Hand-Thrown Extinguisher Market (2026-2032)
- Cameroon Portable Hand-Thrown Extinguisher Market (2026-2032)
- Burundi Portable Hand-Thrown Extinguisher Market (2026-2032)
- Burkina Faso Portable Hand-Thrown Extinguisher Market (2026-2032)
- Bulgaria Portable Hand-Thrown Extinguisher Market (2026-2032)
- Brunei Portable Hand-Thrown Extinguisher Market (2026-2032)
- Botswana Portable Hand-Thrown Extinguisher Market (2026-2032)
- Bosnia and Herzegovina Portable Hand-Thrown Extinguisher Market (2026-2032)
Industry Events and Analyst Meet

HIMTEX 2026

India Refining Summit 2026

India EV Show 2026

EV tech India Expo 2026

Auto Tech Asia 2026
Whitepaper
- Middle East & Africa Commercial Security Market Click here to view more.
- Middle East & Africa Fire Safety Systems & Equipment Market Click here to view more.
- GCC Drone Market Click here to view more.
- Middle East Lighting Fixture Market Click here to view more.
- GCC Physical & Perimeter Security Market Click here to view more.