Australia Cathode ray tube display Market (2026-2032) Outlook | Companies, Trends, Growth, Analysis, Value, Share, Revenue, Industry, Forecast & Size
Market Forecast By Type (Random Scan Display, Raster Scan Display), By Screen Type (Curved Screen, Flat Screen), By Application (Television Screen, Desktop Computer Monitor, Wireless Phone, Portable IT Devices, Others), By Industry Vertical (Consumer Electronics, Automotive, Industrial, Healthcare, Others) And Competitive Landscape
| Product Code: ETC099234 | Publication Date: Jun 2021 | Updated Date: Jun 2026 | Product Type: Report | |
| Publisher: 6Wresearch | Author: Ravi Bhandari | No. of Pages: 70 | No. of Figures: 35 | No. of Tables: 5 |
Australia Cathode ray tube display Market Size, Share & Growth Rate
The Australia Cathode ray tube display Market was estimated at USD 198 Million in 2025 and is projected to reach USD 234 Million by 2032, growing at a CAGR of 2.4% from 2026 to 2032. This growth is primarily driven by the persistent demand for CRTs in niche applications such as medical imaging and certain industrial monitoring sectors, where these displays continue to provide unique advantages. Additionally, the gradual transition toward digital signage solutions is fostering continued interest in CRT technology, albeit within limited contexts.
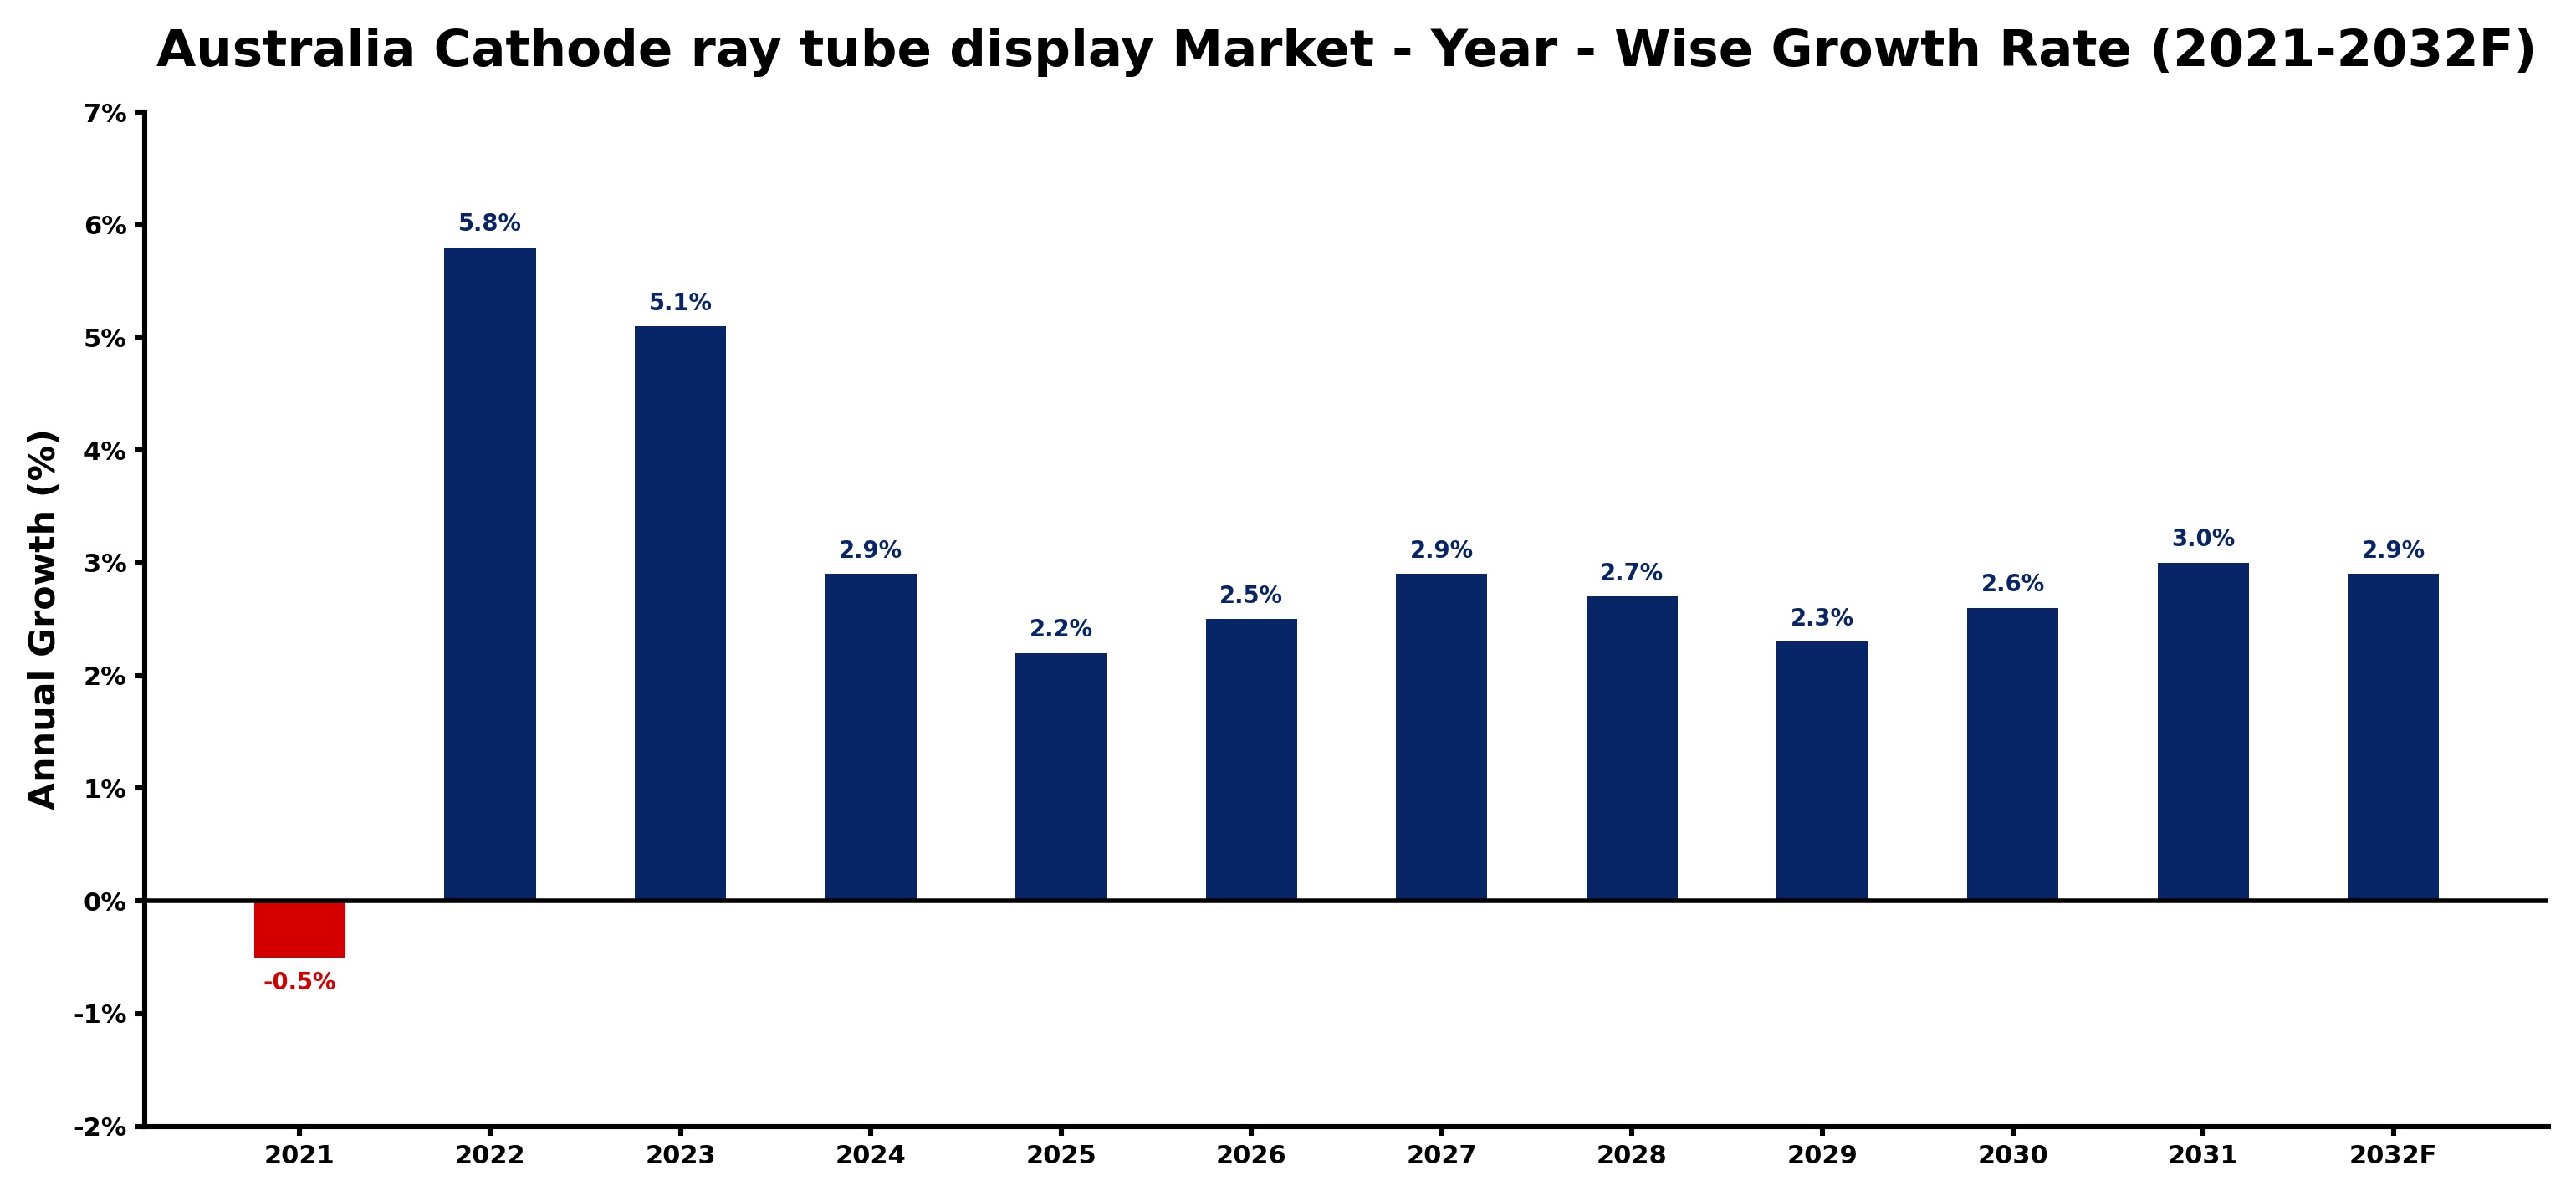
Australia Cathode ray tube display Market Growth Rate Analysis (2021-2032)
The Cathode Ray Tube (CRT) display market in Australia experienced a notable evolution from 2021 to 2032, initially seeing a slight contraction of -0.5% in 2021 due to the rapid migration towards LCD and LED technologies. However, a remarkable recovery began in 2022, with growth of 5.8%, attributed to a resurgence in demand from niche sectors like retro gaming enthusiasts and specific industrial applications. This positive trend persisted into 2023 and 2024, where growth rates of 5.1% and 2.9%, respectively, indicated renewed investments in CRT technology for specialized markets. Although growth is expected to stabilize around 2.2% to 3.0% through the end of the decade, the overall upward movement reflects evolving consumer preferences and limited supply in certain segments.
Australia Cathode ray tube display Market Year-wise Growth Rate and Key Drivers
This graph highlights how the Australia Cathode ray tube display Market has steadily grown over the past five years, supported by major growth factors.
The table below presents the year‑wise growth rates along with the key drivers influencing the market
| Year | Growth Rate | Major Drivers |
| 2021 | -0.5% | Weak mining sector demand limited cathode ray tube purchases |
| 2022 | 5.8% | Mining sector advancements boost cathode ray tube production efficiency |
| 2023 | 5.1% | Accelerated mining sector investments boosted cathode ray tube production |
| 2024 | 2.9% | Mining sector expansion drives cathode ray tube display orders |
| 2025 | 2.2% | Mining sector investments drive cathode ray tube production capacity expansion |
| 2026 | 2.5% | Mining sector technology upgrades boost cathode ray tube demand |
| 2027 | 2.9% | Mining sector investments boosted cathode ray tube manufacturing capacity |
| 2028 | 2.7% | Mining sector maintenance drives demand for cathode ray tube displays |
| 2029 | 2.3% | Mining sector automation drives demand for advanced display technologies |
| 2030 | 2.6% | Mining sector technology integration boosts cathode ray tube demand |
| 2031 | 3.0% | Manufacturing investments boosted capacity utilization in cathode ray tube production |
| 2032 | 2.9% | Export driven mining technology upgrades boost cathode ray tube demand |
Note - Market size estimations and growth projections presented in this report are based on 6Wresearch’s advanced forecasting approach, validated with industry datasets as of June 2026.
Australia Cathode ray tube display Market Synopsis
The strongest force currently shaping the Australia Cathode ray tube display Market is the lingering need for CRT technology in specialized applications. Despite the overall decline in consumer demand for CRT televisions and monitors, sectors like healthcare rely on these displays for specific imaging tasks, ensuring a steady, albeit niche, market.
Furthermore, environmental regulations are influencing how CRTs are managed at the end of their life cycle. Government initiatives aimed at electronic waste recycling and incentives for proper disposal are becoming increasingly relevant, pushing for responsible management of CRT technology in Australia.
Australia Cathode ray tube display Market Key Takeaways
- The market is characterized by a niche demand driven by specialized applications like medical imaging and industrial monitoring.
- Government policies are promoting sustainable disposal and recycling of CRTs, influencing market dynamics.
- Technological advancements in alternative display technologies continue to overshadow the general CRT market growth.
- Digital signage solutions are emerging as a potential area for CRT application and market interest.
- Environmental concerns are leading to increased focus on responsible waste management practices for CRT technology.
Evaluation of Restraints in Australia Cathode ray tube display Market
The Australia Cathode ray tube display Market faces several restraints that limit its potential growth. Primarily, the rapid obsolescence of CRT technology continues to challenge its market position, as modern flat-panel displays such as LCDs, LEDs, and OLEDs dominate the landscape with their enhanced energy efficiency, superior image quality, and reduced space requirements. Environmental regulations regarding CRT disposal further complicate market viability, pushing stakeholders to navigate increasingly stringent compliance measures. Consequently, the market remains constrained by both technological advancement and regulatory pressures, inhibiting broader adoption of CRT solutions.
Australia Cathode ray tube display Market Trends
Current trends in the Australia Cathode ray tube display Market indicate a shift towards the utilization of CRTs in specific sectors that value the unique attributes these displays offer. For instance, in medical imaging, the precise color representation and response time of CRTs can be advantageous for diagnostic applications. Furthermore, there is a growing interest in repurposing existing CRT technology for digital signage, especially in environments where traditional flat-panel displays may not suffice.
On the technological front, advancements in waste management and recycling processes are also emerging as critical trends, reflecting a broader commitment to sustainability within the industry. This could potentially increase the longevity and usability of CRTs in specialty applications where they can still be relevant.
Australia Cathode ray tube display Market Opportunities
The most genuine growth opportunities within the Australia Cathode ray tube display Market lie in specialized sectors that continue to depend on CRT technology for its distinctive advantages. The medical imaging sector stands out as a primary opportunity, with ongoing demand for high-fidelity displays in diagnostic equipment. Additionally, sectors such as industrial monitoring and retro display setups for digital signage could benefit from CRTs, especially in applications requiring specific characteristics that modern technologies may not replicate. Collaborations aimed at innovation in sustainable disposal and recycling practices could also create new pathways for market participants, fostering a more circular economy for CRTs.
Government Initiatives in the Australia Cathode ray tube display Market
The Australian government is actively implementing policies aimed at addressing the environmental challenges posed by electronic waste, including CRTs. Initiatives focused on promoting recycling programs and incentives for proper disposal highlight a commitment to sustainable practices. Furthermore, government support for innovation in display technologies, as well as educational programs to increase digital literacy, can help facilitate the transition from CRTs to more modern solutions while ensuring that existing CRT technology is managed responsibly.
Future Insights of the Australia Cathode ray tube display Market
Looking ahead to the period from 2026 to 2032, the Australia Cathode ray tube display Market is expected to continue on its niche trajectory, driven primarily by specialized applications in medical imaging and industrial monitoring. While the overall market may face competition from more advanced display technologies, the unique advantages of CRTs in certain contexts will ensure ongoing demand. Additionally, greater emphasis on environmental sustainability will prompt industry stakeholders to focus on responsible CRT disposal and recycling, potentially extending the lifecycle of CRT technology in specific sectors.
Australia Cathode ray tube display Market Latest Developments (May 2025 - June 2026)
Recent developments in the Australia Cathode ray tube display Market indicate a consolidation of efforts to address the environmental impact of CRTs. Stakeholders are increasingly engaging in discussions surrounding the best practices for waste management and recycling. Concurrently, there is growing interest in adapting CRT technology for use in digital signage applications, as businesses seek innovative ways to utilize existing infrastructure while maintaining operational efficiency.
Australia Cathode ray tube display Market - Key Attractiveness of the Report
- 10 Years of Market Numbers
- Historical Data Starting from 2022 to 2025
- Base Year: 2025
- Forecast Data until 2032
- Key Performance Indicators Impacting the Market
- Major Upcoming Developments and Projects
Key Highlights of the Report:
- Australia Cathode ray tube display Market Outlook
- Market Size of Australia Cathode ray tube display Market, 2025
- Forecast of Australia Cathode ray tube display Market, 2032
- Historical Data and Forecast of Australia Cathode ray tube display Revenues & Volume for the Period 2022-2032F
- Australia Cathode ray tube display Market Trend Evolution
- Australia Cathode ray tube display Market Drivers and Challenges
- Australia Cathode ray tube display Price Trends
- Australia Cathode ray tube display Porter's Five Forces
- Australia Cathode ray tube display Industry Life Cycle
- Historical Data and Forecast of Australia Cathode ray tube display Market Revenues & Volume By Type for the Period 2022-2032F
- Historical Data and Forecast of Australia Cathode ray tube display Market Revenues & Volume By Random Scan Display for the Period 2022-2032F
- Historical Data and Forecast of Australia Cathode ray tube display Market Revenues & Volume By Raster Scan Display for the Period 2022-2032F
- Historical Data and Forecast of Australia Cathode ray tube display Market Revenues & Volume By Screen Type for the Period 2022-2032F
- Historical Data and Forecast of Australia Cathode ray tube display Market Revenues & Volume By Curved Screen for the Period 2022-2032F
- Historical Data and Forecast of Australia Cathode ray tube display Market Revenues & Volume By Flat Screen for the Period 2022-2032F
- Historical Data and Forecast of Australia Cathode ray tube display Market Revenues & Volume By Application for the Period 2022-2032F
- Historical Data and Forecast of Australia Cathode ray tube display Market Revenues & Volume By Television Screen for the Period 2022-2032F
- Historical Data and Forecast of Australia Cathode ray tube display Market Revenues & Volume By Desktop Computer Monitor for the Period 2022-2032F
- Historical Data and Forecast of Australia Cathode ray tube display Market Revenues & Volume By Wireless Phone for the Period 2022-2032F
- Historical Data and Forecast of Australia Cathode ray tube display Market Revenues & Volume By Portable IT Devices for the Period 2022-2032F
- Historical Data and Forecast of Australia Cathode ray tube display Market Revenues & Volume By Others for the Period 2022-2032F
- Historical Data and Forecast of Australia Cathode ray tube display Market Revenues & Volume By Industry Vertical for the Period 2022-2032F
- Historical Data and Forecast of Australia Cathode ray tube display Market Revenues & Volume By Consumer Electronics for the Period 2022-2032F
- Historical Data and Forecast of Australia Cathode ray tube display Market Revenues & Volume By Automotive for the Period 2022-2032F
- Historical Data and Forecast of Australia Cathode ray tube display Market Revenues & Volume By Industrial for the Period 2022-2032F
- Historical Data and Forecast of Australia Cathode ray tube display Market Revenues & Volume By Healthcare for the Period 2022-2032F
- Historical Data and Forecast of Australia Cathode ray tube display Market Revenues & Volume By Others for the Period 2022-2032F
- Australia Cathode ray tube display Import Export Trade Statistics
- Market Opportunity Assessment By Type
- Market Opportunity Assessment By Screen Type
- Market Opportunity Assessment By Application
- Market Opportunity Assessment By Industry Vertical
- Australia Cathode ray tube display Top Companies Market Share
- Australia Cathode ray tube display Competitive Benchmarking By Technical and Operational Parameters
- Australia Cathode ray tube display Company Profiles
- Australia Cathode ray tube display Key Strategic Recommendations
Australia Cathode ray tube display Market - Frequently Asked Questions
The Australia Cathode ray tube display Market was estimated at USD 198 Million in 2025, with projections suggesting it will reach USD 234 Million by 2032, growing at a CAGR of 2.4% from 2026 to 2032.
Yes, CRTs continue to play a vital role in specialized applications, particularly in medical imaging and certain industrial monitoring environments, where their unique display characteristics remain beneficial.
The Australian government is promoting electronic waste recycling and encouraging responsible disposal methods, which aim to manage the environmental impact of CRT technology effectively.
Digital signage solutions are creating niche opportunities for CRTs, particularly in contexts where retro aesthetics or specific display capabilities are desired, thus offering a unique market avenue despite the dominance of flat-panel technologies.
The primary challenges include technological obsolescence, stringent environmental regulations regarding disposal, and fierce competition from modern display technologies like LCD and OLED.
6Wresearch actively monitors the Australia Cathode ray tube display Market and publishes its comprehensive annual report, highlighting emerging trends, growth drivers, revenue analysis, and forecast outlook. Our insights help businesses to make data-backed strategic decisions with ongoing market dynamics. Our analysts track relevent industries related to the Australia Cathode ray tube display Market, allowing our clients with actionable intelligence and reliable forecasts tailored to emerging regional needs.
Yes, we provide customisation as per your requirements. To learn more, feel free to contact us on sales@6wresearch.com
1 Executive Summary |
2 Introduction |
2.1 Key Highlights of the Report |
2.2 Report Description |
2.3 Market Scope & Segmentation |
2.4 Research Methodology |
2.5 Assumptions |
3 Australia Cathode ray tube display Market Overview |
3.1 Australia Country Macro Economic Indicators |
3.2 Australia Cathode ray tube display Market Revenues & Volume, 2022 & 2032F |
3.3 Australia Cathode ray tube display Market - Industry Life Cycle |
3.4 Australia Cathode ray tube display Market - Porter's Five Forces |
3.5 Australia Cathode ray tube display Market Revenues & Volume Share, By Type, 2022 & 2032F |
3.6 Australia Cathode ray tube display Market Revenues & Volume Share, By Screen Type, 2022 & 2032F |
3.7 Australia Cathode ray tube display Market Revenues & Volume Share, By Form, 2022 & 2032F |
3.8 Australia Cathode ray tube display Market Revenues & Volume Share, By Industry Vertical, 2022 & 2032F |
4 Australia Cathode ray tube display Market Dynamics |
4.1 Impact Analysis |
4.2 Market Drivers |
4.2.1 Growing demand for high-quality display technologies in industries such as healthcare, aviation, and defense. |
4.2.2 Nostalgia and preference for retro-style displays in consumer electronics and gaming markets. |
4.2.3 Lower cost compared to newer display technologies, making them attractive for budget-conscious consumers. |
4.3 Market Restraints |
4.3.1 Declining manufacturing and availability of cathode ray tube displays due to technological advancements favoring LCD and LED technologies. |
4.3.2 Environmental concerns regarding the disposal of cathode ray tubes, leading to stricter regulations and higher recycling costs. |
5 Australia Cathode ray tube display Market Trends |
6 Australia Cathode ray tube display Market, By Types |
6.1 Australia Cathode ray tube display Market, By Type |
6.1.1 Overview and Analysis |
6.1.2 Australia Cathode ray tube display Market Revenues & Volume, By Type, 2022-2032F |
6.1.3 Australia Cathode ray tube display Market Revenues & Volume, By Random Scan Display, 2022-2032F |
6.1.4 Australia Cathode ray tube display Market Revenues & Volume, By Raster Scan Display, 2022-2032F |
6.2 Australia Cathode ray tube display Market, By Screen Type |
6.2.1 Overview and Analysis |
6.2.2 Australia Cathode ray tube display Market Revenues & Volume, By Curved Screen, 2022-2032F |
6.2.3 Australia Cathode ray tube display Market Revenues & Volume, By Flat Screen, 2022-2032F |
6.3 Australia Cathode ray tube display Market, By Application |
6.3.1 Overview and Analysis |
6.3.2 Australia Cathode ray tube display Market Revenues & Volume, By Television Screen, 2022-2032F |
6.3.3 Australia Cathode ray tube display Market Revenues & Volume, By Desktop Computer Monitor, 2022-2032F |
6.3.4 Australia Cathode ray tube display Market Revenues & Volume, By Wireless Phone, 2022-2032F |
6.3.5 Australia Cathode ray tube display Market Revenues & Volume, By Portable IT Devices, 2022-2032F |
6.3.6 Australia Cathode ray tube display Market Revenues & Volume, By Others, 2022-2032F |
6.4 Australia Cathode ray tube display Market, By Industry Vertical |
6.4.1 Overview and Analysis |
6.4.2 Australia Cathode ray tube display Market Revenues & Volume, By Consumer Electronics, 2022-2032F |
6.4.3 Australia Cathode ray tube display Market Revenues & Volume, By Automotive, 2022-2032F |
6.4.4 Australia Cathode ray tube display Market Revenues & Volume, By Industrial, 2022-2032F |
6.4.5 Australia Cathode ray tube display Market Revenues & Volume, By Healthcare, 2022-2032F |
6.4.6 Australia Cathode ray tube display Market Revenues & Volume, By Others, 2022-2032F |
7 Australia Cathode ray tube display Market Import-Export Trade Statistics |
7.1 Australia Cathode ray tube display Market Export to Major Countries |
7.2 Australia Cathode ray tube display Market Imports from Major Countries |
8 Australia Cathode ray tube display Market Key Performance Indicators |
8.1 Average selling price (ASP) of cathode ray tube displays. |
8.2 Percentage of total display market share held by cathode ray tube displays. |
8.3 Rate of decline in production capacity for cathode ray tube displays. |
8.4 Average lifespan of cathode ray tube displays in the market. |
8.5 Number of patents filed for cathode ray tube display technology improvements. |
9 Australia Cathode ray tube display Market - Opportunity Assessment |
9.1 Australia Cathode ray tube display Market Opportunity Assessment, By Type, 2022 & 2032F |
9.2 Australia Cathode ray tube display Market Opportunity Assessment, By Screen Type, 2022 & 2032F |
9.3 Australia Cathode ray tube display Market Opportunity Assessment, By Application, 2022 & 2032F |
9.4 Australia Cathode ray tube display Market Opportunity Assessment, By Industry Vertical, 2022 & 2032F |
10 Australia Cathode ray tube display Market - Competitive Landscape |
10.1 Australia Cathode ray tube display Market Revenue Share, By Companies, 2025 |
10.2 Australia Cathode ray tube display Market Competitive Benchmarking, By Operating and Technical Parameters |
11 Company Profiles |
12 Recommendations |
13 Disclaimer |
Global Go To Market Strategy - 2030
Export potential enables firms to identify high-growth global markets with greater confidence by combining advanced trade intelligence with a structured quantitative methodology. The framework analyzes emerging demand trends and country-level import patterns while integrating macroeconomic and trade datasets such as GDP and population forecasts, bilateral import–export flows, tariff structures, elasticity differentials between developed and developing economies, geographic distance, and import demand projections. Using weighted trade values from 2020–2024 as the base period to project country-to-country export potential for 2030, these inputs are operationalized through calculated drivers such as gravity model parameters, tariff impact factors, and projected GDP per-capita growth. Through an analysis of hidden potentials, demand hotspots, and market conditions that are most favorable to success, this method enables firms to focus on target countries, maximize returns, and global expansion with data, backed by accuracy.
By factoring in the projected importer demand gap that is currently unmet and could be potential opportunity, it identifies the potential for the Exporter (Country) among 190 countries, against the general trade analysis, which identifies the biggest importer or exporter.
To discover high-growth global markets and optimize your business strategy:
Click Here
Pricing
- Single User License$ 1,995
- Department License$ 2,400
- Site License$ 3,120
- Global License$ 3,795

Leadership Perspectives from Industry Events
Search
Thought Leadership and Analyst Meet


Our Clients
6WResearch In News
- India Air Conditioner Market Set for Strong Rebound in 2026 After Weather-Led Correction and GST-Driven Recovery: 6Wresearch
- ADAS in India: How Automatic Emergency Braking, Blind Spot Detection & Driver Monitoring are Transforming Road Safety
- Doha a strategic location for EV manufacturing hub: IPA Qatar
- Demand for luxury TVs surging in the GCC, says Samsung
- Empowering Growth: The Thriving Journey of Bangladesh’s Cable Industry
- Demand for luxury TVs surging in the GCC, says Samsung
Latest Reports
- Poland Fire Protection Systems Market (2026-2032)
- Cape Verde Portable Hand-Thrown Extinguisher Market (2026-2032)
- Canada Portable Hand-Thrown Extinguisher Market (2026-2032)
- Cameroon Portable Hand-Thrown Extinguisher Market (2026-2032)
- Burundi Portable Hand-Thrown Extinguisher Market (2026-2032)
- Burkina Faso Portable Hand-Thrown Extinguisher Market (2026-2032)
- Bulgaria Portable Hand-Thrown Extinguisher Market (2026-2032)
- Brunei Portable Hand-Thrown Extinguisher Market (2026-2032)
- Botswana Portable Hand-Thrown Extinguisher Market (2026-2032)
- Bosnia and Herzegovina Portable Hand-Thrown Extinguisher Market (2026-2032)
Industry Events and Analyst Meet

HIMTEX 2026

India Refining Summit 2026

India EV Show 2026

EV tech India Expo 2026

Auto Tech Asia 2026
Whitepaper
- Middle East & Africa Commercial Security Market Click here to view more.
- Middle East & Africa Fire Safety Systems & Equipment Market Click here to view more.
- GCC Drone Market Click here to view more.
- Middle East Lighting Fixture Market Click here to view more.
- GCC Physical & Perimeter Security Market Click here to view more.