Australia Chalk Marker Market (2026-2032) Outlook | Trends, Companies, Analysis, Industry, Share, Value, Forecast, Growth, Revenue & Size
Market Forecast By Types (Bullet Nib, Chisel Nib), By Applications (Dark Board, Glass, Mirror, Metal, Plastic, Others) And Competitive Landscape
| Product Code: ETC251195 | Publication Date: Aug 2022 | Updated Date: Mar 2026 | Product Type: Market Research Report | |
| Publisher: 6Wresearch | Author: Ravi Bhandari | No. of Pages: 75 | No. of Figures: 35 | No. of Tables: 20 |
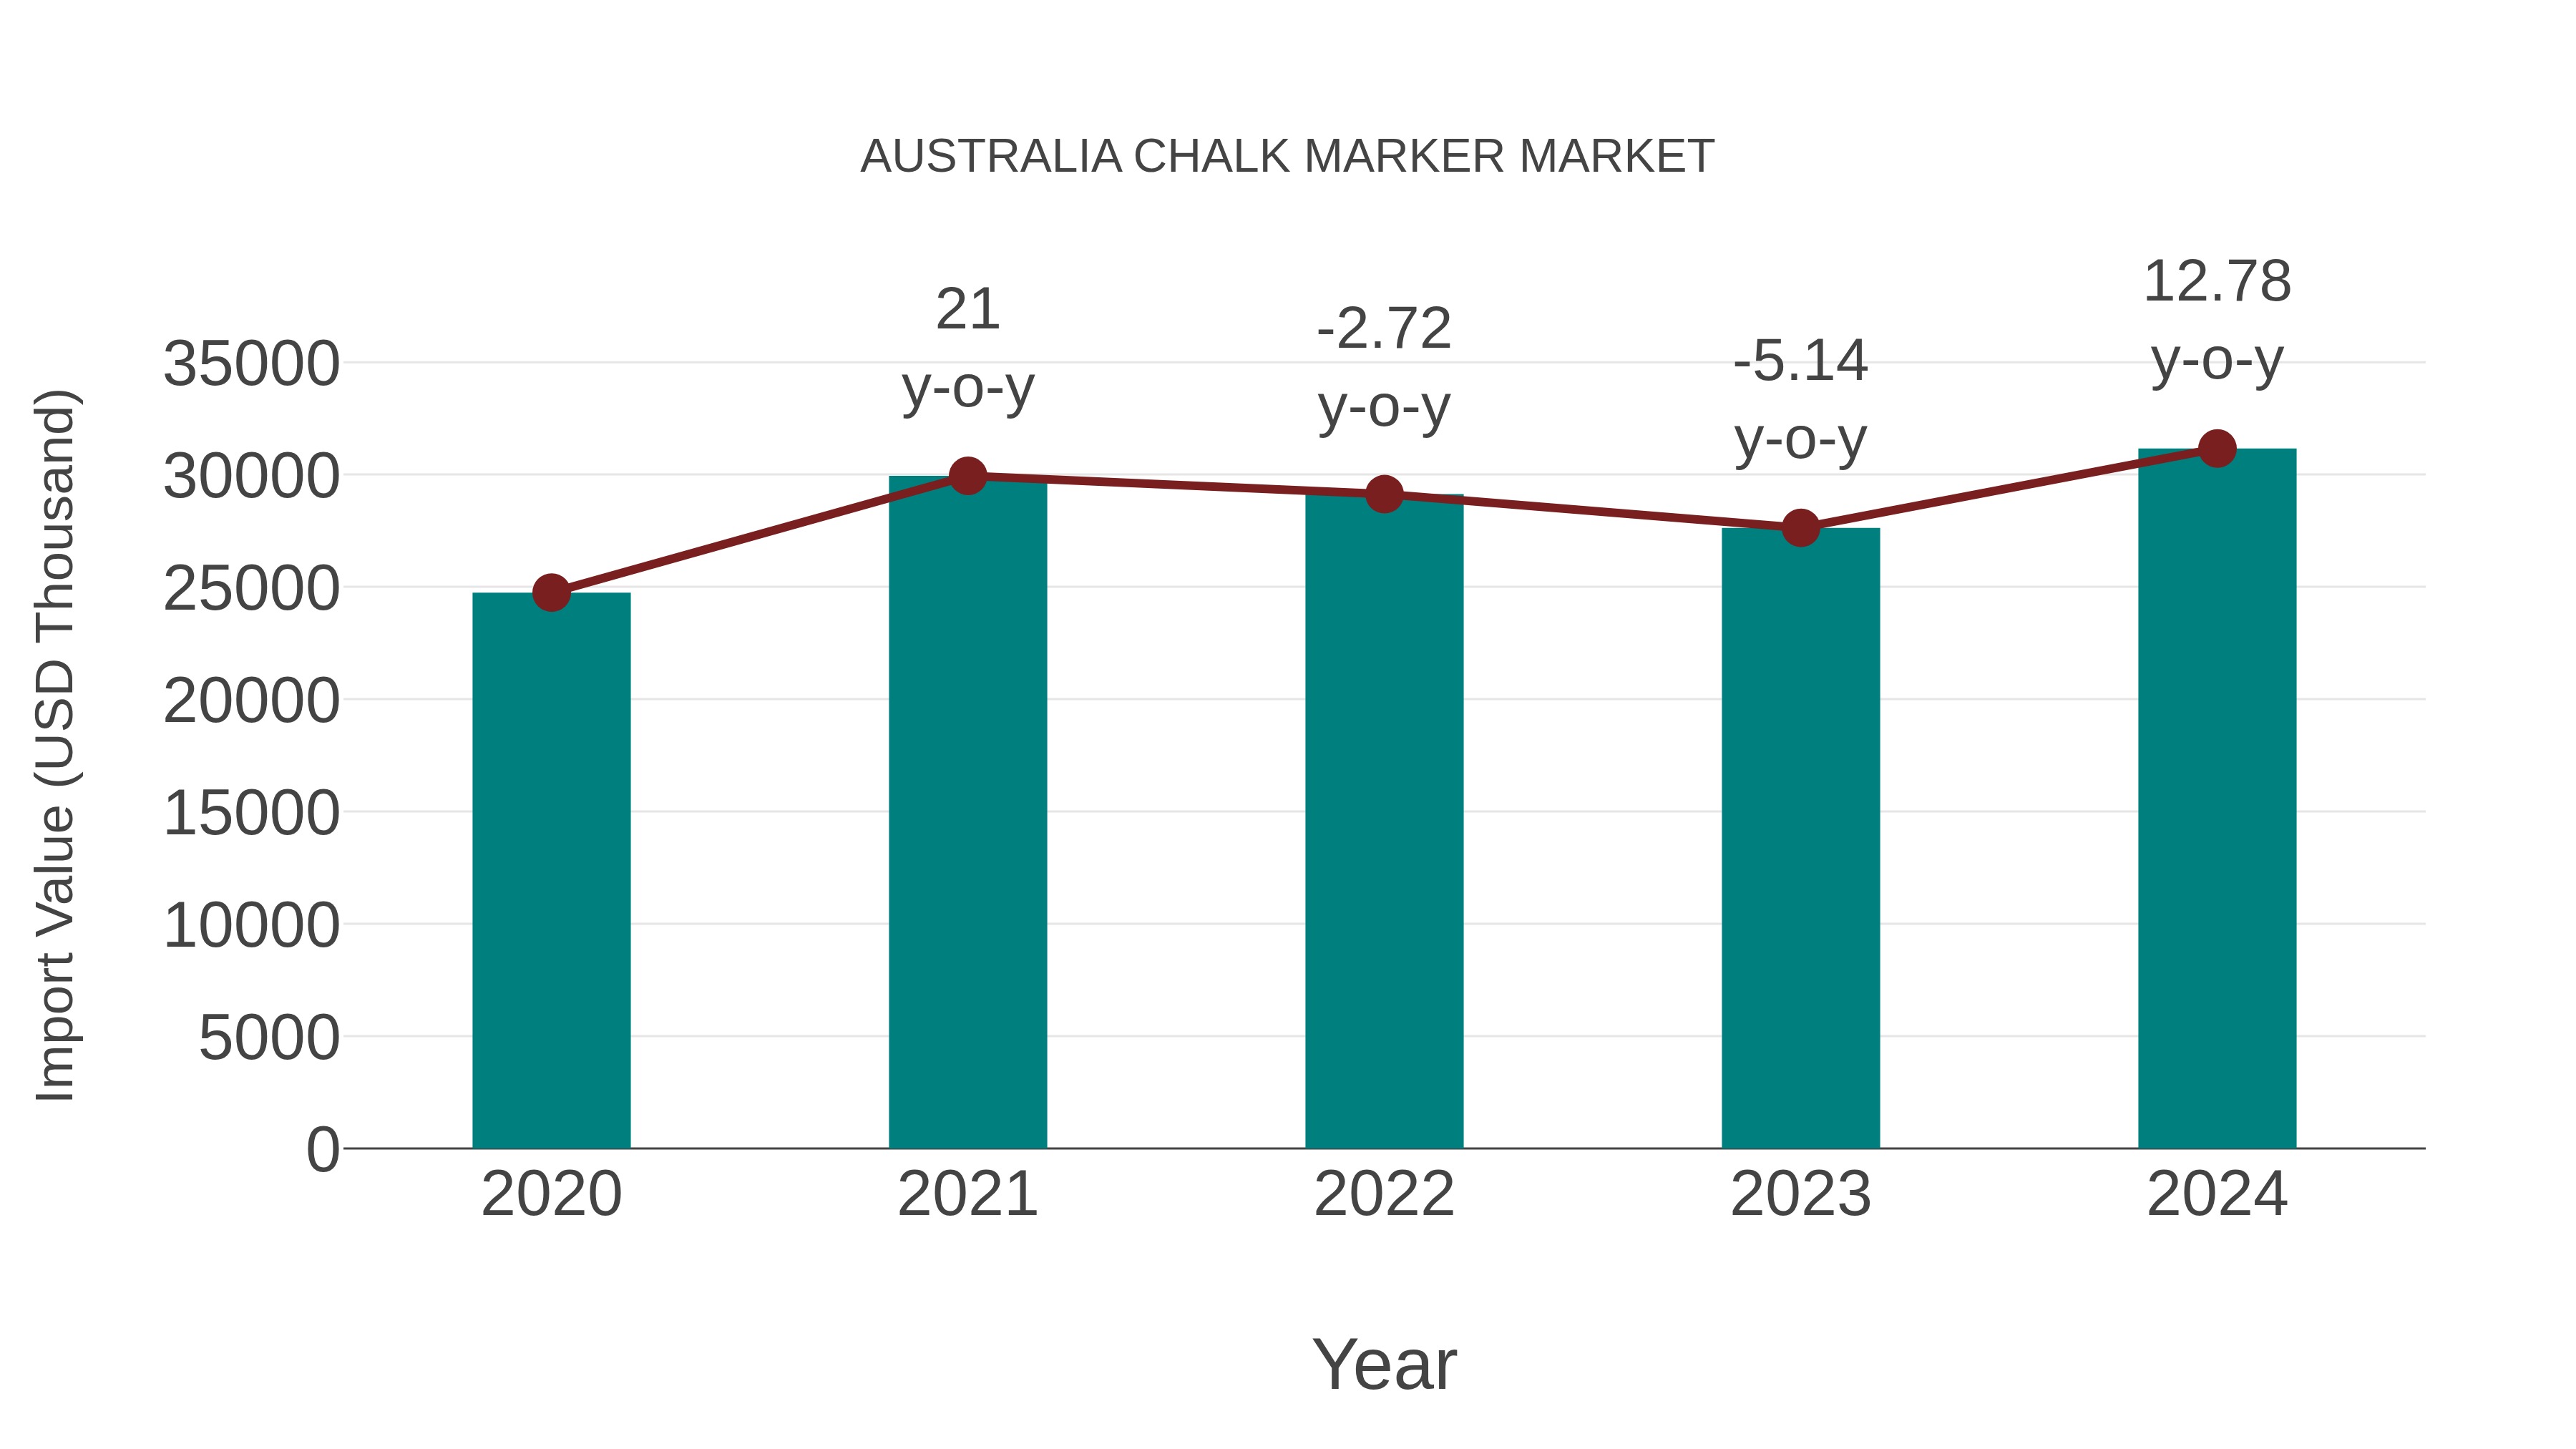
Australia Chalk Marker Market: Import Trend Analysis
Australia`s import trend for chalk markers experienced a notable growth rate of 12.78% from 2023 to 2024, with a compound annual growth rate (CAGR) of 5.93% for the period 2020-2024. This increase in imports can be attributed to the rising demand for creative art supplies in the Australian market.
Australia Chalk Marker Market Overview
Australia chalk marker market is witnessing growth, driven by the demand from education, retail, and hospitality sectors for versatile and vibrant marking solutions. Chalk markers offer advantages such as ease of use, erasability, and compatibility with various surfaces, driving their adoption in signage, menu boards, and creative projects.
Drivers of the market
The Australia Chalk Marker Market is driven by factors such as the demand for writing and drawing instruments, the popularity of chalkboard surfaces in cafes, restaurants, and classrooms, and the properties of chalk markers such as vivid colors, ease of use, and erasability. Chalk markers, equipped with liquid chalk ink, are used for creating vibrant and temporary designs on chalkboards, glass, and other non-porous surfaces. With the growing trend towards DIY crafts, signage, and creative expression, the market for chalk markers is witnessing growth in Australia.
Challenges of the market
Challenges in the Australia chalk marker market include optimizing ink formulations for vibrant and long-lasting colors, ensuring compatibility with different writing surfaces, and addressing sustainability concerns related to packaging and waste management.
Government Policy of the market
The chalk marker market in Australia faces challenges such as competition from alternative writing instruments, fluctuating demand from educational institutions and businesses, and changing consumer preferences for digital solutions. Government initiatives may involve promoting the versatility and eco-friendliness of chalk markers, encouraging their use in educational settings, and supporting local manufacturers through export promotion and marketing campaigns. These efforts can address challenges and stimulate growth in the chalk marker market, ensuring their continued relevance in various applications such as signage, art, and education.
Key Highlights of the Report:
- Australia Chalk Marker Market Outlook
- Market Size of Australia Chalk Marker Market, 2025
- Forecast of Australia Chalk Marker Market, 2032
- Historical Data and Forecast of Australia Chalk Marker Revenues & Volume for the Period 2022-2032F
- Australia Chalk Marker Market Trend Evolution
- Australia Chalk Marker Market Drivers and Challenges
- Australia Chalk Marker Price Trends
- Australia Chalk Marker Porter's Five Forces
- Australia Chalk Marker Industry Life Cycle
- Historical Data and Forecast of Australia Chalk Marker Market Revenues & Volume By Types for the Period 2022-2032F
- Historical Data and Forecast of Australia Chalk Marker Market Revenues & Volume By Bullet Nib for the Period 2022-2032F
- Historical Data and Forecast of Australia Chalk Marker Market Revenues & Volume By Chisel Nib for the Period 2022-2032F
- Historical Data and Forecast of Australia Chalk Marker Market Revenues & Volume By Applications for the Period 2022-2032F
- Historical Data and Forecast of Australia Chalk Marker Market Revenues & Volume By Dark Board for the Period 2022-2032F
- Historical Data and Forecast of Australia Chalk Marker Market Revenues & Volume By Glass for the Period 2022-2032F
- Historical Data and Forecast of Australia Chalk Marker Market Revenues & Volume By Mirror for the Period 2022-2032F
- Historical Data and Forecast of Australia Chalk Marker Market Revenues & Volume By Metal for the Period 2022-2032F
- Historical Data and Forecast of Australia Chalk Marker Market Revenues & Volume By Plastic for the Period 2022-2032F
- Historical Data and Forecast of Australia Chalk Marker Market Revenues & Volume By Others for the Period 2022-2032F
- Australia Chalk Marker Import Export Trade Statistics
- Market Opportunity Assessment By Types
- Market Opportunity Assessment By Applications
- Australia Chalk Marker Top Companies Market Share
- Australia Chalk Marker Competitive Benchmarking By Technical and Operational Parameters
- Australia Chalk Marker Company Profiles
- Australia Chalk Marker Key Strategic Recommendations
Australia Chalk Marker Market (2026-2032): FAQs
6Wresearch actively monitors the Australia Chalk Marker Market and publishes its comprehensive annual report, highlighting emerging trends, growth drivers, revenue analysis, and forecast outlook. Our insights help businesses to make data-backed strategic decisions with ongoing market dynamics. Our analysts track relevent industries related to the Australia Chalk Marker Market, allowing our clients with actionable intelligence and reliable forecasts tailored to emerging regional needs.
Yes, we provide customisation as per your requirements. To learn more, feel free to contact us on sales@6wresearch.com
1 Executive Summary |
2 Introduction |
2.1 Key Highlights of the Report |
2.2 Report Description |
2.3 Market Scope & Segmentation |
2.4 Research Methodology |
2.5 Assumptions |
3 Australia Chalk Marker Market Overview |
3.1 Australia Country Macro Economic Indicators |
3.2 Australia Chalk Marker Market Revenues & Volume, 2022 & 2032F |
3.3 Australia Chalk Marker Market - Industry Life Cycle |
3.4 Australia Chalk Marker Market - Porter's Five Forces |
3.5 Australia Chalk Marker Market Revenues & Volume Share, By Types, 2022 & 2032F |
3.6 Australia Chalk Marker Market Revenues & Volume Share, By Applications, 2022 & 2032F |
4 Australia Chalk Marker Market Dynamics |
4.1 Impact Analysis |
4.2 Market Drivers |
4.2.1 Increasing demand for creative and innovative teaching tools in educational institutions |
4.2.2 Growing popularity of DIY and crafting activities among consumers |
4.2.3 Rising demand for non-toxic and eco-friendly art supplies |
4.3 Market Restraints |
4.3.1 Fluctuating raw material prices affecting production costs |
4.3.2 Intense competition from other writing and drawing instruments |
4.3.3 Limited awareness and availability of chalk markers in certain regions |
5 Australia Chalk Marker Market Trends |
6 Australia Chalk Marker Market, By Types |
6.1 Australia Chalk Marker Market, By Types |
6.1.1 Overview and Analysis |
6.1.2 Australia Chalk Marker Market Revenues & Volume, By Types, 2022-2032F |
6.1.3 Australia Chalk Marker Market Revenues & Volume, By Bullet Nib, 2022-2032F |
6.1.4 Australia Chalk Marker Market Revenues & Volume, By Chisel Nib, 2022-2032F |
6.2 Australia Chalk Marker Market, By Applications |
6.2.1 Overview and Analysis |
6.2.2 Australia Chalk Marker Market Revenues & Volume, By Dark Board, 2022-2032F |
6.2.3 Australia Chalk Marker Market Revenues & Volume, By Glass, 2022-2032F |
6.2.4 Australia Chalk Marker Market Revenues & Volume, By Mirror, 2022-2032F |
6.2.5 Australia Chalk Marker Market Revenues & Volume, By Metal, 2022-2032F |
6.2.6 Australia Chalk Marker Market Revenues & Volume, By Plastic, 2022-2032F |
6.2.7 Australia Chalk Marker Market Revenues & Volume, By Others, 2022-2032F |
7 Australia Chalk Marker Market Import-Export Trade Statistics |
7.1 Australia Chalk Marker Market Export to Major Countries |
7.2 Australia Chalk Marker Market Imports from Major Countries |
8 Australia Chalk Marker Market Key Performance Indicators |
8.1 Number of educational institutions adopting chalk markers for teaching purposes |
8.2 Growth in online searches for DIY and crafting projects involving chalk markers |
8.3 Percentage of consumers opting for environmentally friendly art supplies |
8.4 Innovation rate in chalk marker technology |
8.5 Number of collaborations with influencers and artists to promote chalk markers |
9 Australia Chalk Marker Market - Opportunity Assessment |
9.1 Australia Chalk Marker Market Opportunity Assessment, By Types, 2022 & 2032F |
9.2 Australia Chalk Marker Market Opportunity Assessment, By Applications, 2022 & 2032F |
10 Australia Chalk Marker Market - Competitive Landscape |
10.1 Australia Chalk Marker Market Revenue Share, By Companies, 2025 |
10.2 Australia Chalk Marker Market Competitive Benchmarking, By Operating and Technical Parameters |
11 Company Profiles |
12 Recommendations |
13 Disclaimer |
Global Go To Market Strategy - 2030
Export potential enables firms to identify high-growth global markets with greater confidence by combining advanced trade intelligence with a structured quantitative methodology. The framework analyzes emerging demand trends and country-level import patterns while integrating macroeconomic and trade datasets such as GDP and population forecasts, bilateral import–export flows, tariff structures, elasticity differentials between developed and developing economies, geographic distance, and import demand projections. Using weighted trade values from 2020–2024 as the base period to project country-to-country export potential for 2030, these inputs are operationalized through calculated drivers such as gravity model parameters, tariff impact factors, and projected GDP per-capita growth. Through an analysis of hidden potentials, demand hotspots, and market conditions that are most favorable to success, this method enables firms to focus on target countries, maximize returns, and global expansion with data, backed by accuracy.
By factoring in the projected importer demand gap that is currently unmet and could be potential opportunity, it identifies the potential for the Exporter (Country) among 190 countries, against the general trade analysis, which identifies the biggest importer or exporter.
To discover high-growth global markets and optimize your business strategy:
Click Here
Pricing
- Single User License$ 1,995
- Department License$ 2,400
- Site License$ 3,120
- Global License$ 3,795

Leadership Perspectives from Industry Events
Search
Thought Leadership and Analyst Meet


Our Clients
6WResearch In News
- India Air Conditioner Market Set for Strong Rebound in 2026 After Weather-Led Correction and GST-Driven Recovery: 6Wresearch
- ADAS in India: How Automatic Emergency Braking, Blind Spot Detection & Driver Monitoring are Transforming Road Safety
- Doha a strategic location for EV manufacturing hub: IPA Qatar
- Demand for luxury TVs surging in the GCC, says Samsung
- Empowering Growth: The Thriving Journey of Bangladesh’s Cable Industry
- Demand for luxury TVs surging in the GCC, says Samsung
Latest Reports
- Poland Fire Protection Systems Market (2026-2032)
- Cape Verde Portable Hand-Thrown Extinguisher Market (2026-2032)
- Canada Portable Hand-Thrown Extinguisher Market (2026-2032)
- Cameroon Portable Hand-Thrown Extinguisher Market (2026-2032)
- Burundi Portable Hand-Thrown Extinguisher Market (2026-2032)
- Burkina Faso Portable Hand-Thrown Extinguisher Market (2026-2032)
- Bulgaria Portable Hand-Thrown Extinguisher Market (2026-2032)
- Brunei Portable Hand-Thrown Extinguisher Market (2026-2032)
- Botswana Portable Hand-Thrown Extinguisher Market (2026-2032)
- Bosnia and Herzegovina Portable Hand-Thrown Extinguisher Market (2026-2032)
Industry Events and Analyst Meet

HIMTEX 2026

India Refining Summit 2026

India EV Show 2026

EV tech India Expo 2026

Auto Tech Asia 2026
Whitepaper
- Middle East & Africa Commercial Security Market Click here to view more.
- Middle East & Africa Fire Safety Systems & Equipment Market Click here to view more.
- GCC Drone Market Click here to view more.
- Middle East Lighting Fixture Market Click here to view more.
- GCC Physical & Perimeter Security Market Click here to view more.