Australia Clamps Market (2026-2032) | Forecast, Analysis, Outlook, Value, Size, Industry, Revenue, Growth, Trends, Share & Companies
Market Forecast By Type (Aortic cross-clamp, Bulldogs Forceps, Needle Holder, Aortic cross-clamp, Others), By End-use (Hospitals, Ambulatory Surgical Centers, Research organizations) And Competitive Landscape
| Product Code: ETC050535 | Publication Date: Jan 2021 | Updated Date: Jun 2026 | Product Type: Report | |
| Publisher: 6Wresearch | Author: Ravi Bhandari | No. of Pages: 70 | No. of Figures: 35 | No. of Tables: 5 |
Australia Clamps Market Size, Share & Growth Rate
The Australia Clamps Market was estimated at USD 185 Million in 2025 and is projected to reach USD 217 Million by 2032, growing at a CAGR of 2.3% from 2026 to 2032. This growth trajectory is primarily driven by the robust expansion of construction activities and ongoing infrastructure projects across Australia. The increasing trend towards DIY home improvement initiatives further fuels demand, reflecting a broader societal shift towards personalized and hands-on craftsmanship.
Australia Clamps Market Growth Rate Analysis (2021-2032)
The Australian clamps market has shown notable volatility in recent years, with a decline of 0.6% in 2021, primarily due to pandemic-related disruptions. However, a robust recovery began in 2022, marked by a significant growth of 5.5%, as construction activity surged and infrastructure projects gained momentum. This upward trend continued into 2023 with a growth of 5.1%, driven by heightened consumer demand and investments in industrial automation. Looking ahead, modest growth rates are anticipated, with projections around 2.5% for 2024 and 2025, reflecting a stabilization of the market. Factors such as the ongoing energy transition and advancements in manufacturing technology are expected to sustain demand, supporting a steady yet gradual expansion through 2032.
Australia Clamps Market Year-wise Growth Rate and Key Drivers
This graph highlights how the Australia Clamps Market has steadily grown over the past five years, supported by major growth factors.
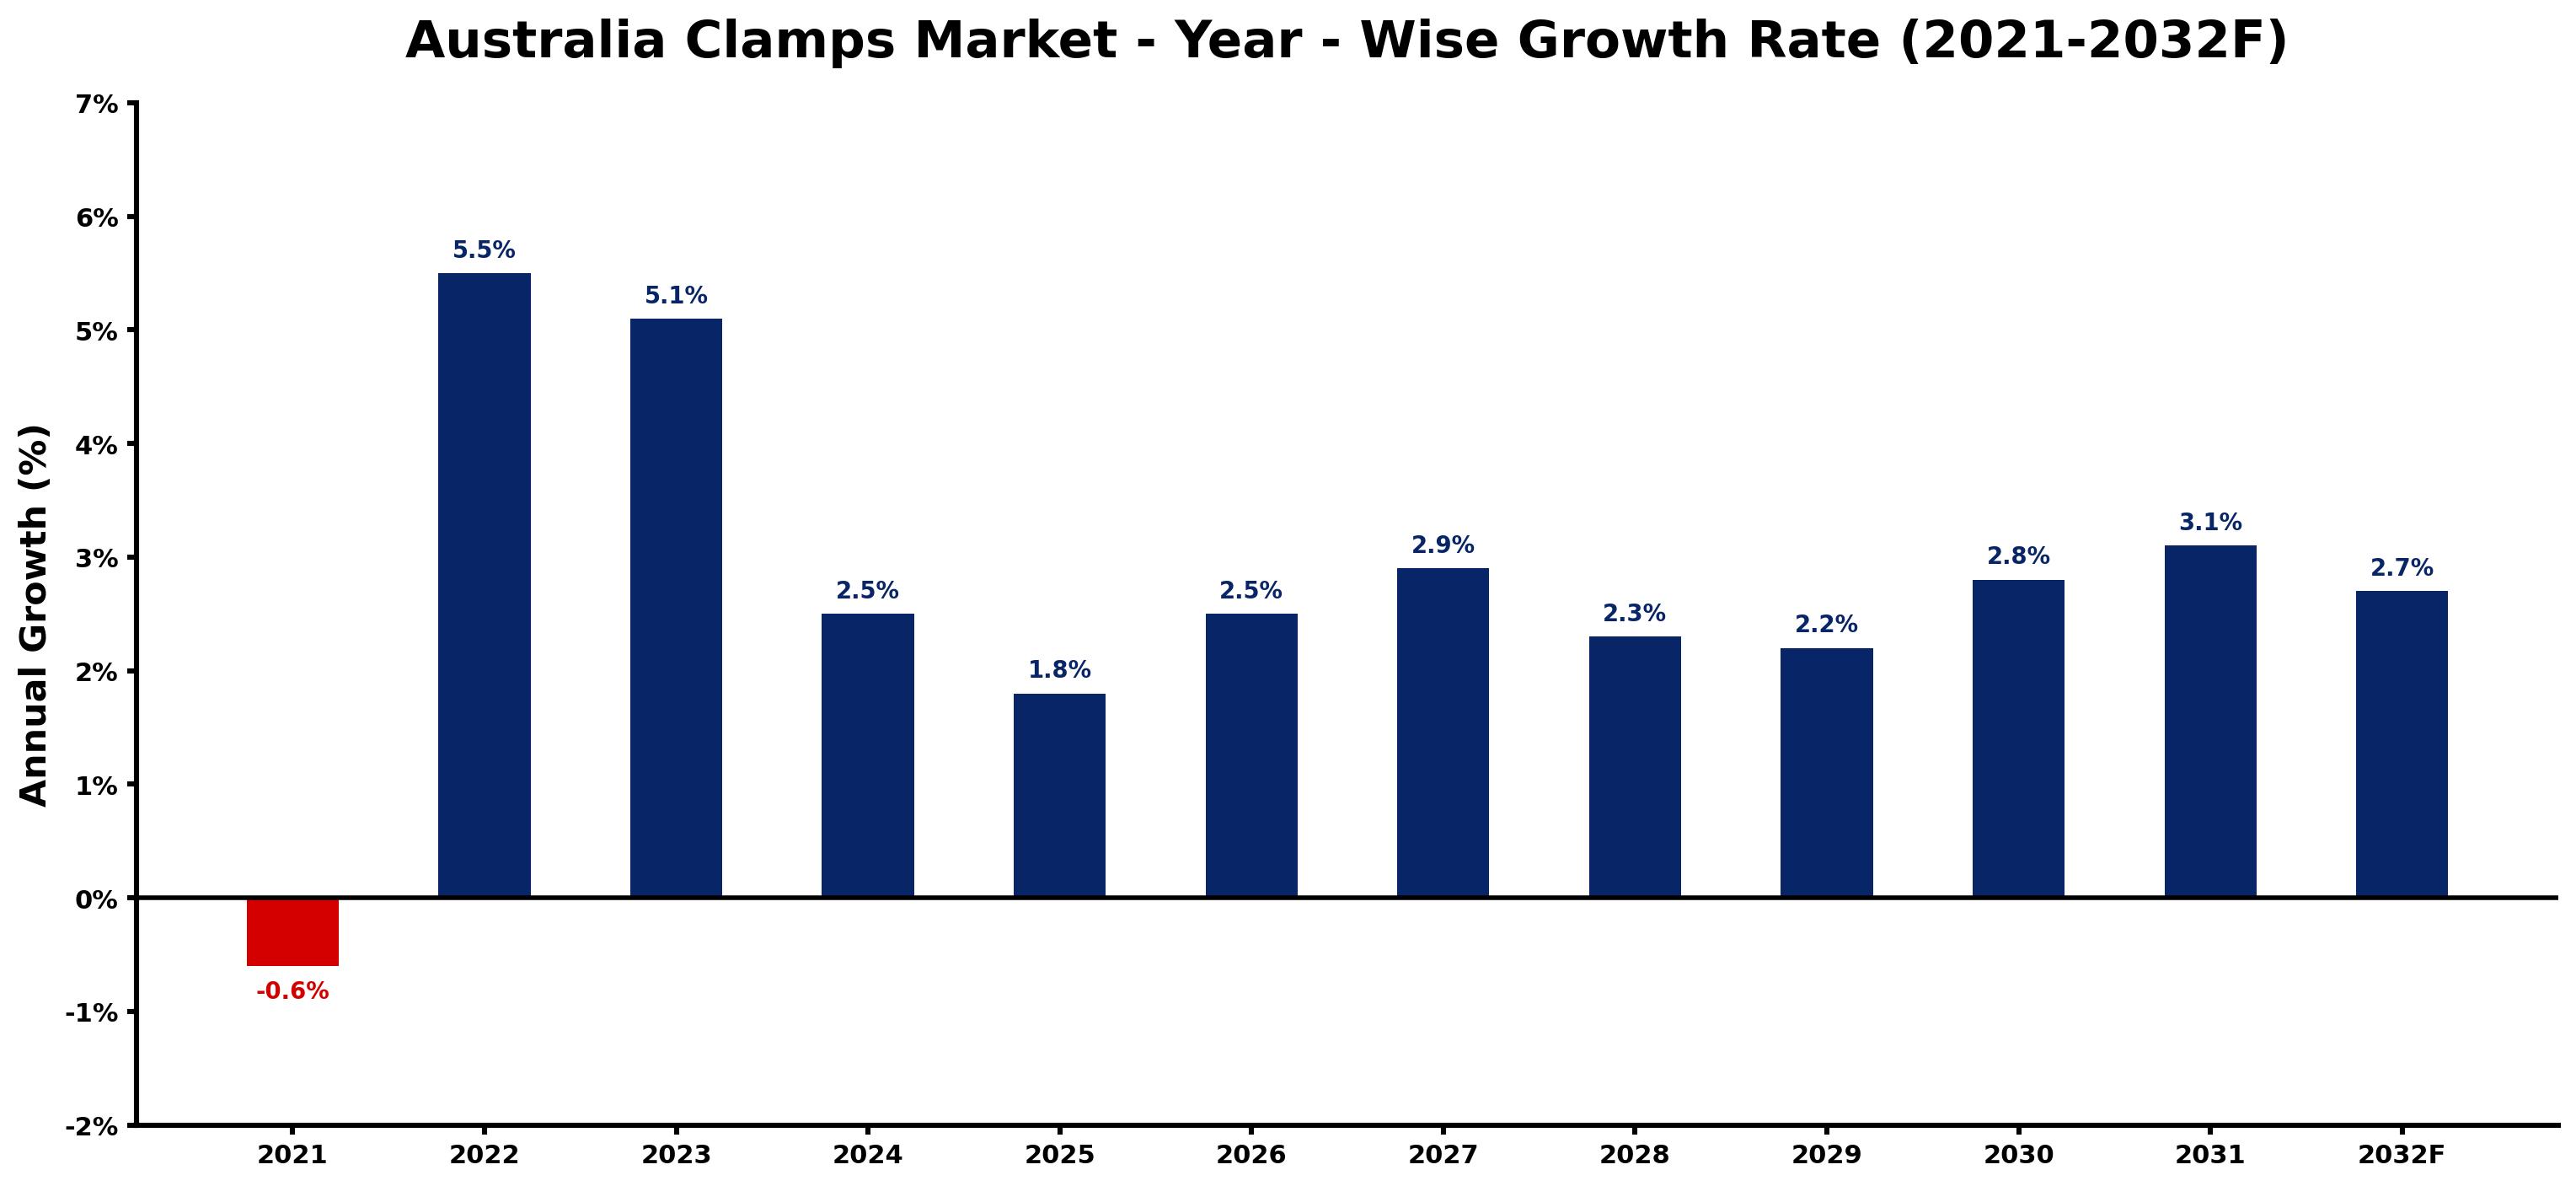
The table below presents the year‑wise growth rates along with the key drivers influencing the market
| Year | Growth Rate | Major Drivers |
| 2021 | -0.6% | Rising electricity demand across industries |
| 2022 | 5.5% | Growing renewable energy integration projects |
| 2023 | 5.1% | Expansion of commercial construction activities |
| 2024 | 2.5% | Increasing adoption of advanced technologies |
| 2025 | 1.8% | Rapid growth in telecom and data center sectors |
| 2026 | 2.5% | Increasing industrial automation investments |
| 2027 | 2.9% | Increasing smart city development projects |
| 2028 | 2.3% | Growing renewable energy integration projects |
| 2029 | 2.2% | Increasing adoption of advanced technologies |
| 2030 | 2.8% | Expansion of manufacturing activities |
| 2031 | 3.1% | Rapid growth in telecom and data center sectors |
| 2032 | 2.7% | Growing urbanization and commercial development |
Note - Market size estimations and growth projections presented in this report are based on 6Wresearch’s advanced forecasting approach, validated with industry datasets as of June 2026.
Australia Clamps Market Synopsis
The strongest force shaping the Australia clamps market currently is the surge in construction and infrastructure development. The combination of governmental support for building projects and the rising population’s need for residential and commercial spaces creates a fertile ground for clamp applications across various sectors. This demand is echoed in woodworking and automotive industries, where precision and reliability are paramount.
Moreover, technological advancements in clamp design, including quick-release and one-handed variants, are enhancing user experience and operational efficiency. Such innovations not only improve productivity but also cater to the evolving needs of both professional contractors and DIY enthusiasts, ensuring a competitive edge for manufacturers within the market.
Australia Clamps Market Key Takeaways
- The market is on a steady growth path driven by construction and DIY sectors.
- Technological innovations are improving clamp usability and efficiency.
- Specialized clamps for niche applications are gaining traction.
- Material quality and ergonomic design are key focus areas for manufacturers.
- Regulatory compliance is essential for ensuring safety and effectiveness.
Evaluation of Restraints in Australia Clamps Market
Despite the positive growth outlook, the Australia clamps market faces challenges from competing fastening methods such as adhesives and welding. These alternatives often provide simpler solutions for specific applications, compelling clamp manufacturers to enhance their product designs continuously. Additionally, maintaining compatibility across a variety of materials and applications poses a significant challenge. As manufacturers strive to innovate while ensuring user-friendliness, they must also balance performance and cost-effectiveness to remain competitive in an evolving landscape.
Australia Clamps Market Trends
Current trends highlight a growing preference for ergonomic clamp designs that enhance user comfort during prolonged use. Furthermore, the introduction of specialized clamps tailored for industries like marine, aerospace, and electronics is emerging, driven by the specific requirements of these sectors. Digital transformation is also influencing the market, with smart clamps equipped with monitoring capabilities finding their way into advanced manufacturing environments.
Australia Clamps Market Opportunities
Significant growth opportunities exist in the growing sectors of renewable energy and infrastructure, where innovative clamping solutions are essential for efficient assembly and maintenance processes. Additionally, as more consumers engage in DIY projects, the demand for a diverse range of clamps tailored for various applications presents a lucrative avenue for manufacturers. Investment in research and development is crucial for leveraging these opportunities and capturing market share.
Government Initiatives in the Australia Clamps Market
The Australian government continues to support infrastructure projects through various initiatives, encouraging the construction and manufacturing sectors. Regulatory policies aimed at enhancing workplace safety and material quality are significant, as compliance ensures reliability in product performance. Such initiatives also foster innovation among manufacturers, prompting them to invest in advanced technologies and sustainable materials, ultimately contributing to a more resilient market landscape.
Future Insights of the Australia Clamps Market
Looking ahead to 2026-2032, the Australia clamps market is poised for steady growth, bolstered by advancements in technology and a burgeoning emphasis on safety and efficiency. As manufacturers refine their offerings to meet niche demands and embrace sustainability, the market will likely experience a shift towards more specialized and eco-friendly products. The integration of digital solutions into clamp design will further enhance operational efficiencies, positioning the Australia clamps market for a successful and innovative future.
Australia Clamps Market Latest Developments (May 2025 - June 2026)
In recent months, the industry has seen a notable uptick in product launches, with several manufacturers unveiling advanced clamp designs tailored for specific applications. The emphasis has been on enhancing user-friendliness and ergonomics to cater to both professional and DIY markets. Additionally, collaborative initiatives between manufacturers and research institutions are fostering innovation, leading to the development of smart clamping solutions that integrate connectivity features to boost efficiency in various workflows.
Australia Clamps Market - Key Attractiveness of the Report
- 10 Years of Market Numbers
- Historical Data Starting from 2022 to 2025
- Base Year: 2025
- Forecast Data until 2032
- Key Performance Indicators Impacting the Market
- Major Upcoming Developments and Projects
Key Highlights of the Report:
- Australia Clamps Market Outlook
- Market Size of Australia Clamps Market, 2025
- Forecast of Australia Clamps Market, 2032
- Historical Data and Forecast of Australia Clamps Revenues & Volume for the Period 2022-2032F
- Australia Clamps Market Trend Evolution
- Australia Clamps Market Drivers and Challenges
- Australia Clamps Price Trends
- Australia Clamps Porter's Five Forces
- Australia Clamps Industry Life Cycle
- Historical Data and Forecast of Australia Clamps Market Revenues & Volume By Type for the Period 2022-2032F
- Historical Data and Forecast of Australia Clamps Market Revenues & Volume By Aortic cross-clamp for the Period 2022-2032F
- Historical Data and Forecast of Australia Clamps Market Revenues & Volume By Bulldogs Forceps for the Period 2022-2032F
- Historical Data and Forecast of Australia Clamps Market Revenues & Volume By Needle Holder for the Period 2022-2032F
- Historical Data and Forecast of Australia Clamps Market Revenues & Volume By Aortic cross-clamp for the Period 2022-2032F
- Historical Data and Forecast of Australia Clamps Market Revenues & Volume By Others for the Period 2022-2032F
- Historical Data and Forecast of Australia Clamps Market Revenues & Volume By End-use for the Period 2022-2032F
- Historical Data and Forecast of Australia Clamps Market Revenues & Volume By Hospitals for the Period 2022-2032F
- Historical Data and Forecast of Australia Clamps Market Revenues & Volume By Ambulatory Surgical Centers for the Period 2022-2032F
- Historical Data and Forecast of Australia Clamps Market Revenues & Volume By Research organizations for the Period 2022-2032F
- Australia Clamps Import Export Trade Statistics
- Market Opportunity Assessment By Type
- Market Opportunity Assessment By End-use
- Australia Clamps Top Companies Market Share
- Australia Clamps Competitive Benchmarking By Technical and Operational Parameters
- Australia Clamps Company Profiles
- Australia Clamps Key Strategic Recommendations
Australia Clamps Market - Frequently Asked Questions
The primary drivers include increased construction activities, ongoing infrastructure projects, and a surge in DIY home improvement initiatives.
The Australia Clamps Market was estimated at USD 185 Million in 2025 and is projected to reach USD 217 Million by 2032, growing at a CAGR of 2.3% from 2026 to 2032.
Manufacturers face competition from alternative fastening methods and the need to continuously innovate to ensure their clamps remain relevant and user-friendly across various applications.
Innovations in clamp design, such as quick-release mechanisms and ergonomic features, are enhancing user experience and productivity, thus driving demand.
Key consumers of clamps include the construction, automotive, and woodworking industries, with growing interest from specialized sectors like marine and aerospace.
6Wresearch actively monitors the Australia Clamps Market and publishes its comprehensive annual report, highlighting emerging trends, growth drivers, revenue analysis, and forecast outlook. Our insights help businesses to make data-backed strategic decisions with ongoing market dynamics. Our analysts track relevent industries related to the Australia Clamps Market, allowing our clients with actionable intelligence and reliable forecasts tailored to emerging regional needs.
Yes, we provide customisation as per your requirements. To learn more, feel free to contact us on sales@6wresearch.com
1 Executive Summary |
2 Introduction |
2.1 Key Highlights of the Report |
2.2 Report Description |
2.3 Market Scope & Segmentation |
2.4 Research Methodology |
2.5 Assumptions |
3 Australia Clamps Market Overview |
3.1 Australia Country Macro Economic Indicators |
3.2 Australia Clamps Market Revenues & Volume, 2022 & 2032F |
3.3 Australia Clamps Market - Industry Life Cycle |
3.4 Australia Clamps Market - Porter's Five Forces |
3.5 Australia Clamps Market Revenues & Volume Share, By Type, 2022 & 2032F |
3.6 Australia Clamps Market Revenues & Volume Share, By End-use, 2022 & 2032F |
4 Australia Clamps Market Dynamics |
4.1 Impact Analysis |
4.2 Market Drivers |
4.2.1 Increasing infrastructure development projects in Australia leading to higher demand for clamps |
4.2.2 Growing adoption of advanced and specialized clamps in various industries |
4.2.3 Favorable government regulations and initiatives supporting the manufacturing sector |
4.3 Market Restraints |
4.3.1 Volatility in raw material prices impacting production costs |
4.3.2 Intense competition from domestic and international clamp manufacturers |
4.3.3 Economic uncertainty affecting investment decisions in new clamp projects |
5 Australia Clamps Market Trends |
6 Australia Clamps Market, By Types |
6.1 Australia Clamps Market, By Type |
6.1.1 Overview and Analysis |
6.1.2 Australia Clamps Market Revenues & Volume, By Type, 2022-2032F |
6.1.3 Australia Clamps Market Revenues & Volume, By Aortic cross-clamp, 2022-2032F |
6.1.4 Australia Clamps Market Revenues & Volume, By Bulldogs Forceps, 2022-2032F |
6.1.5 Australia Clamps Market Revenues & Volume, By Needle Holder, 2022-2032F |
6.1.6 Australia Clamps Market Revenues & Volume, By Aortic cross-clamp, 2022-2032F |
6.1.7 Australia Clamps Market Revenues & Volume, By Others, 2022-2032F |
6.2 Australia Clamps Market, By End-use |
6.2.1 Overview and Analysis |
6.2.2 Australia Clamps Market Revenues & Volume, By Hospitals, 2022-2032F |
6.2.3 Australia Clamps Market Revenues & Volume, By Ambulatory Surgical Centers, 2022-2032F |
6.2.4 Australia Clamps Market Revenues & Volume, By Research organizations, 2022-2032F |
7 Australia Clamps Market Import-Export Trade Statistics |
7.1 Australia Clamps Market Export to Major Countries |
7.2 Australia Clamps Market Imports from Major Countries |
8 Australia Clamps Market Key Performance Indicators |
8.1 Average selling price of clamps in the Australian market |
8.2 Number of new product launches and innovations in the clamp industry |
8.3 Customer satisfaction and retention rates for clamp manufacturers |
8.4 Adoption rate of clamps in emerging industries such as renewable energy and aerospace applications |
9 Australia Clamps Market - Opportunity Assessment |
9.1 Australia Clamps Market Opportunity Assessment, By Type, 2022 & 2032F |
9.2 Australia Clamps Market Opportunity Assessment, By End-use, 2022 & 2032F |
10 Australia Clamps Market - Competitive Landscape |
10.1 Australia Clamps Market Revenue Share, By Companies, 2025 |
10.2 Australia Clamps Market Competitive Benchmarking, By Operating and Technical Parameters |
11 Company Profiles |
12 Recommendations |
13 Disclaimer |
Global Go To Market Strategy - 2030
Export potential enables firms to identify high-growth global markets with greater confidence by combining advanced trade intelligence with a structured quantitative methodology. The framework analyzes emerging demand trends and country-level import patterns while integrating macroeconomic and trade datasets such as GDP and population forecasts, bilateral import–export flows, tariff structures, elasticity differentials between developed and developing economies, geographic distance, and import demand projections. Using weighted trade values from 2020–2024 as the base period to project country-to-country export potential for 2030, these inputs are operationalized through calculated drivers such as gravity model parameters, tariff impact factors, and projected GDP per-capita growth. Through an analysis of hidden potentials, demand hotspots, and market conditions that are most favorable to success, this method enables firms to focus on target countries, maximize returns, and global expansion with data, backed by accuracy.
By factoring in the projected importer demand gap that is currently unmet and could be potential opportunity, it identifies the potential for the Exporter (Country) among 190 countries, against the general trade analysis, which identifies the biggest importer or exporter.
To discover high-growth global markets and optimize your business strategy:
Click Here
Pricing
- Single User License$ 1,995
- Department License$ 2,400
- Site License$ 3,120
- Global License$ 3,795

Leadership Perspectives from Industry Events
Search
Thought Leadership and Analyst Meet


Our Clients
6WResearch In News
- India Air Conditioner Market Set for Strong Rebound in 2026 After Weather-Led Correction and GST-Driven Recovery: 6Wresearch
- ADAS in India: How Automatic Emergency Braking, Blind Spot Detection & Driver Monitoring are Transforming Road Safety
- Doha a strategic location for EV manufacturing hub: IPA Qatar
- Demand for luxury TVs surging in the GCC, says Samsung
- Empowering Growth: The Thriving Journey of Bangladesh’s Cable Industry
- Demand for luxury TVs surging in the GCC, says Samsung
Latest Reports
- Poland Fire Protection Systems Market (2026-2032)
- Cape Verde Portable Hand-Thrown Extinguisher Market (2026-2032)
- Canada Portable Hand-Thrown Extinguisher Market (2026-2032)
- Cameroon Portable Hand-Thrown Extinguisher Market (2026-2032)
- Burundi Portable Hand-Thrown Extinguisher Market (2026-2032)
- Burkina Faso Portable Hand-Thrown Extinguisher Market (2026-2032)
- Bulgaria Portable Hand-Thrown Extinguisher Market (2026-2032)
- Brunei Portable Hand-Thrown Extinguisher Market (2026-2032)
- Botswana Portable Hand-Thrown Extinguisher Market (2026-2032)
- Bosnia and Herzegovina Portable Hand-Thrown Extinguisher Market (2026-2032)
Industry Events and Analyst Meet

HIMTEX 2026

India Refining Summit 2026

India EV Show 2026

EV tech India Expo 2026

Auto Tech Asia 2026
Whitepaper
- Middle East & Africa Commercial Security Market Click here to view more.
- Middle East & Africa Fire Safety Systems & Equipment Market Click here to view more.
- GCC Drone Market Click here to view more.
- Middle East Lighting Fixture Market Click here to view more.
- GCC Physical & Perimeter Security Market Click here to view more.