Australia Computer Power Cable Assemblies Market (2026-2032) | Companies, Industry, Growth, Share, Outlook, Value, Analysis, Trends, Size, Revenue & Forecast
Market Forecast By Types (4-Pin Molex, 20-Pin ATX, 26-Pin MDR, 26-Pin SDR), By Applications (PC, Laptop, Super Computer, Others) And Competitive Landscape
| Product Code: ETC032455 | Publication Date: Oct 2020 | Updated Date: Jun 2026 | Product Type: Report | |
| Publisher: 6Wresearch | Author: Ravi Bhandari | No. of Pages: 70 | No. of Figures: 35 | No. of Tables: 5 |
Australia Computer Power Cable Assemblies Market Summary
The australia computer power cable assemblies market was estimated at USD 238 Million in 2025 and is projected to reach USD 279 Million by 2032, growing at a CAGR of 2.3% from 2026 to 2032.
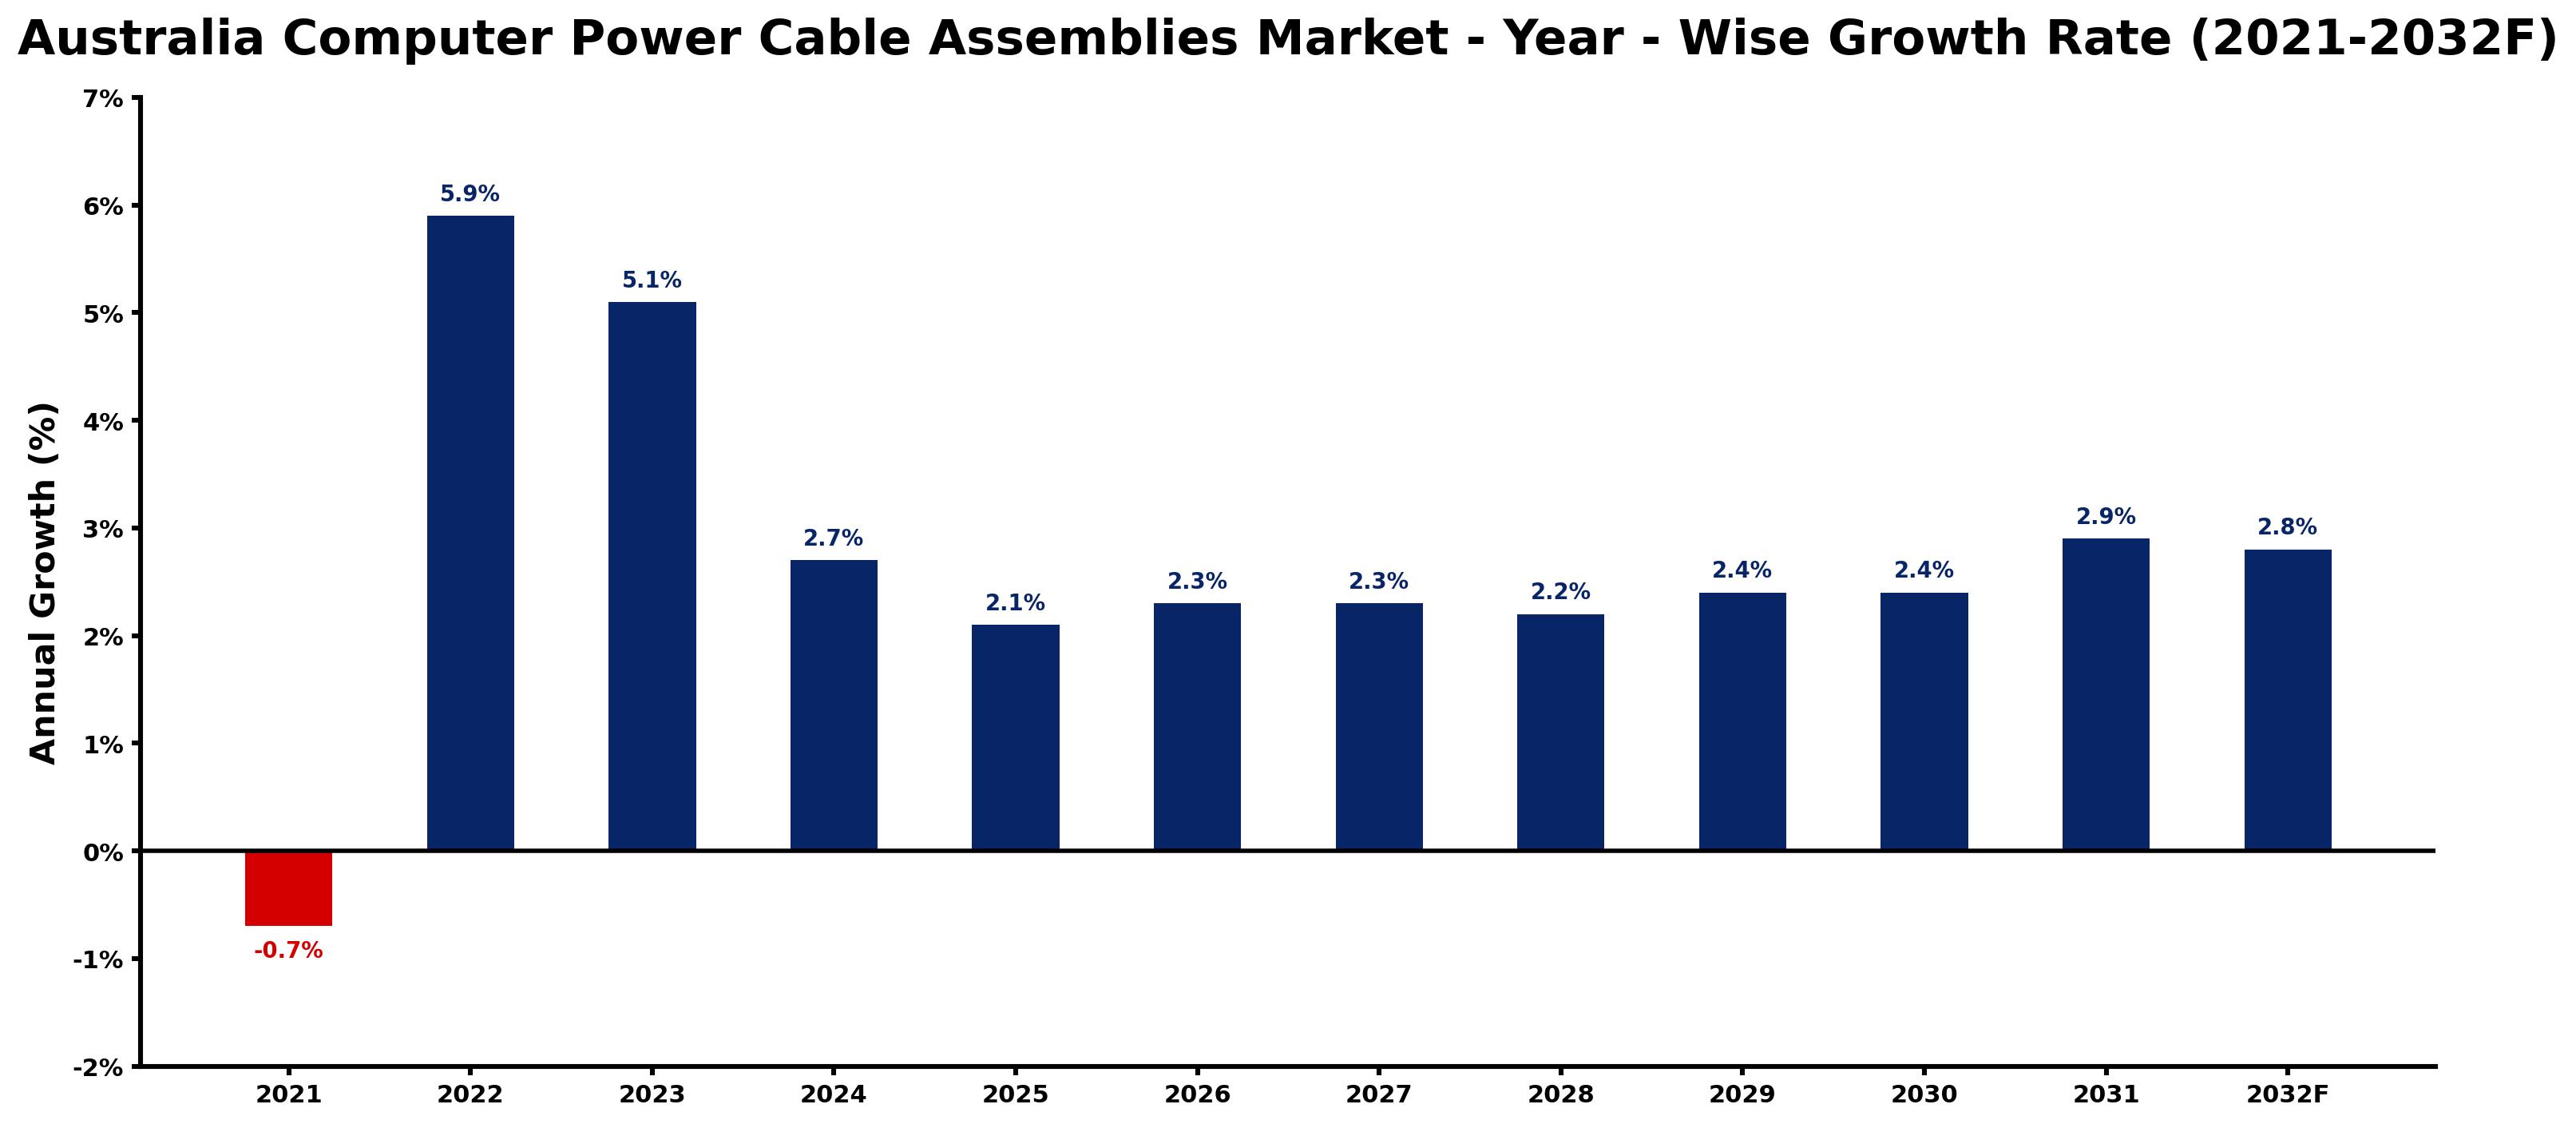
Australia Computer Power Cable Assemblies Market Growth Rate Analysis (2021-2032)
The Computer Power Cable Assemblies market in Australia has exhibited a notable recovery following a minor decline of -0.7% in 2021. A surge in demand for computer components and increasing investments in digital infrastructure drove growth to 5.9% in 2022. The momentum continued in 2023 with a 5.1% increase, supported by advancements in technology and the ongoing digitalization of various sectors. Subsequently, growth rates are expected to stabilize around 2.1% to 2.9% from 2024 to 2032, reflecting steady consumer demand and infrastructure development. This trend indicates a robust adaptation to the energy transition, with manufacturers aligning product offerings to meet evolving industry standards and customer requirements.
Australia Computer Power Cable Assemblies Market Year-wise Growth Rate and Key Drivers
This graph highlights how the Australia Computer Power Cable Assemblies Market has steadily grown over the past five years, supported by major growth factors.
The table below presents the year wise growth rates along with the key drivers influencing the market
| Year | Growth Rate | Major Drivers |
| 2021 | -0.7% | Supply chain disruptions caused delays in production, leading to diminished availability of computer power cable assemblies. |
| 2022 | 5.9% | E-commerce boom prompted heightened demand for reliable data center power solutions. |
| 2023 | 5.1% | Legacy copper grid failures highlighted the need for improved electrical infrastructure resilience. |
| 2024 | 2.7% | Enterprise budgets prioritizing energy efficiency are reshaping procurement strategies in Australia. |
| 2025 | 2.1% | Local manufacturing initiatives are boosting the domestic production of cable assemblies significantly. |
| 2026 | 2.3% | Rapid urbanization trends are creating new opportunities in smart city development projects. |
| 2027 | 2.3% | Rising consumer electronics usage drives the need for specialized power solutions and assemblies. |
| 2028 | 2.2% | Sustainability goals lead manufacturers to innovate with eco-friendly cable assembly materials. |
| 2029 | 2.4% | Emerging technologies in automation require enhanced power solutions for uninterrupted operations. |
| 2030 | 2.4% | Global supply chain shifts are prompting businesses to localize cable assembly production. |
| 2031 | 2.9% | Collaborative projects in renewable energy offer extensive growth prospects for power cable markets. |
| 2032 | 2.8% | Investment in electric vehicles creates new pathways for electrical infrastructure enhancements. |
Note - Market size estimations and growth projections presented in this report are based on 6Wresearch's advanced forecasting approach, validated with industry datasets as of June 2026.
Australia Computer Power Cable Assemblies Market Synopsis
The Australia Computer Power Cable Assemblies Market is projected to reach 2.3% and witness significant growth during the forecast period (2026-2032). This market encompasses a wide range of cables and connectors that facilitate power distribution within computing environments, including power cords, adapters, and internal power components. The upsurge in computing device adoption across multiple sectors, coupled with the burgeoning demand for efficient and reliable power solutions, is shaping the trajectory of this market.
Australia Computer Power Cable Assemblies Market Growth Drivers
The Australia Computer Power Cable Assemblies Market is experiencing robust growth, driven primarily by several crucial factors:
- The proliferation of portable computing devices across consumer and enterprise levels is significantly increasing the demand for power cable assemblies designed to support these technologies.
- Energy efficiency has become a priority, with businesses and consumers alike seeking cable solutions that minimize power loss and optimize energy consumption.
- The rapid expansion of data centers in Australia is a significant driver, necessitating reliable power connectivity for servers, networking hardware, and associated peripherals.
- Innovations in cable technology, such as the development of USB-C and Thunderbolt connectors, are enhancing the capabilities of power cable assemblies, making them more attractive to users.
- The increasing integration of IoT devices is propelling the demand for versatile power solutions, which can accommodate a diverse range of applications and devices, further stimulating market growth.
Australia Computer Power Cable Assemblies Market Challenges and Restraints
Despite its growth potential, the Australia Computer Power Cable Assemblies Market faces several challenges that could impede progress:
- Strict regulations and safety standards concerning electrical products necessitate manufacturers to comply, often resulting in increased production costs and complexity.
- The market is threatened by the prevalence of counterfeit and substandard products, which can undermine consumer trust and impact the reputation of legitimate manufacturers.
- The rise of alternative technologies, such as wireless charging and advanced USB-C connectivity, poses challenges for traditional power cable solutions, potentially leading to a decline in demand for certain products.
- An evolving technological landscape requires continuous innovation, which can strain resources for manufacturers striving to keep pace with rapid advancements.
- Economic fluctuations and supply chain disruptions, particularly in the wake of global events, can lead to volatility in both production and pricing, affecting market stability.
Australia Computer Power Cable Assemblies Market Investment Opportunities
Investment opportunities within the Australia Computer Power Cable Assemblies Market are burgeoning, driven by several factors:
- The growing emphasis on renewable energy solutions presents a chance for manufacturers to innovate power cable assemblies compatible with sustainable energy sources.
- Increased investment in cloud computing infrastructures and data centers creates a demand for high-performance power cable assemblies tailored to support these environments.
- Research and development initiatives focused on enhancing cable technology open pathways for new product offerings and market differentiation.
- Partnerships with tech companies to develop integrated solutions can drive market expansion, offering bundled products that appeal to end-users.
- Government incentives for local manufacturing and innovation initiatives can provide financial support for companies looking to establish or expand their production capabilities.
Australia Computer Power Cable Assemblies Market Government Investment and Initiatives
Government investment and policy initiatives play a pivotal role in shaping the Australia Computer Power Cable Assemblies Market. The Australian government has instituted various regulations aimed at enhancing energy efficiency and ensuring product safety. Key policies include:
- Establishing standards for electrical safety that manufacturers must meet, which protects consumers and builds confidence in power cable assembly products.
- Implementing energy efficiency regulations designed to reduce power consumption across all sectors, which influences the design and production of power cable assemblies.
- Promoting local manufacturing through tax incentives and grants, thereby encouraging the development of domestic capabilities in producing power cable assemblies.
- Facilitating research and development funding to stimulate innovation in the sector, especially in the context of integrating renewable energy technologies.
- Engaging with industry stakeholders to foster collaboration and address challenges associated with product compliance and market demands.
Australia Computer Power Cable Assemblies Market Latest Developments (May 2025 - June 2026)
Recent developments in the Australia Computer Power Cable Assemblies Market from May 2025 to June 2026 indicate a dynamic and evolving landscape:
- The market has seen an increase in the introduction of smart cable solutions, integrating features such as real-time monitoring and energy management capabilities.
- Advancements in insulation technology have enhanced the performance and safety of power cable assemblies, further driving consumer preference.
- Sustainability initiatives have become more pronounced, with manufacturers focusing on eco-friendly materials and production processes.
- Collaborations between tech firms and power cable manufacturers have emerged, emphasizing the integration of seamless connectivity solutions.
- Industry conferences and expos have highlighted trends in design and innovation, providing a platform for stakeholders to share insights and foster partnerships.
Australia Computer Power Cable Assemblies Market - Key Attractiveness of the Report
- 10 Years of Market Numbers
- Historical Data Starting from 2022 to 2025
- Base Year: 2025
- Forecast Data until 2032
- Key Performance Indicators Impacting the Market
- Major Upcoming Developments and Projects
Key Highlights of the Report:
- Australia Computer Power Cable Assemblies Market Outlook
- Market Size of Australia Computer Power Cable Assemblies Market, 2025
- Forecast of Australia Computer Power Cable Assemblies Market, 2032
- Historical Data and Forecast of Australia Computer Power Cable Assemblies Revenues & Volume for the Period 2022-2032F
- Australia Computer Power Cable Assemblies Market Trend Evolution
- Australia Computer Power Cable Assemblies Market Drivers and Challenges
- Australia Computer Power Cable Assemblies Price Trends
- Australia Computer Power Cable Assemblies Porter's Five Forces
- Australia Computer Power Cable Assemblies Industry Life Cycle
- Historical Data and Forecast of Australia Computer Power Cable Assemblies Market Revenues & Volume By Types for the Period 2022-2032F
- Historical Data and Forecast of Australia Computer Power Cable Assemblies Market Revenues & Volume By 4-Pin Molex for the Period 2022-2032F
- Historical Data and Forecast of Australia Computer Power Cable Assemblies Market Revenues & Volume By 20-Pin ATX for the Period 2022-2032F
- Historical Data and Forecast of Australia Computer Power Cable Assemblies Market Revenues & Volume By 26-Pin MDR for the Period 2022-2032F
- Historical Data and Forecast of Australia Computer Power Cable Assemblies Market Revenues & Volume By 26-Pin SDR for the Period 2022-2032F
- Historical Data and Forecast of Australia Computer Power Cable Assemblies Market Revenues & Volume By Applications for the Period 2022-2032F
- Historical Data and Forecast of Australia Computer Power Cable Assemblies Market Revenues & Volume By PC for the Period 2022-2032F
- Historical Data and Forecast of Australia Computer Power Cable Assemblies Market Revenues & Volume By Laptop for the Period 2022-2032F
- Historical Data and Forecast of Australia Computer Power Cable Assemblies Market Revenues & Volume By Super Computer for the Period 2022-2032F
- Historical Data and Forecast of Australia Computer Power Cable Assemblies Market Revenues & Volume By Others for the Period 2022-2032F
- Australia Computer Power Cable Assemblies Import Export Trade Statistics
- Market Opportunity Assessment By Types
- Market Opportunity Assessment By Applications
- Australia Computer Power Cable Assemblies Top Companies Market Share
- Australia Computer Power Cable Assemblies Competitive Benchmarking By Technical and Operational Parameters
- Australia Computer Power Cable Assemblies Company Profiles
- Australia Computer Power Cable Assemblies Key Strategic Recommendations
Frequently Asked Questions About the Market Study (FAQs):
The market is anticipated to exhibit robust growth during the forecast period of 2026-2032, stimulated by various technological advancements and increasing demand.
Government regulations ensure safety and efficiency in product offerings, whilst also providing incentives for local manufacturing, all of which influence market dynamics.
The market contends with regulatory compliance, counterfeit products, and shifts towards alternative technologies such as wireless solutions.
Opportunities are abundant in renewable energy integration, technological innovation, and partnerships with other tech firms that aim to offer comprehensive power solutions.
6Wresearch actively monitors the Australia Computer Power Cable Assemblies Market and publishes its comprehensive annual report, highlighting emerging trends, growth drivers, revenue analysis, and forecast outlook. Our insights help businesses to make data-backed strategic decisions with ongoing market dynamics. Our analysts track relevent industries related to the Australia Computer Power Cable Assemblies Market, allowing our clients with actionable intelligence and reliable forecasts tailored to emerging regional needs.
Yes, we provide customisation as per your requirements. To learn more, feel free to contact us on sales@6wresearch.com
1 Executive Summary |
2 Introduction |
2.1 Key Highlights of the Report |
2.2 Report Description |
2.3 Market Scope & Segmentation |
2.4 Research Methodology |
2.5 Assumptions |
3 Australia Computer Power Cable Assemblies Market Overview |
3.1 Australia Country Macro Economic Indicators |
3.2 Australia Computer Power Cable Assemblies Market Revenues & Volume, 2022 & 2032F |
3.3 Australia Computer Power Cable Assemblies Market - Industry Life Cycle |
3.4 Australia Computer Power Cable Assemblies Market - Porter's Five Forces |
3.5 Australia Computer Power Cable Assemblies Market Revenues & Volume Share, By Types, 2022 & 2032F |
3.6 Australia Computer Power Cable Assemblies Market Revenues & Volume Share, By Applications, 2022 & 2032F |
4 Australia Computer Power Cable Assemblies Market Dynamics |
4.1 Impact Analysis |
4.2 Market Drivers |
4.2.1 Increasing demand for computers and related peripherals in Australia |
4.2.2 Growing adoption of advanced technologies requiring specific power cable assemblies |
4.2.3 Rising trend of customization and personalization of computer setups |
4.3 Market Restraints |
4.3.1 Challenges related to sourcing high-quality materials for cable assemblies |
4.3.2 Increasing competition from cheaper imports |
4.3.3 Fluctuating raw material prices impacting production costs |
5 Australia Computer Power Cable Assemblies Market Trends |
6 Australia Computer Power Cable Assemblies Market, By Types |
6.1 Australia Computer Power Cable Assemblies Market, By Types |
6.1.1 Overview and Analysis |
6.1.2 Australia Computer Power Cable Assemblies Market Revenues & Volume, By Types, 2022-2032F |
6.1.3 Australia Computer Power Cable Assemblies Market Revenues & Volume, By 4-Pin Molex, 2022-2032F |
6.1.4 Australia Computer Power Cable Assemblies Market Revenues & Volume, By 20-Pin ATX, 2022-2032F |
6.1.5 Australia Computer Power Cable Assemblies Market Revenues & Volume, By 26-Pin MDR, 2022-2032F |
6.1.6 Australia Computer Power Cable Assemblies Market Revenues & Volume, By 26-Pin SDR, 2022-2032F |
6.2 Australia Computer Power Cable Assemblies Market, By Applications |
6.2.1 Overview and Analysis |
6.2.2 Australia Computer Power Cable Assemblies Market Revenues & Volume, By PC, 2022-2032F |
6.2.3 Australia Computer Power Cable Assemblies Market Revenues & Volume, By Laptop, 2022-2032F |
6.2.4 Australia Computer Power Cable Assemblies Market Revenues & Volume, By Super Computer, 2022-2032F |
6.2.5 Australia Computer Power Cable Assemblies Market Revenues & Volume, By Others, 2022-2032F |
7 Australia Computer Power Cable Assemblies Market Import-Export Trade Statistics |
7.1 Australia Computer Power Cable Assemblies Market Export to Major Countries |
7.2 Australia Computer Power Cable Assemblies Market Imports from Major Countries |
8 Australia Computer Power Cable Assemblies Market Key Performance Indicators |
8.1 Average lead time for manufacturing power cable assemblies |
8.2 Percentage of revenue invested in research and development for product innovation |
8.3 Customer satisfaction ratings for the quality and durability of cable assemblies |
9 Australia Computer Power Cable Assemblies Market - Opportunity Assessment |
9.1 Australia Computer Power Cable Assemblies Market Opportunity Assessment, By Types, 2022 & 2032F |
9.2 Australia Computer Power Cable Assemblies Market Opportunity Assessment, By Applications, 2022 & 2032F |
10 Australia Computer Power Cable Assemblies Market - Competitive Landscape |
10.1 Australia Computer Power Cable Assemblies Market Revenue Share, By Companies, 2025 |
10.2 Australia Computer Power Cable Assemblies Market Competitive Benchmarking, By Operating and Technical Parameters |
11 Company Profiles |
12 Recommendations |
13 Disclaimer |
Global Go To Market Strategy - 2030
Export potential enables firms to identify high-growth global markets with greater confidence by combining advanced trade intelligence with a structured quantitative methodology. The framework analyzes emerging demand trends and country-level import patterns while integrating macroeconomic and trade datasets such as GDP and population forecasts, bilateral import–export flows, tariff structures, elasticity differentials between developed and developing economies, geographic distance, and import demand projections. Using weighted trade values from 2020–2024 as the base period to project country-to-country export potential for 2030, these inputs are operationalized through calculated drivers such as gravity model parameters, tariff impact factors, and projected GDP per-capita growth. Through an analysis of hidden potentials, demand hotspots, and market conditions that are most favorable to success, this method enables firms to focus on target countries, maximize returns, and global expansion with data, backed by accuracy.
By factoring in the projected importer demand gap that is currently unmet and could be potential opportunity, it identifies the potential for the Exporter (Country) among 190 countries, against the general trade analysis, which identifies the biggest importer or exporter.
To discover high-growth global markets and optimize your business strategy:
Click Here
Pricing
- Single User License$ 1,995
- Department License$ 2,400
- Site License$ 3,120
- Global License$ 3,795

Leadership Perspectives from Industry Events
Search
Thought Leadership and Analyst Meet


Our Clients
6WResearch In News
- Doha a strategic location for EV manufacturing hub: IPA Qatar
- Demand for luxury TVs surging in the GCC, says Samsung
- Empowering Growth: The Thriving Journey of Bangladesh’s Cable Industry
- Demand for luxury TVs surging in the GCC, says Samsung
- Video call with a traditional healer? Once unthinkable, it’s now common in South Africa
- Intelligent Buildings To Smooth GCC’s Path To Net Zero
Latest Reports
- Cape Verde Portable Hand-Thrown Extinguisher Market (2026-2032)
- Canada Portable Hand-Thrown Extinguisher Market (2026-2032)
- Cameroon Portable Hand-Thrown Extinguisher Market (2026-2032)
- Burundi Portable Hand-Thrown Extinguisher Market (2026-2032)
- Burkina Faso Portable Hand-Thrown Extinguisher Market (2026-2032)
- Bulgaria Portable Hand-Thrown Extinguisher Market (2026-2032)
- Brunei Portable Hand-Thrown Extinguisher Market (2026-2032)
- Botswana Portable Hand-Thrown Extinguisher Market (2026-2032)
- Bosnia and Herzegovina Portable Hand-Thrown Extinguisher Market (2026-2032)
- Bolivia Portable Hand-Thrown Extinguisher Market (2026-2032)
Industry Events and Analyst Meet

HIMTEX 2026

India Refining Summit 2026

India EV Show 2026

EV tech India Expo 2026

Auto Tech Asia 2026
Whitepaper
- Middle East & Africa Commercial Security Market Click here to view more.
- Middle East & Africa Fire Safety Systems & Equipment Market Click here to view more.
- GCC Drone Market Click here to view more.
- Middle East Lighting Fixture Market Click here to view more.
- GCC Physical & Perimeter Security Market Click here to view more.