Australia Energy Saving & Fluorescent Market (2026-2032) | Trends, Growth, COVID-19 IMPACT, Industry, Revenue, Size, Forecast, Companies, Analysis, Share, Value & Outlook
Market Forecast By Sources (High-Intensity Discharge Lamps (HID), Linear Fluorescent Lamps (LFL), Light Emitting Diodes (LED)), By Applications (Commercial, Residential, Government) And Competitive Landscape
| Product Code: ETC005095 | Publication Date: Sep 2020 | Updated Date: Jun 2026 | Product Type: Report | |
| Publisher: 6Wresearch | Author: Ravi Bhandari | No. of Pages: 70 | No. of Figures: 35 | No. of Tables: 5 |
Australia Energy Saving & Fluorescent Market Summary
The australia energy saving & fluorescent market was estimated at USD 140 Million in 2025 and is projected to reach USD 165 Million by 2032, growing at a CAGR of 2.8% from 2026 to 2032.
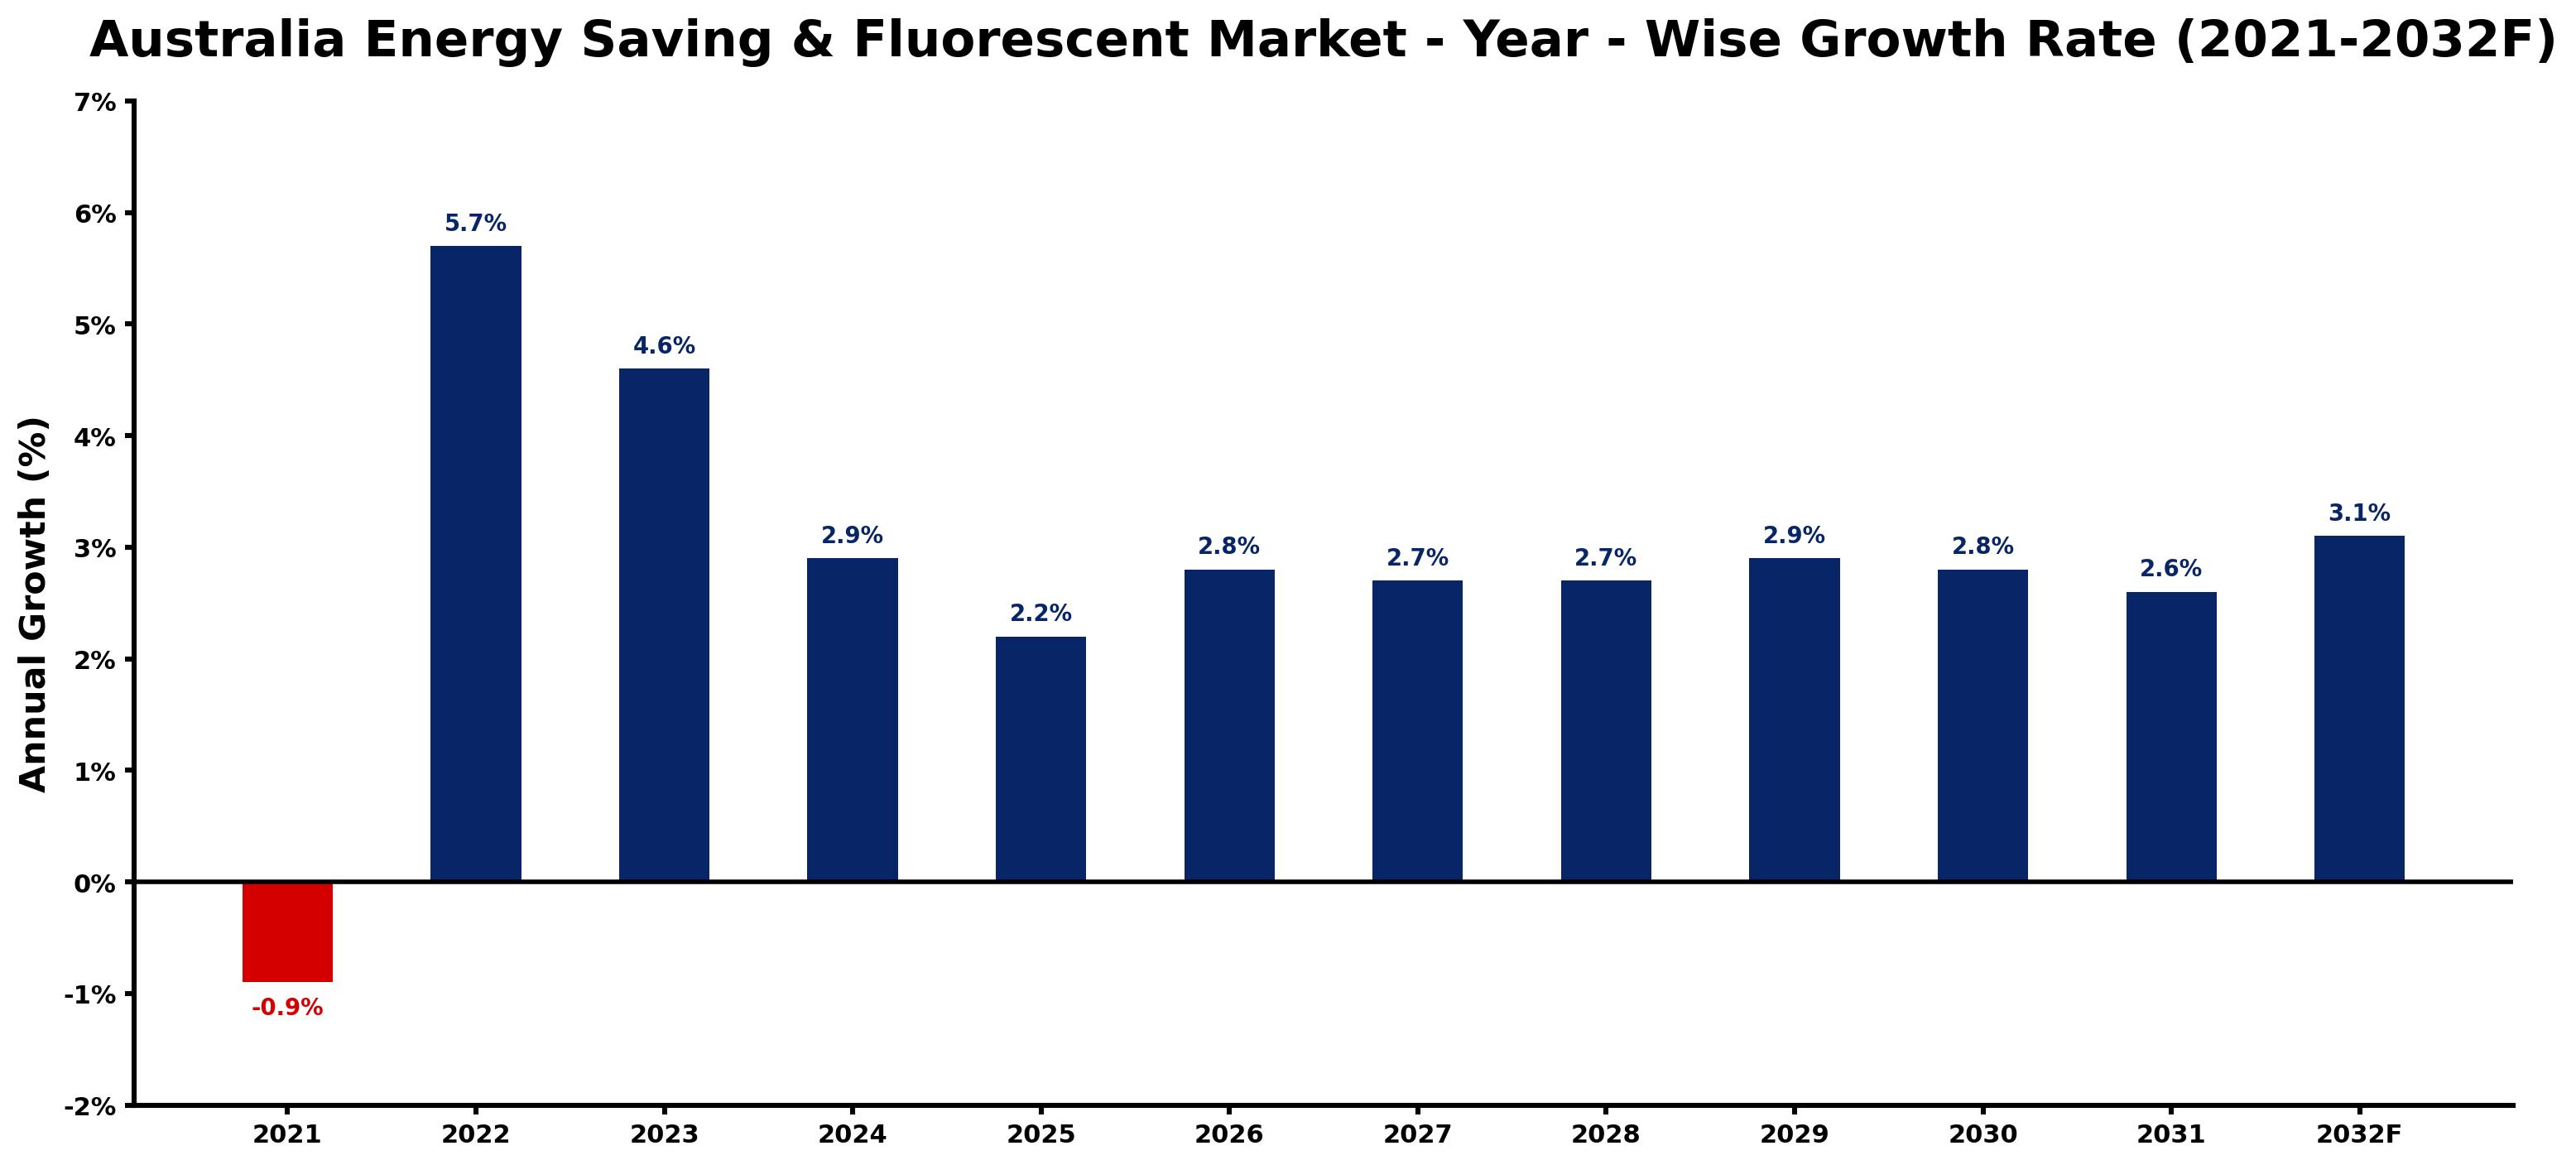
Australia Energy Saving & Fluorescent Market Growth Rate Analysis (2021-2032)
The Australian energy saving and fluorescent market has seen a notable shift from a decline of -0.9% in 2021 to a robust growth of 5.7% in 2022, reflecting increasing consumer demand for energy-efficient solutions amid a nationwide push toward sustainability. This upward trend continued with 4.6% growth in 2023, driven by technological advancements and supportive government policies aimed at reducing carbon emissions. As investment in infrastructure and green technology strengthens, the market is projected to maintain steady growth rates of around 2.2% to 3.1% through 2032. Factors such as the energy transition and heightened environmental awareness are creating a favorable environment for energy-saving products in the coming years.
Australia Energy Saving & Fluorescent Market Year-wise Growth Rate and Key Drivers
This graph highlights how the Australia Energy Saving & Fluorescent Market has steadily grown over the past five years, supported by major growth factors.
The table below presents the year wise growth rates along with the key drivers influencing the market
| Year | Growth Rate | Major Drivers |
| 2021 | -0.9% | Heightened awareness of environmental issues led to increased consumer preference for alternative energy solutions over fluorescent options. |
| 2022 | 5.7% | Corporate social responsibility initiatives increasingly prioritize energy-efficient lighting options. |
| 2023 | 4.6% | Heightened consumer awareness of energy conservation shapes purchasing decisions in households. |
| 2024 | 2.9% | Local manufacturers enhance product offerings with innovative energy-saving technologies. |
| 2025 | 2.2% | Energy-efficient lighting gains traction in urban residential developments, boosting market demand. |
| 2026 | 2.8% | Renewable energy integration encourages the shift toward fluorescent lighting alternatives. |
| 2027 | 2.7% | Smart home innovations include energy-saving lighting systems, attracting tech-savvy consumers. |
| 2028 | 2.7% | Architectural trends favor designs that incorporate natural light and energy-efficient solutions. |
| 2029 | 2.9% | Investment in retrofitting older buildings enhances the appeal of fluorescent lighting systems. |
| 2030 | 2.8% | Emerging environmental certifications motivate businesses to adopt energy-efficient lighting practices. |
| 2031 | 2.6% | Increased competition in the market leads to price reductions and broader consumer access. |
| 2032 | 3.1% | Long-term sustainability goals drive continuous innovation in energy-saving lighting technologies. |
Note - Market size estimations and growth projections presented in this report are based on 6Wresearch's advanced forecasting approach, validated with industry datasets as of June 2026.
Australia Energy Saving & Fluorescent Market Synopsis
The Australia Energy Saving Fluorescent Market is projected to reach 2.8% and witness significant growth during the forecast period (2026-2032). The landscape of this market is shaped by a combination of consumer demand for energy-efficient solutions, increasing awareness of sustainability, and ongoing regulatory frameworks aimed at enhancing energy efficiency. Energy-saving fluorescent lamps, including compact fluorescent lamps (CFLs) and traditional fluorescent tubes, present viable alternatives to older incandescent lighting technologies by offering longer lifespans and substantial energy savings.
Australia Energy Saving & Fluorescent Market Growth Drivers
The growth of the Australia Energy Saving & Fluorescent Market is primarily fueled by several key factors:
- The rise in government initiatives promoting energy-efficient lighting solutions creates a favorable environment for the adoption of energy-saving fluorescent products.
- Consumer awareness regarding the economic benefits of energy conservation is increasing, leading to heightened interest in energy-saving fluorescent lamps.
- Advancements in fluorescent lamp technology have resulted in improved energy efficiencies and extended lifespans, making these products more attractive to a broader customer base.
- The phasing out of less efficient incandescent and traditional fluorescent lamps spurs demand for energy-saving alternatives that meet regulatory standards.
- The increasing focus on sustainability across various sectors encourages businesses and consumers alike to opt for energy-saving fluorescent lighting, aligning with broader environmental goals.
Australia Energy Saving & Fluorescent Market Challenges and Restraints
Despite the positive growth trajectory, the Australia Energy Saving & Fluorescent Market faces several challenges that could hinder progress:
- Competition from alternative lighting technologies, particularly LED solutions, presents a significant challenge, as these technologies continue to gain market share due to their superior energy efficiency and longevity.
- Concerns surrounding mercury content in fluorescent lamps and the complexities associated with their disposal may deter environmentally conscious consumers.
- The need for ongoing research and development within the fluorescent lighting sector is crucial to maintain competitiveness against rapidly evolving lighting technologies.
- Market players must address the public's knowledge gaps regarding the advantages and proper usage of energy-saving fluorescent lamps to enhance market uptake.
- Economic fluctuations and shifts in public policy could impact investment and innovation in the sector, affecting long-term growth prospects.
Australia Energy Saving & Fluorescent Market Government Investment and Initiatives
Government policy is a pivotal driver in shaping the Australia Energy Saving & Fluorescent Market. Initiatives aimed at phasing out traditional lighting technologies have catalyzed the market's gradual transition toward energy-efficient alternatives. Key aspects of government involvement include:
- Implementation of regulatory measures to phase out incandescent bulbs and older fluorescent lamps, compelling consumers to shift towards energy-saving alternatives.
- Support for public awareness campaigns that educate consumers on the benefits of energy-saving fluorescent technologies, promoting informed purchasing decisions.
- Investment in research and innovation to improve the efficiency and performance of fluorescent lighting options, ensuring they remain competitive in a rapidly evolving market.
- Development of energy efficiency labeling programs that guide consumers in identifying and choosing energy-efficient products.
- Establishment of incentives for businesses and institutions to adopt energy-saving fluorescent solutions, thereby accelerating market adoption and reinforcing environmental commitments.
Australia Energy Saving & Fluorescent Market Latest Developments (May 2025 - June 2026)
Recent developments in the Australia Energy Saving & Fluorescent Market indicate a continued shift towards modern lighting technologies. Over the period from May 2025 to June 2026, various trends and activities have emerged:
- Further tightening of regulations regarding energy efficiency has prompted a surge in consumer and business interest in energy-saving fluorescent solutions.
- Ongoing government campaigns aimed at educating the public about the advantages of fluorescent lighting have gained traction, leading to increased sales and awareness.
- Technological advancements in fluorescent lamp designs have been noted, focusing on enhancing energy efficiency and extending the lifespan of the products.
- A notable increase in collaborations between research institutions and manufacturers has emerged, aimed at innovating the fluorescent lighting space and tackling existing challenges.
- Market players have begun exploring new distribution channels and online platforms to reach a broader audience, responding to changing consumer purchasing behaviors.
Australia Energy Saving & Fluorescent Market - Key Attractiveness of the Report
- 10 Years of Market Numbers
- Historical Data Starting from 2022 to 2025
- Base Year: 2025
- Forecast Data until 2032
- Key Performance Indicators Impacting the Market
- Major Upcoming Developments and Projects
Key Highlights of the Report:
- Australia Energy Saving & Fluorescent Market Outlook
- Market Size of Australia Energy Saving & Fluorescent Market, 2025
- Forecast of Australia Energy Saving & Fluorescent Market, 2032
- Historical Data and Forecast of Australia Energy Saving & Fluorescent Revenues & Volume for the Period 2022-2032F
- Australia Energy Saving & Fluorescent Market Trend Evolution
- Australia Energy Saving & Fluorescent Market Drivers and Challenges
- Australia Energy Saving & Fluorescent Price Trends
- Australia Energy Saving & Fluorescent Porter's Five Forces
- Australia Energy Saving & Fluorescent Industry Life Cycle
- Historical Data and Forecast of Australia Energy Saving & Fluorescent Market Revenues & Volume By Sources for the Period 2022-2032F
- Historical Data and Forecast of Australia Energy Saving & Fluorescent Market Revenues & Volume By High-Intensity Discharge Lamps (HID) for the Period 2022-2032F
- Historical Data and Forecast of Australia Energy Saving & Fluorescent Market Revenues & Volume By Linear Fluorescent Lamps (LFL) for the Period 2022-2032F
- Historical Data and Forecast of Australia Energy Saving & Fluorescent Market Revenues & Volume By Light Emitting Diodes (LED) for the Period 2022-2032F
- Historical Data and Forecast of Australia Energy Saving & Fluorescent Market Revenues & Volume By Applications for the Period 2022-2032F
- Historical Data and Forecast of Australia Energy Saving & Fluorescent Market Revenues & Volume By Commercial for the Period 2022-2032F
- Historical Data and Forecast of Australia Energy Saving & Fluorescent Market Revenues & Volume By Residential for the Period 2022-2032F
- Historical Data and Forecast of Australia Energy Saving & Fluorescent Market Revenues & Volume By Government for the Period 2022-2032F
- Australia Energy Saving & Fluorescent Import Export Trade Statistics
- Market Opportunity Assessment By Sources
- Market Opportunity Assessment By Applications
- Australia Energy Saving & Fluorescent Top Companies Market Share
- Australia Energy Saving & Fluorescent Competitive Benchmarking By Technical and Operational Parameters
- Australia Energy Saving & Fluorescent Company Profiles
- Australia Energy Saving & Fluorescent Key Strategic Recommendations
Frequently Asked Questions About the Market Study (FAQs):
The growth is driven by government initiatives, consumer awareness of energy efficiency benefits, and advancements in fluorescent lamp technology.
The market faces challenges such as competition from LED technologies, concerns about mercury content, and the need for continuous product innovation.
The government supports the market through regulations phasing out inefficient lighting technologies, public awareness campaigns, and incentives for adopting energy-saving solutions.
Recent developments include tightening regulations, technological advancements, and increased collaboration between stakeholders to foster innovation.
6Wresearch actively monitors the Australia Energy Saving & Fluorescent Market and publishes its comprehensive annual report, highlighting emerging trends, growth drivers, revenue analysis, and forecast outlook. Our insights help businesses to make data-backed strategic decisions with ongoing market dynamics. Our analysts track relevent industries related to the Australia Energy Saving & Fluorescent Market, allowing our clients with actionable intelligence and reliable forecasts tailored to emerging regional needs.
Yes, we provide customisation as per your requirements. To learn more, feel free to contact us on sales@6wresearch.com
1 Executive Summary |
2 Introduction |
2.1 Key Highlights of the Report |
2.2 Report Description |
2.3 Market Scope & Segmentation |
2.4 Research Methodology |
2.5 Assumptions |
3 Australia Energy Saving & Fluorescent Market Overview |
3.1 Australia Country Macro Economic Indicators |
3.2 Australia Energy Saving & Fluorescent Market Revenues & Volume, 2022 & 2032F |
3.3 Australia Energy Saving & Fluorescent Market - Industry Life Cycle |
3.4 Australia Energy Saving & Fluorescent Market - Porter's Five Forces |
3.5 Australia Energy Saving & Fluorescent Market Revenues & Volume Share, By Sources, 2022 & 2032F |
3.6 Australia Energy Saving & Fluorescent Market Revenues & Volume Share, By Applications, 2022 & 2032F |
4 Australia Energy Saving & Fluorescent Market Dynamics |
4.1 Impact Analysis |
4.2 Market Drivers |
4.2.1 Increasing focus on energy efficiency and sustainability in Australia |
4.2.2 Government initiatives and regulations promoting energy-saving products |
4.2.3 Growing awareness among consumers about the benefits of energy-efficient lighting solutions |
4.3 Market Restraints |
4.3.1 High initial cost of energy-saving and fluorescent lighting products |
4.3.2 Limited availability of energy-saving lighting options in the market |
4.3.3 Lack of consumer education on the long-term cost savings of energy-efficient lighting |
5 Australia Energy Saving & Fluorescent Market Trends |
6 Australia Energy Saving & Fluorescent Market, By Types |
6.1 Australia Energy Saving & Fluorescent Market, By Sources |
6.1.1 Overview and Analysis |
6.1.2 Australia Energy Saving & Fluorescent Market Revenues & Volume, By Sources, 2022-2032F |
6.1.3 Australia Energy Saving & Fluorescent Market Revenues & Volume, By High-Intensity Discharge Lamps (HID), 2022-2032F |
6.1.4 Australia Energy Saving & Fluorescent Market Revenues & Volume, By Linear Fluorescent Lamps (LFL), 2022-2032F |
6.1.5 Australia Energy Saving & Fluorescent Market Revenues & Volume, By Light Emitting Diodes (LED), 2022-2032F |
6.2 Australia Energy Saving & Fluorescent Market, By Applications |
6.2.1 Overview and Analysis |
6.2.2 Australia Energy Saving & Fluorescent Market Revenues & Volume, By Commercial, 2022-2032F |
6.2.3 Australia Energy Saving & Fluorescent Market Revenues & Volume, By Residential, 2022-2032F |
6.2.4 Australia Energy Saving & Fluorescent Market Revenues & Volume, By Government, 2022-2032F |
7 Australia Energy Saving & Fluorescent Market Import-Export Trade Statistics |
7.1 Australia Energy Saving & Fluorescent Market Export to Major Countries |
7.2 Australia Energy Saving & Fluorescent Market Imports from Major Countries |
8 Australia Energy Saving & Fluorescent Market Key Performance Indicators |
8.1 Energy consumption reduction rate in commercial and residential buildings |
8.2 Number of energy-saving products certified by regulatory bodies |
8.3 Percentage of households using energy-saving lighting solutions |
8.4 Energy efficiency rating of buildings in Australia |
8.5 Adoption rate of energy-efficient technologies in the lighting sector |
9 Australia Energy Saving & Fluorescent Market - Opportunity Assessment |
9.1 Australia Energy Saving & Fluorescent Market Opportunity Assessment, By Sources, 2022 & 2032F |
9.2 Australia Energy Saving & Fluorescent Market Opportunity Assessment, By Applications, 2022 & 2032F |
10 Australia Energy Saving & Fluorescent Market - Competitive Landscape |
10.1 Australia Energy Saving & Fluorescent Market Revenue Share, By Companies, 2025 |
10.2 Australia Energy Saving & Fluorescent Market Competitive Benchmarking, By Operating and Technical Parameters |
11 Company Profiles |
12 Recommendations |
13 Disclaimer |
Global Go To Market Strategy - 2030
Export potential enables firms to identify high-growth global markets with greater confidence by combining advanced trade intelligence with a structured quantitative methodology. The framework analyzes emerging demand trends and country-level import patterns while integrating macroeconomic and trade datasets such as GDP and population forecasts, bilateral import–export flows, tariff structures, elasticity differentials between developed and developing economies, geographic distance, and import demand projections. Using weighted trade values from 2020–2024 as the base period to project country-to-country export potential for 2030, these inputs are operationalized through calculated drivers such as gravity model parameters, tariff impact factors, and projected GDP per-capita growth. Through an analysis of hidden potentials, demand hotspots, and market conditions that are most favorable to success, this method enables firms to focus on target countries, maximize returns, and global expansion with data, backed by accuracy.
By factoring in the projected importer demand gap that is currently unmet and could be potential opportunity, it identifies the potential for the Exporter (Country) among 190 countries, against the general trade analysis, which identifies the biggest importer or exporter.
To discover high-growth global markets and optimize your business strategy:
Click Here
Pricing
- Single User License$ 1,995
- Department License$ 2,400
- Site License$ 3,120
- Global License$ 3,795

Leadership Perspectives from Industry Events
Search
Thought Leadership and Analyst Meet


Our Clients
6WResearch In News
- India Air Conditioner Market Set for Strong Rebound in 2026 After Weather-Led Correction and GST-Driven Recovery: 6Wresearch
- ADAS in India: How Automatic Emergency Braking, Blind Spot Detection & Driver Monitoring are Transforming Road Safety
- Doha a strategic location for EV manufacturing hub: IPA Qatar
- Demand for luxury TVs surging in the GCC, says Samsung
- Empowering Growth: The Thriving Journey of Bangladesh’s Cable Industry
- Demand for luxury TVs surging in the GCC, says Samsung
Latest Reports
- Poland Fire Protection Systems Market (2026-2032)
- Cape Verde Portable Hand-Thrown Extinguisher Market (2026-2032)
- Canada Portable Hand-Thrown Extinguisher Market (2026-2032)
- Cameroon Portable Hand-Thrown Extinguisher Market (2026-2032)
- Burundi Portable Hand-Thrown Extinguisher Market (2026-2032)
- Burkina Faso Portable Hand-Thrown Extinguisher Market (2026-2032)
- Bulgaria Portable Hand-Thrown Extinguisher Market (2026-2032)
- Brunei Portable Hand-Thrown Extinguisher Market (2026-2032)
- Botswana Portable Hand-Thrown Extinguisher Market (2026-2032)
- Bosnia and Herzegovina Portable Hand-Thrown Extinguisher Market (2026-2032)
Industry Events and Analyst Meet

HIMTEX 2026

India Refining Summit 2026

India EV Show 2026

EV tech India Expo 2026

Auto Tech Asia 2026
Whitepaper
- Middle East & Africa Commercial Security Market Click here to view more.
- Middle East & Africa Fire Safety Systems & Equipment Market Click here to view more.
- GCC Drone Market Click here to view more.
- Middle East Lighting Fixture Market Click here to view more.
- GCC Physical & Perimeter Security Market Click here to view more.