Australia Inflatable Packers Market (2026-2032) Outlook | Revenue, Growth, Size, Share, Industry, Value, Trends, Analysis, Forecast & Companies
Market Forecast By Types (Single Inflatable Packers, Double Inflatable Packers, Others), By Applications (Geotechnical, Mining, Oil and Gas, Others) And Competitive Landscape
| Product Code: ETC329255 | Publication Date: Aug 2022 | Updated Date: Mar 2026 | Product Type: Market Research Report | |
| Publisher: 6Wresearch | Author: Shubham Padhi | No. of Pages: 75 | No. of Figures: 35 | No. of Tables: 20 |
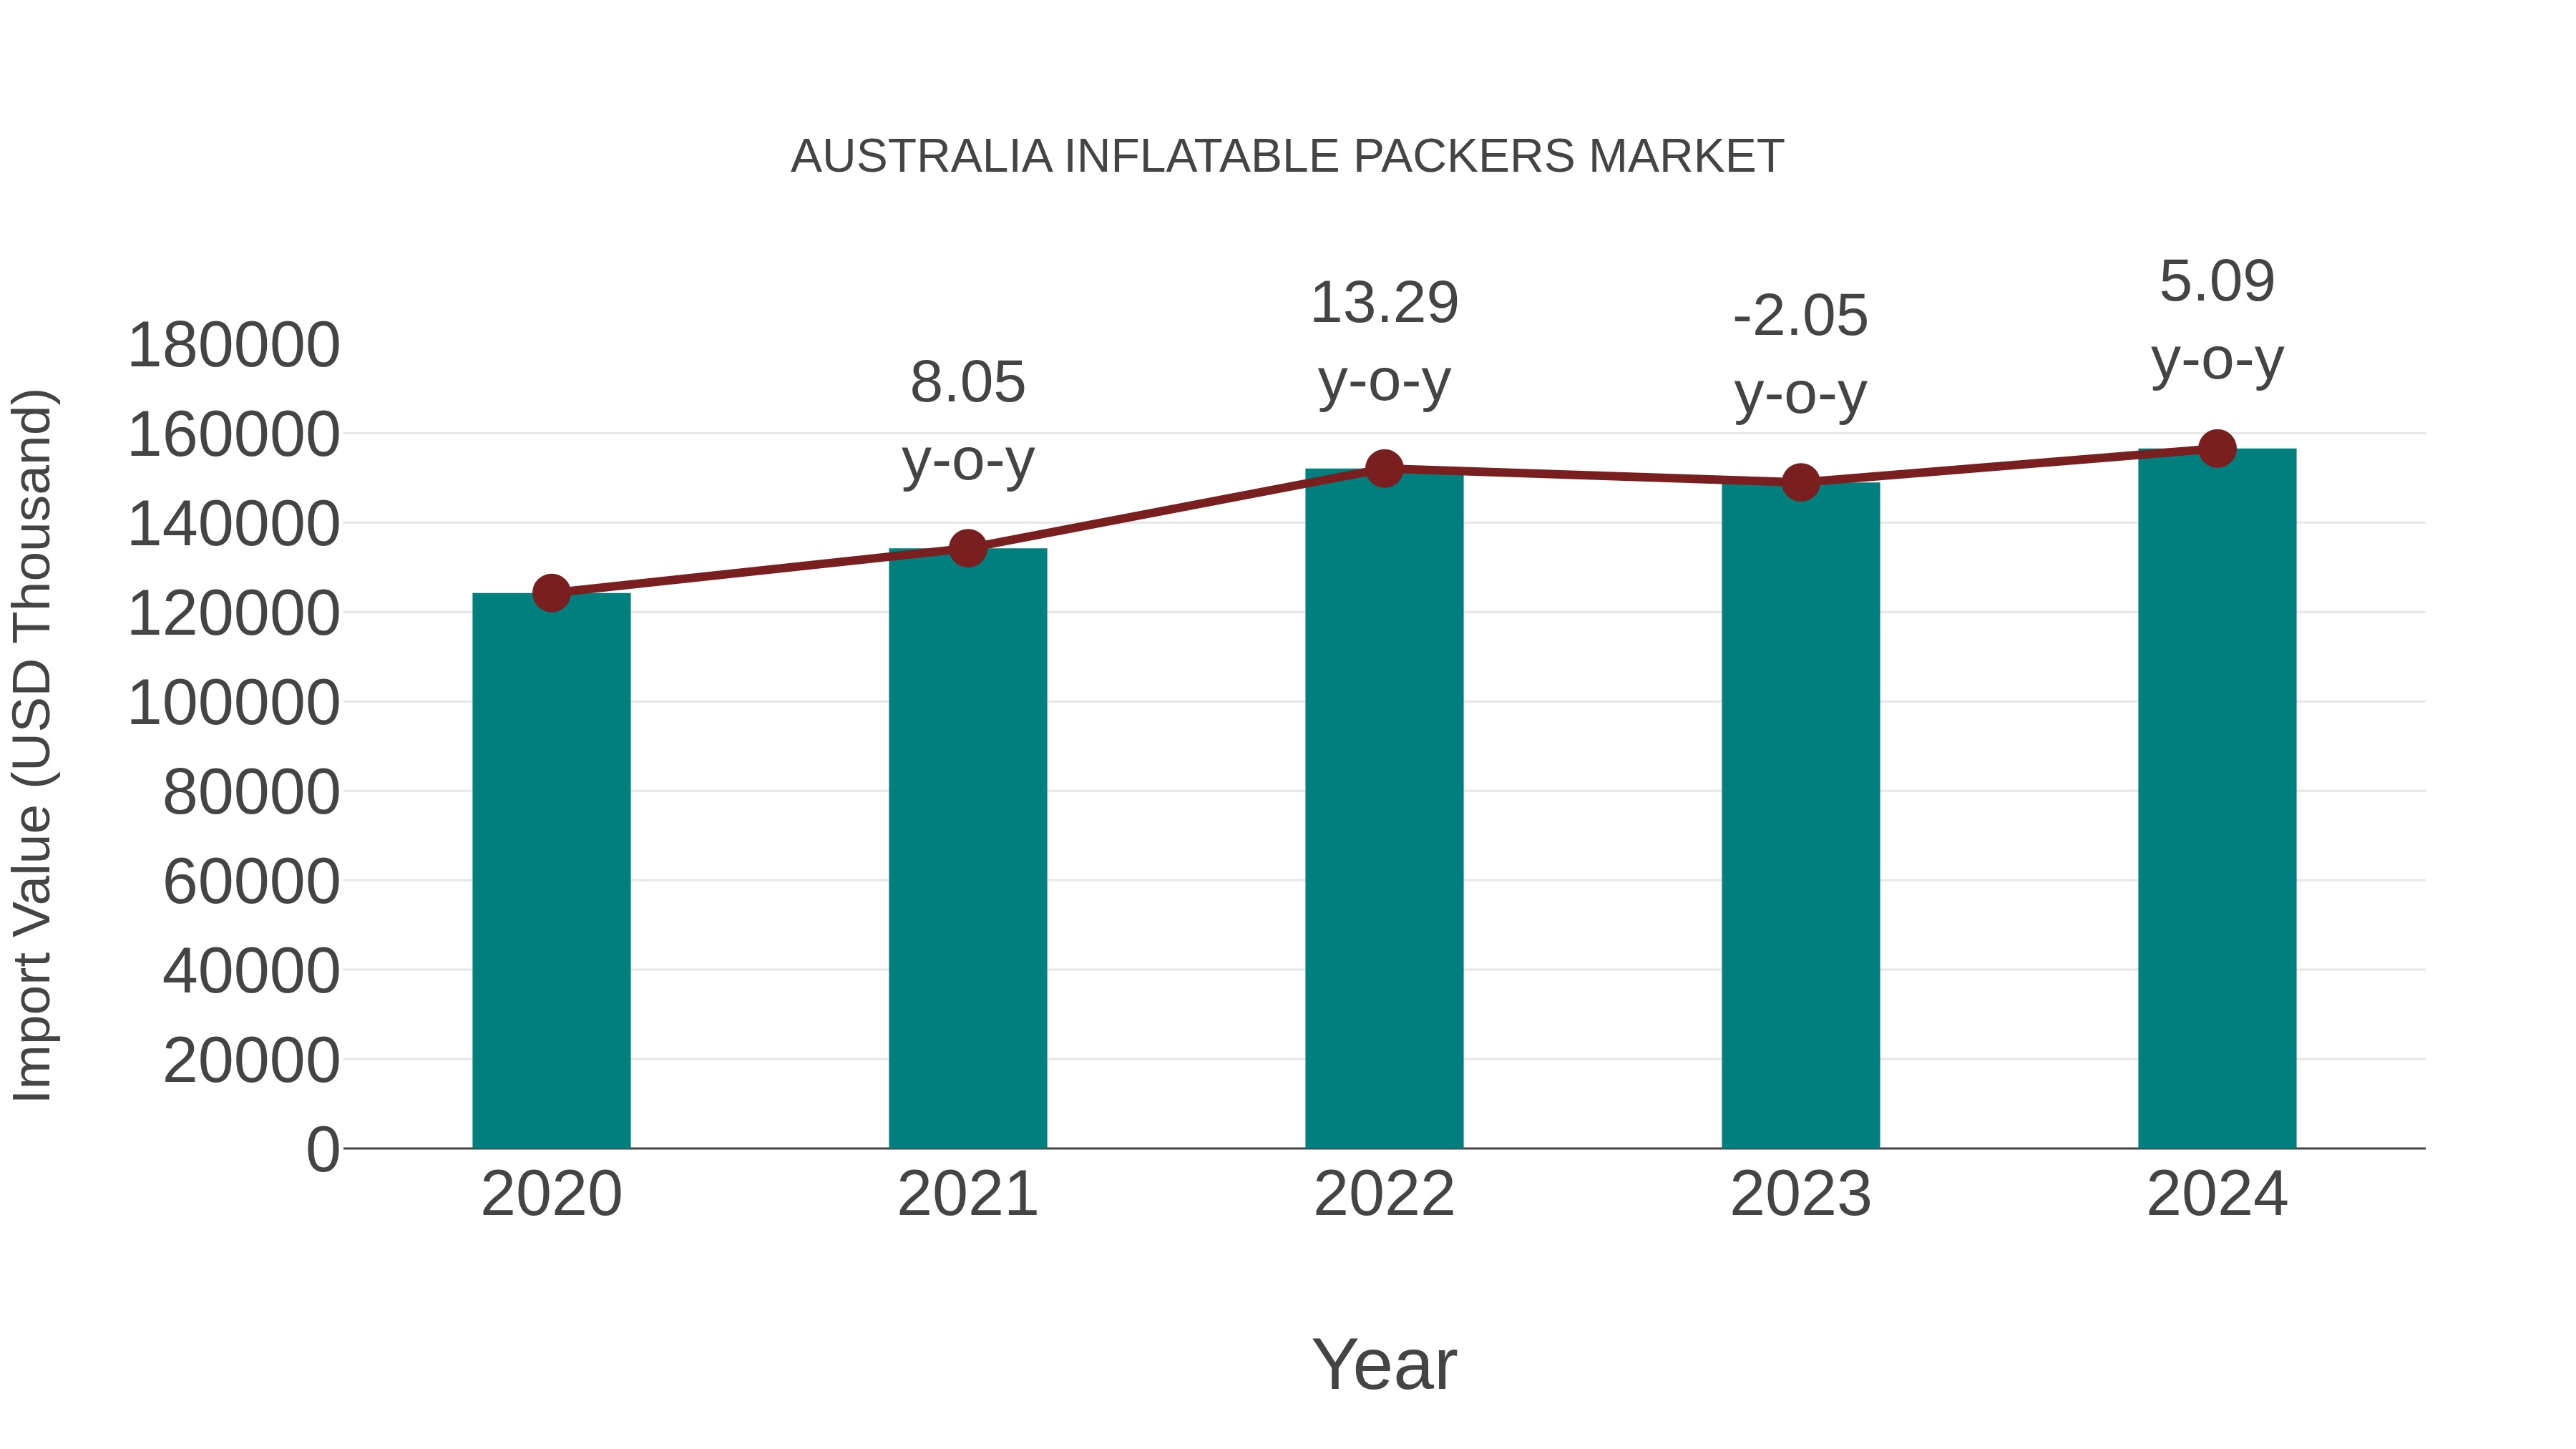
Australia Inflatable Packers Market: Import Trend Analysis
Australia`s import trend for the inflatable packers market exhibited a growth rate of 5.09% from 2023 to 2024, with a compound annual growth rate (CAGR) of 5.95% over the period 2020-2024. This positive import momentum can be attributed to increased demand from the oil and gas sector, driving market stability amidst evolving trade policies.
Australia Inflatable Packers Market Overview
Australia inflatable packers market is experiencing steady growth attributed to their use in well completion, hydrogeological testing, and borehole rehabilitation applications. The demand for inflatable packers for sealing and isolating zones in wells and boreholes is driving market expansion.
Drivers of the market
The Australia Inflatable Packers market is primarily driven by the demand for downhole isolation solutions in oil and gas well completions, geotechnical testing, and groundwater monitoring. With the need for zonal isolation, pressure testing, and fluid control, there is a rising requirement for inflatable packers that offer versatility, durability, and compatibility with different wellbore conditions. Moreover, the expansion of drilling and exploration activities and the emphasis on well integrity further accelerate market growth, driving the adoption of inflatable packer products.
Challenges of the market
In the inflatable packers market, challenges include material durability, pressure rating, and sealing integrity. Manufacturers must develop packers that can withstand high pressures, harsh environments, and repeated inflation cycles while ensuring reliable isolation and zonal control in oil and gas wells, geothermal drilling, and groundwater monitoring applications.
Government Policy of the market
In regulating the inflatable packers market, government policies may focus on product quality, reliability, and environmental protection. Regulations may establish standards for packer materials, inflation methods, and pressure testing procedures to ensure safe and effective use in wellbore operations. Additionally, government oversight may include monitoring of packer disposal and environmental impact assessments to prevent contamination of groundwater resources.
Key Highlights of the Report:
- Australia Inflatable Packers Market Outlook
- Market Size of Australia Inflatable Packers Market, 2025
- Forecast of Australia Inflatable Packers Market, 2032
- Historical Data and Forecast of Australia Inflatable Packers Revenues & Volume for the Period 2022-2032F
- Australia Inflatable Packers Market Trend Evolution
- Australia Inflatable Packers Market Drivers and Challenges
- Australia Inflatable Packers Price Trends
- Australia Inflatable Packers Porter's Five Forces
- Australia Inflatable Packers Industry Life Cycle
- Historical Data and Forecast of Australia Inflatable Packers Market Revenues & Volume By Types for the Period 2022-2032F
- Historical Data and Forecast of Australia Inflatable Packers Market Revenues & Volume By Single Inflatable Packers for the Period 2022-2032F
- Historical Data and Forecast of Australia Inflatable Packers Market Revenues & Volume By Double Inflatable Packers for the Period 2022-2032F
- Historical Data and Forecast of Australia Inflatable Packers Market Revenues & Volume By Others for the Period 2022-2032F
- Historical Data and Forecast of Australia Inflatable Packers Market Revenues & Volume By Applications for the Period 2022-2032F
- Historical Data and Forecast of Australia Inflatable Packers Market Revenues & Volume By Geotechnical for the Period 2022-2032F
- Historical Data and Forecast of Australia Inflatable Packers Market Revenues & Volume By Mining for the Period 2022-2032F
- Historical Data and Forecast of Australia Inflatable Packers Market Revenues & Volume By Oil and Gas for the Period 2022-2032F
- Historical Data and Forecast of Australia Inflatable Packers Market Revenues & Volume By Others for the Period 2022-2032F
- Australia Inflatable Packers Import Export Trade Statistics
- Market Opportunity Assessment By Types
- Market Opportunity Assessment By Applications
- Australia Inflatable Packers Top Companies Market Share
- Australia Inflatable Packers Competitive Benchmarking By Technical and Operational Parameters
- Australia Inflatable Packers Company Profiles
- Australia Inflatable Packers Key Strategic Recommendations
Australia Inflatable Packers Market (2026-2032): FAQs
6Wresearch actively monitors the Australia Inflatable Packers Market and publishes its comprehensive annual report, highlighting emerging trends, growth drivers, revenue analysis, and forecast outlook. Our insights help businesses to make data-backed strategic decisions with ongoing market dynamics. Our analysts track relevent industries related to the Australia Inflatable Packers Market, allowing our clients with actionable intelligence and reliable forecasts tailored to emerging regional needs.
Yes, we provide customisation as per your requirements. To learn more, feel free to contact us on sales@6wresearch.com
1 Executive Summary |
2 Introduction |
2.1 Key Highlights of the Report |
2.2 Report Description |
2.3 Market Scope & Segmentation |
2.4 Research Methodology |
2.5 Assumptions |
3 Australia Inflatable Packers Market Overview |
3.1 Australia Country Macro Economic Indicators |
3.2 Australia Inflatable Packers Market Revenues & Volume, 2022 & 2032F |
3.3 Australia Inflatable Packers Market - Industry Life Cycle |
3.4 Australia Inflatable Packers Market - Porter's Five Forces |
3.5 Australia Inflatable Packers Market Revenues & Volume Share, By Types, 2022 & 2032F |
3.6 Australia Inflatable Packers Market Revenues & Volume Share, By Applications, 2022 & 2032F |
4 Australia Inflatable Packers Market Dynamics |
4.1 Impact Analysis |
4.2 Market Drivers |
4.2.1 Increasing focus on oil and gas exploration activities in Australia |
4.2.2 Growing demand for customized inflatable packers for specific applications |
4.2.3 Technological advancements leading to improved product performance and durability |
4.3 Market Restraints |
4.3.1 Fluctuating raw material prices impacting manufacturing costs |
4.3.2 Stringent regulations and standards for oil and gas equipment in Australia |
4.3.3 Competition from alternative completion tools in the market |
5 Australia Inflatable Packers Market Trends |
6 Australia Inflatable Packers Market, By Types |
6.1 Australia Inflatable Packers Market, By Types |
6.1.1 Overview and Analysis |
6.1.2 Australia Inflatable Packers Market Revenues & Volume, By Types, 2022-2032F |
6.1.3 Australia Inflatable Packers Market Revenues & Volume, By Single Inflatable Packers, 2022-2032F |
6.1.4 Australia Inflatable Packers Market Revenues & Volume, By Double Inflatable Packers, 2022-2032F |
6.1.5 Australia Inflatable Packers Market Revenues & Volume, By Others, 2022-2032F |
6.2 Australia Inflatable Packers Market, By Applications |
6.2.1 Overview and Analysis |
6.2.2 Australia Inflatable Packers Market Revenues & Volume, By Geotechnical, 2022-2032F |
6.2.3 Australia Inflatable Packers Market Revenues & Volume, By Mining, 2022-2032F |
6.2.4 Australia Inflatable Packers Market Revenues & Volume, By Oil and Gas, 2022-2032F |
6.2.5 Australia Inflatable Packers Market Revenues & Volume, By Others, 2022-2032F |
7 Australia Inflatable Packers Market Import-Export Trade Statistics |
7.1 Australia Inflatable Packers Market Export to Major Countries |
7.2 Australia Inflatable Packers Market Imports from Major Countries |
8 Australia Inflatable Packers Market Key Performance Indicators |
8.1 Average lead time for custom inflatable packers |
8.2 Rate of adoption of new technologies in manufacturing processes |
8.3 Percentage of repeat customers indicating product satisfaction |
8.4 Number of successful collaborations with oil and gas companies for product development |
8.5 Percentage of market share in specific application segments |
9 Australia Inflatable Packers Market - Opportunity Assessment |
9.1 Australia Inflatable Packers Market Opportunity Assessment, By Types, 2022 & 2032F |
9.2 Australia Inflatable Packers Market Opportunity Assessment, By Applications, 2022 & 2032F |
10 Australia Inflatable Packers Market - Competitive Landscape |
10.1 Australia Inflatable Packers Market Revenue Share, By Companies, 2025 |
10.2 Australia Inflatable Packers Market Competitive Benchmarking, By Operating and Technical Parameters |
11 Company Profiles |
12 Recommendations |
13 Disclaimer |
Global Go To Market Strategy - 2030
Export potential enables firms to identify high-growth global markets with greater confidence by combining advanced trade intelligence with a structured quantitative methodology. The framework analyzes emerging demand trends and country-level import patterns while integrating macroeconomic and trade datasets such as GDP and population forecasts, bilateral import–export flows, tariff structures, elasticity differentials between developed and developing economies, geographic distance, and import demand projections. Using weighted trade values from 2020–2024 as the base period to project country-to-country export potential for 2030, these inputs are operationalized through calculated drivers such as gravity model parameters, tariff impact factors, and projected GDP per-capita growth. Through an analysis of hidden potentials, demand hotspots, and market conditions that are most favorable to success, this method enables firms to focus on target countries, maximize returns, and global expansion with data, backed by accuracy.
By factoring in the projected importer demand gap that is currently unmet and could be potential opportunity, it identifies the potential for the Exporter (Country) among 190 countries, against the general trade analysis, which identifies the biggest importer or exporter.
To discover high-growth global markets and optimize your business strategy:
Click Here
Pricing
- Single User License$ 1,995
- Department License$ 2,400
- Site License$ 3,120
- Global License$ 3,795

Leadership Perspectives from Industry Events
Search
Thought Leadership and Analyst Meet


Our Clients
6WResearch In News
- India Air Conditioner Market Set for Strong Rebound in 2026 After Weather-Led Correction and GST-Driven Recovery: 6Wresearch
- ADAS in India: How Automatic Emergency Braking, Blind Spot Detection & Driver Monitoring are Transforming Road Safety
- Doha a strategic location for EV manufacturing hub: IPA Qatar
- Demand for luxury TVs surging in the GCC, says Samsung
- Empowering Growth: The Thriving Journey of Bangladesh’s Cable Industry
- Demand for luxury TVs surging in the GCC, says Samsung
Latest Reports
- Poland Fire Protection Systems Market (2026-2032)
- Cape Verde Portable Hand-Thrown Extinguisher Market (2026-2032)
- Canada Portable Hand-Thrown Extinguisher Market (2026-2032)
- Cameroon Portable Hand-Thrown Extinguisher Market (2026-2032)
- Burundi Portable Hand-Thrown Extinguisher Market (2026-2032)
- Burkina Faso Portable Hand-Thrown Extinguisher Market (2026-2032)
- Bulgaria Portable Hand-Thrown Extinguisher Market (2026-2032)
- Brunei Portable Hand-Thrown Extinguisher Market (2026-2032)
- Botswana Portable Hand-Thrown Extinguisher Market (2026-2032)
- Bosnia and Herzegovina Portable Hand-Thrown Extinguisher Market (2026-2032)
Industry Events and Analyst Meet

HIMTEX 2026

India Refining Summit 2026

India EV Show 2026

EV tech India Expo 2026

Auto Tech Asia 2026
Whitepaper
- Middle East & Africa Commercial Security Market Click here to view more.
- Middle East & Africa Fire Safety Systems & Equipment Market Click here to view more.
- GCC Drone Market Click here to view more.
- Middle East Lighting Fixture Market Click here to view more.
- GCC Physical & Perimeter Security Market Click here to view more.