Australia Pneumatic Valves Market (2026-2032) | Companies, Analysis, Trends, Size, Value, Growth, Outlook, Revenue, Industry, Forecast, Share
Market Forecast By Product Type (Sliding shaft, Rotating shaft), By End-Users (Chemicals and petrochemicals, Power generation and management, Mining, Water and wastewater management) And Competitive Landscape
| Product Code: ETC024055 | Publication Date: Oct 2020 | Updated Date: Jun 2026 | Product Type: Report | |
| Publisher: 6Wresearch | Author: Ravi Bhandari | No. of Pages: 70 | No. of Figures: 35 | No. of Tables: 5 |
Australia Pneumatic Valves Market Summary
The australia pneumatic valves market was estimated at USD 236 Million in 2025 and is projected to reach USD 278 Million by 2032, growing at a CAGR of 2.6% from 2026 to 2032.
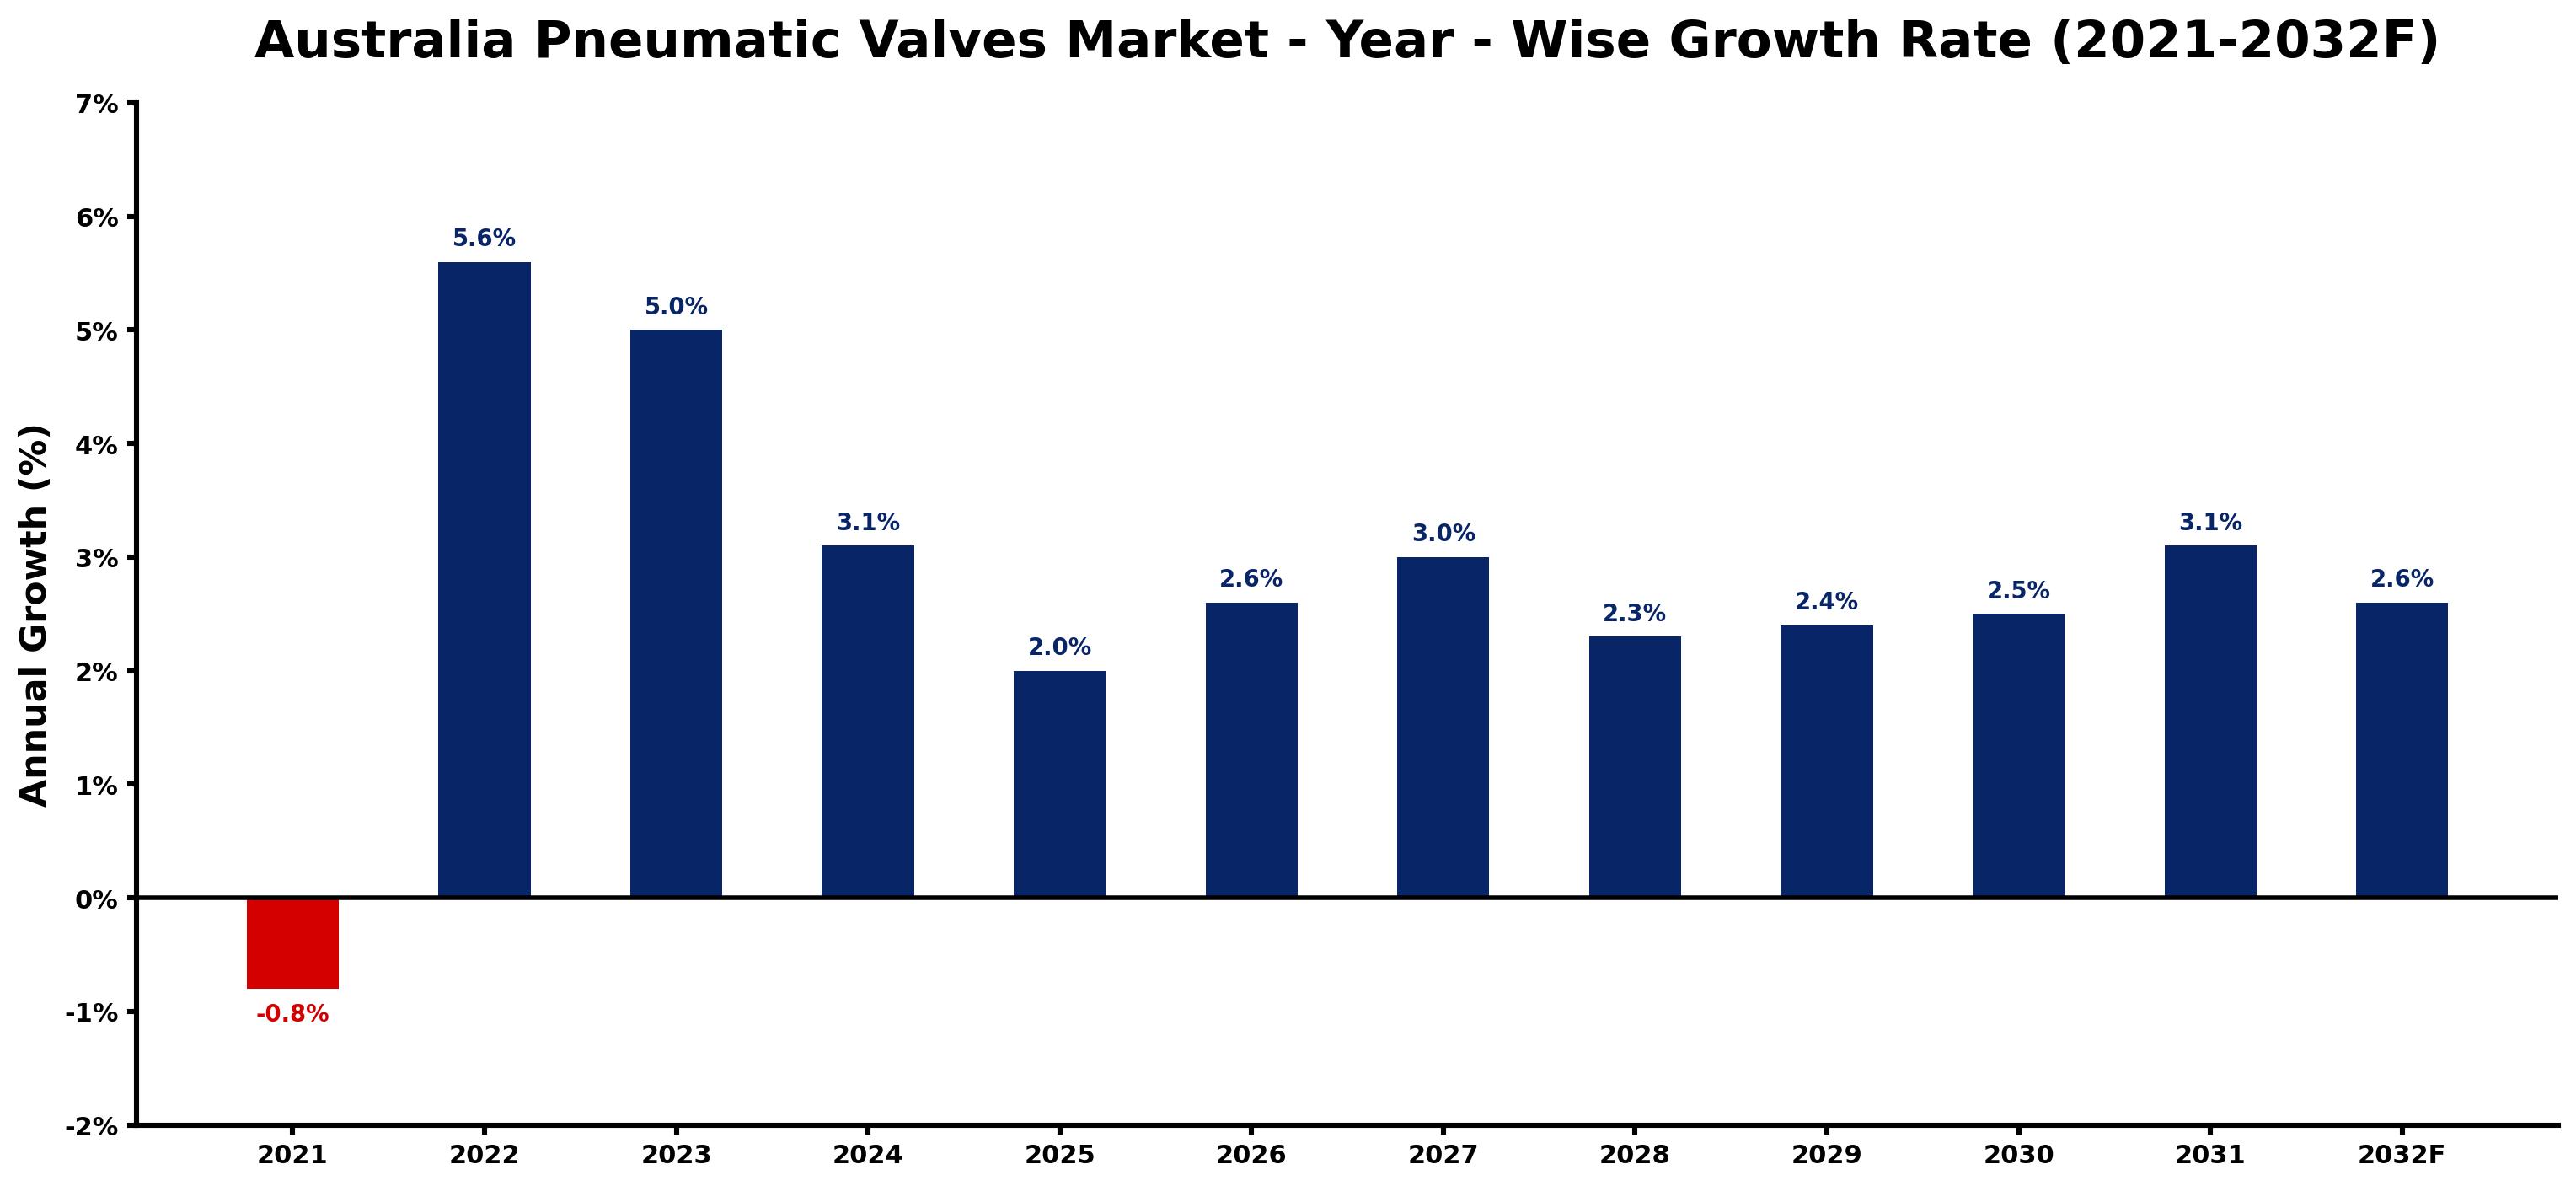
Australia Pneumatic Valves Market Growth Rate Analysis (2021-2032)
The Australia pneumatic valves market experienced a notable fluctuation in growth rates over the past few years, starting with a decline of 0.8% in 2021, largely due to pandemic-related disruptions. However, the tide turned in 2022, as the market rebounded with a robust growth of 5.6%, driven by increased investments in infrastructure and a rising demand for automation in various industries. This upward trend continued with an expected 5.0% growth in 2023, supported by advancements in technology and shifts towards more energy-efficient solutions. The growth rate is projected to stabilize at around 2.0% to 3.1% from 2024 to 2032, reflecting ongoing consumer demand and the gradual recovery of industrial activities.
Australia Pneumatic Valves Market Year-wise Growth Rate and Key Drivers
This graph highlights how the Australia Pneumatic Valves Market has steadily grown over the past five years, supported by major growth factors.
The table below presents the year wise growth rates along with the key drivers influencing the market
| Year | Growth Rate | Major Drivers |
| 2021 | -0.8% | Supply chain disruptions caused by prolonged lockdowns hindered production and delayed project completions in key industries. |
| 2022 | 5.6% | Manufacturing sectors started to recognize the importance of reliable pneumatic systems. |
| 2023 | 5.0% | Critical infrastructure projects highlighted the necessity for advanced fluid control solutions. |
| 2024 | 3.1% | Emerging technologies in industrial machinery spurred demand for innovative pneumatic valves. |
| 2025 | 2.0% | A shift towards smart manufacturing required enhanced performance from pneumatic components. |
| 2026 | 2.6% | Sustainability goals led many firms to invest in more efficient pneumatic systems. |
| 2027 | 3.0% | Supply chain recovery emphasized the need for robust industrial automation solutions. |
| 2028 | 2.3% | Regional manufacturers began exploring localized production of pneumatic components. |
| 2029 | 2.4% | Heavy industries increasingly integrated pneumatic valves for improved operational effectiveness. |
| 2030 | 2.5% | Investment in renewable energy sectors drove the need for specialized pneumatic applications. |
| 2031 | 3.1% | Technological convergence in industries necessitated advanced fluid control technologies. |
| 2032 | 2.6% | Collaborative ventures between firms enhanced the development of customized pneumatic solutions. |
Note - Market size estimations and growth projections presented in this report are based on 6Wresearch's advanced forecasting approach, validated with industry datasets as of June 2026.
Australia Pneumatic Valves Market Synopsis
The Australia Pneumatic Valves Market is projected to reach 2.6% and witness significant growth during the forecast period (2026-2032). This market is primarily driven by the increasing automation across various industries, including manufacturing, mining, and energy. Pneumatic valves are vital components in controlling air pressure and fluid flow within industrial machinery, thereby enhancing operational efficiency. Moreover, the transition towards energy-efficient and smart pneumatic systems is actively shaping the growth trajectory of this sector. Despite potential challenges from maintenance costs and competition with electronic valve systems, the market presents promising opportunities for innovation and investment.
Australia Pneumatic Valves Market Growth Drivers
The demand for pneumatic valves in Australia is surging due to several key drivers:
- Increased automation of industrial processes is leading to a higher need for sophisticated pneumatic systems to enhance production efficiency across various sectors.
- The expansion of the manufacturing sector, coupled with the growth in construction activities, is fostering the demand for reliable fluid control solutions.
- Industries such as mining, oil and gas, and food processing are increasingly relying on pneumatic valves for ensuring operational reliability and efficiency.
- The push for energy-efficient technologies is driving innovations in pneumatic systems, prompting industries to upgrade their existing infrastructures.
- Furthermore, the growing focus on safety standards in industrial applications is amplifying the need for high-quality pneumatic components that meet stringent performance criteria.
Australia Pneumatic Valves Market Challenges and Restraints
Despite the promising growth prospects, the Australia Pneumatic Valves Market faces several challenges:
- The market is significantly impacted by its dependency on imported pneumatic components, which can lead to vulnerabilities in supply chain management.
- Fluctuations in industrial demand due to economic cycles can hinder consistent market growth and investment planning.
- Technological advancements in automated valve systems necessitate ongoing innovation, which can impose substantial costs on manufacturers.
- Maintenance costs associated with pneumatic systems can be relatively high, particularly for older installations that require upgrades or replacements.
- Increased competition from electronic valve systems offers an alternative for end-users seeking advanced control solutions, potentially limiting the market share of pneumatic valves.
Australia Pneumatic Valves Market Investment Opportunities
The Australia Pneumatic Valves Market is poised for various investment opportunities driven by current trends:
- Investing in research and development initiatives focused on creating energy-efficient and high-performance pneumatic valve systems can yield significant returns.
- The growing trend towards smart pneumatic solutions presents opportunities for companies to integrate IoT technologies in their products to enhance functionality and usability.
- Investors may find potential in upgrading existing pneumatic systems to meet new energy efficiency standards and performance benchmarks.
- Enhancements in manufacturing processes through automation and robotics can provide avenues for innovative pneumatic valve solutions tailored to modern applications.
- Strategic partnerships and collaborations with technology firms can facilitate the development of next-generation pneumatic control systems that meet evolving industry demands.
Australia Pneumatic Valves Market Government Investment and Initiatives
The Australian government plays a pivotal role in shaping the pneumatic valves market through various policies and initiatives:
- The government enforces Australian Standards (AS) regulations to ensure quality and safety within industrial applications, thereby enhancing market credibility.
- Compliance with the Work Health and Safety (WHS) Act mandates that pneumatic systems adhere to strict performance and safety requirements, mirroring the government's commitment to occupational safety.
- Local manufacturing is encouraged through industry grants and tax incentives aimed at promoting research and development in advanced valve technologies.
- Government investments in infrastructure projects drive demand for pneumatic valves, particularly in sectors such as construction and utilities.
- Policies promoting sustainable industrial practices further support the adoption of energy-efficient pneumatic systems, aligning with national climate goals.
Australia Pneumatic Valves Market Latest Developments (May 2025 - June 2026)
Recent developments within the Australia Pneumatic Valves Market from May 2025 to June 2026 have reflected a notable shift towards high-performance solutions:
- There has been an increasing trend in the adoption of smart pneumatic technologies, which integrate advanced sensors and IoT capabilities for enhanced operational monitoring.
- The industry is witnessing innovations aimed at reducing maintenance costs and increasing lifespan through the development of robust materials and designs.
- Companies are focusing on sustainability, with new product lines being introduced that meet energy efficiency standards and reduce environmental impact.
- Strategic partnerships among tech companies and manufacturers have emerged to enhance product offerings and accelerate research into smart automation solutions.
- Conferences and forums dedicated to industrial automation have emphasized the importance of pneumatic valves in achieving greater operational efficiency across sectors.
Australia Pneumatic Valves Market - Key Attractiveness of the Report
- 10 Years of Market Numbers
- Historical Data Starting from 2022 to 2025
- Base Year: 2025
- Forecast Data until 2032
- Key Performance Indicators Impacting the Market
- Major Upcoming Developments and Projects
Key Highlights of the Report:
- Australia Pneumatic Valves Market Outlook
- Market Size of Australia Pneumatic Valves Market, 2025
- Forecast of Australia Pneumatic Valves Market, 2032
- Historical Data and Forecast of Australia Pneumatic Valves Revenues & Volume for the Period 2022-2032F
- Australia Pneumatic Valves Market Trend Evolution
- Australia Pneumatic Valves Market Drivers and Challenges
- Australia Pneumatic Valves Price Trends
- Australia Pneumatic Valves Porter's Five Forces
- Australia Pneumatic Valves Industry Life Cycle
- Historical Data and Forecast of Australia Pneumatic Valves Market Revenues & Volume By Product Type for the Period 2022-2032F
- Historical Data and Forecast of Australia Pneumatic Valves Market Revenues & Volume By Sliding shaft for the Period 2022-2032F
- Historical Data and Forecast of Australia Pneumatic Valves Market Revenues & Volume By Rotating shaft for the Period 2022-2032F
- Historical Data and Forecast of Australia Pneumatic Valves Market Revenues & Volume By End-Users for the Period 2022-2032F
- Historical Data and Forecast of Australia Pneumatic Valves Market Revenues & Volume By Chemicals and petrochemicals for the Period 2022-2032F
- Historical Data and Forecast of Australia Pneumatic Valves Market Revenues & Volume By Power generation and management for the Period 2022-2032F
- Historical Data and Forecast of Australia Pneumatic Valves Market Revenues & Volume By Mining for the Period 2022-2032F
- Historical Data and Forecast of Australia Pneumatic Valves Market Revenues & Volume By Water and wastewater management? for the Period 2022-2032F
- Australia Pneumatic Valves Import Export Trade Statistics
- Market Opportunity Assessment By Product Type
- Market Opportunity Assessment By End-Users
- Australia Pneumatic Valves Top Companies Market Share
- Australia Pneumatic Valves Competitive Benchmarking By Technical and Operational Parameters
- Australia Pneumatic Valves Company Profiles
- Australia Pneumatic Valves Key Strategic Recommendations
Frequently Asked Questions About the Market Study (FAQs):
The key drivers include increased industrial automation, expansion of the manufacturing sector, and the push for energy-efficient technologies across various industries.
Challenges include import dependency, fluctuations in industrial demand, and the high costs associated with maintenance and technological innovation.
Investment opportunities are found in developing energy-efficient systems, integrating smart technologies, and upgrading existing infrastructure to meet modern standards.
The Australian government influences the market through regulations ensuring safety, promoting local manufacturing, and investing in infrastructure that drives demand for pneumatic solutions.
6Wresearch actively monitors the Australia Pneumatic Valves Market and publishes its comprehensive annual report, highlighting emerging trends, growth drivers, revenue analysis, and forecast outlook. Our insights help businesses to make data-backed strategic decisions with ongoing market dynamics. Our analysts track relevent industries related to the Australia Pneumatic Valves Market, allowing our clients with actionable intelligence and reliable forecasts tailored to emerging regional needs.
Yes, we provide customisation as per your requirements. To learn more, feel free to contact us on sales@6wresearch.com
1 Executive Summary |
2 Introduction |
2.1 Key Highlights of the Report |
2.2 Report Description |
2.3 Market Scope & Segmentation |
2.4 Research Methodology |
2.5 Assumptions |
3 Australia Pneumatic Valves Market Overview |
3.1 Australia Country Macro Economic Indicators |
3.2 Australia Pneumatic Valves Market Revenues & Volume, 2022 & 2032F |
3.3 Australia Pneumatic Valves Market - Industry Life Cycle |
3.4 Australia Pneumatic Valves Market - Porter's Five Forces |
3.5 Australia Pneumatic Valves Market Revenues & Volume Share, By Product Type, 2022 & 2032F |
3.6 Australia Pneumatic Valves Market Revenues & Volume Share, By End-Users, 2022 & 2032F |
4 Australia Pneumatic Valves Market Dynamics |
4.1 Impact Analysis |
4.2 Market Drivers |
4.2.1 Increasing demand for automation across industries in Australia |
4.2.2 Growing focus on energy efficiency and sustainability |
4.2.3 Technological advancements in pneumatic valve systems |
4.3 Market Restraints |
4.3.1 High initial investment costs associated with pneumatic valve systems |
4.3.2 Limited availability of skilled workforce for installation and maintenance |
4.3.3 Fluctuating raw material prices affecting manufacturing costs |
5 Australia Pneumatic Valves Market Trends |
6 Australia Pneumatic Valves Market, By Types |
6.1 Australia Pneumatic Valves Market, By Product Type |
6.1.1 Overview and Analysis |
6.1.2 Australia Pneumatic Valves Market Revenues & Volume, By Product Type, 2022-2032F |
6.1.3 Australia Pneumatic Valves Market Revenues & Volume, By Sliding shaft, 2022-2032F |
6.1.4 Australia Pneumatic Valves Market Revenues & Volume, By Rotating shaft, 2022-2032F |
6.2 Australia Pneumatic Valves Market, By End-Users |
6.2.1 Overview and Analysis |
6.2.2 Australia Pneumatic Valves Market Revenues & Volume, By Chemicals and petrochemicals, 2022-2032F |
6.2.3 Australia Pneumatic Valves Market Revenues & Volume, By Power generation and management, 2022-2032F |
6.2.4 Australia Pneumatic Valves Market Revenues & Volume, By Mining, 2022-2032F |
6.2.5 Australia Pneumatic Valves Market Revenues & Volume, By Water and wastewater management , 2022-2032F |
7 Australia Pneumatic Valves Market Import-Export Trade Statistics |
7.1 Australia Pneumatic Valves Market Export to Major Countries |
7.2 Australia Pneumatic Valves Market Imports from Major Countries |
8 Australia Pneumatic Valves Market Key Performance Indicators |
8.1 Adoption rate of pneumatic valve systems in key industries |
8.2 Rate of implementation of energy-efficient pneumatic valve technologies |
8.3 Number of research and development initiatives in the pneumatic valve sector |
8.4 Percentage of companies investing in pneumatic valve automation solutions |
8.5 Efficiency improvements achieved through the use of pneumatic valve systems |
9 Australia Pneumatic Valves Market - Opportunity Assessment |
9.1 Australia Pneumatic Valves Market Opportunity Assessment, By Product Type, 2022 & 2032F |
9.2 Australia Pneumatic Valves Market Opportunity Assessment, By End-Users, 2022 & 2032F |
10 Australia Pneumatic Valves Market - Competitive Landscape |
10.1 Australia Pneumatic Valves Market Revenue Share, By Companies, 2025 |
10.2 Australia Pneumatic Valves Market Competitive Benchmarking, By Operating and Technical Parameters |
11 Company Profiles |
12 Recommendations |
13 Disclaimer |
Global Go To Market Strategy - 2030
Export potential enables firms to identify high-growth global markets with greater confidence by combining advanced trade intelligence with a structured quantitative methodology. The framework analyzes emerging demand trends and country-level import patterns while integrating macroeconomic and trade datasets such as GDP and population forecasts, bilateral import–export flows, tariff structures, elasticity differentials between developed and developing economies, geographic distance, and import demand projections. Using weighted trade values from 2020–2024 as the base period to project country-to-country export potential for 2030, these inputs are operationalized through calculated drivers such as gravity model parameters, tariff impact factors, and projected GDP per-capita growth. Through an analysis of hidden potentials, demand hotspots, and market conditions that are most favorable to success, this method enables firms to focus on target countries, maximize returns, and global expansion with data, backed by accuracy.
By factoring in the projected importer demand gap that is currently unmet and could be potential opportunity, it identifies the potential for the Exporter (Country) among 190 countries, against the general trade analysis, which identifies the biggest importer or exporter.
To discover high-growth global markets and optimize your business strategy:
Click Here
Pricing
- Single User License$ 1,995
- Department License$ 2,400
- Site License$ 3,120
- Global License$ 3,795

Leadership Perspectives from Industry Events
Search
Thought Leadership and Analyst Meet


Our Clients
6WResearch In News
- India Air Conditioner Market Set for Strong Rebound in 2026 After Weather-Led Correction and GST-Driven Recovery: 6Wresearch
- ADAS in India: How Automatic Emergency Braking, Blind Spot Detection & Driver Monitoring are Transforming Road Safety
- Doha a strategic location for EV manufacturing hub: IPA Qatar
- Demand for luxury TVs surging in the GCC, says Samsung
- Empowering Growth: The Thriving Journey of Bangladesh’s Cable Industry
- Demand for luxury TVs surging in the GCC, says Samsung
Latest Reports
- Poland Fire Protection Systems Market (2026-2032)
- Cape Verde Portable Hand-Thrown Extinguisher Market (2026-2032)
- Canada Portable Hand-Thrown Extinguisher Market (2026-2032)
- Cameroon Portable Hand-Thrown Extinguisher Market (2026-2032)
- Burundi Portable Hand-Thrown Extinguisher Market (2026-2032)
- Burkina Faso Portable Hand-Thrown Extinguisher Market (2026-2032)
- Bulgaria Portable Hand-Thrown Extinguisher Market (2026-2032)
- Brunei Portable Hand-Thrown Extinguisher Market (2026-2032)
- Botswana Portable Hand-Thrown Extinguisher Market (2026-2032)
- Bosnia and Herzegovina Portable Hand-Thrown Extinguisher Market (2026-2032)
Industry Events and Analyst Meet

HIMTEX 2026

India Refining Summit 2026

India EV Show 2026

EV tech India Expo 2026

Auto Tech Asia 2026
Whitepaper
- Middle East & Africa Commercial Security Market Click here to view more.
- Middle East & Africa Fire Safety Systems & Equipment Market Click here to view more.
- GCC Drone Market Click here to view more.
- Middle East Lighting Fixture Market Click here to view more.
- GCC Physical & Perimeter Security Market Click here to view more.