Australia Sodium Chlorate Market (2026-2032) Outlook | Trends, Companies, Share, Growth, Industry, Value, Revenue, Size, Analysis, Forecast
Market Forecast By Form (Crystalline, Solution), By Application (Bleaching Agent, Oxidizing Agent, Herbicide, Water Treatment, Others) And Competitive Landscape
| Product Code: ETC103614 | Publication Date: Jun 2021 | Updated Date: Jun 2026 | Product Type: Report | |
| Publisher: 6Wresearch | Author: Ravi Bhandari | No. of Pages: 70 | No. of Figures: 35 | No. of Tables: 5 |
Australia Sodium Chlorate Market Size, Share & Growth Rate
The Australia Sodium Chlorate Market was estimated at USD 135 Million in 2025 and is projected to reach USD 158 Million by 2032, growing at a CAGR of 2.3% from 2026 to 2032. This growth trajectory is primarily driven by the demand for sodium chlorate as a critical bleaching agent in the pulp and paper industry, which remains a significant sector of the Australian economy. Moreover, the industry's ongoing transition towards more sustainable practices and innovations in production technologies plays a crucial role in supporting this growth.
Australia Sodium Chlorate Market Growth Rate Analysis (2021-2032)
The Australia sodium chlorate market has exhibited a notable recovery following a brief decline of 0.5% in 2021. In 2022, growth surged to 5.3%, largely driven by heightened demand in the pulp and paper industry, supported by increased consumer engagement in sustainable products. This momentum continued with a steady 4.5% increase in 2023, as energy transition initiatives prompted investments in green technologies, further boosting demand. While growth is projected to moderate in subsequent years—from 2.9% in 2024 to around 2.3% in 2026—an upward trend is expected through 2032, spurred by consistent industrial demand and favorable policy environments encouraging sustainable practices.
Australia Sodium Chlorate Market Year-wise Growth Rate and Key Drivers
This graph highlights how the Australia Sodium Chlorate Market has steadily grown over the past five years, supported by major growth factors.
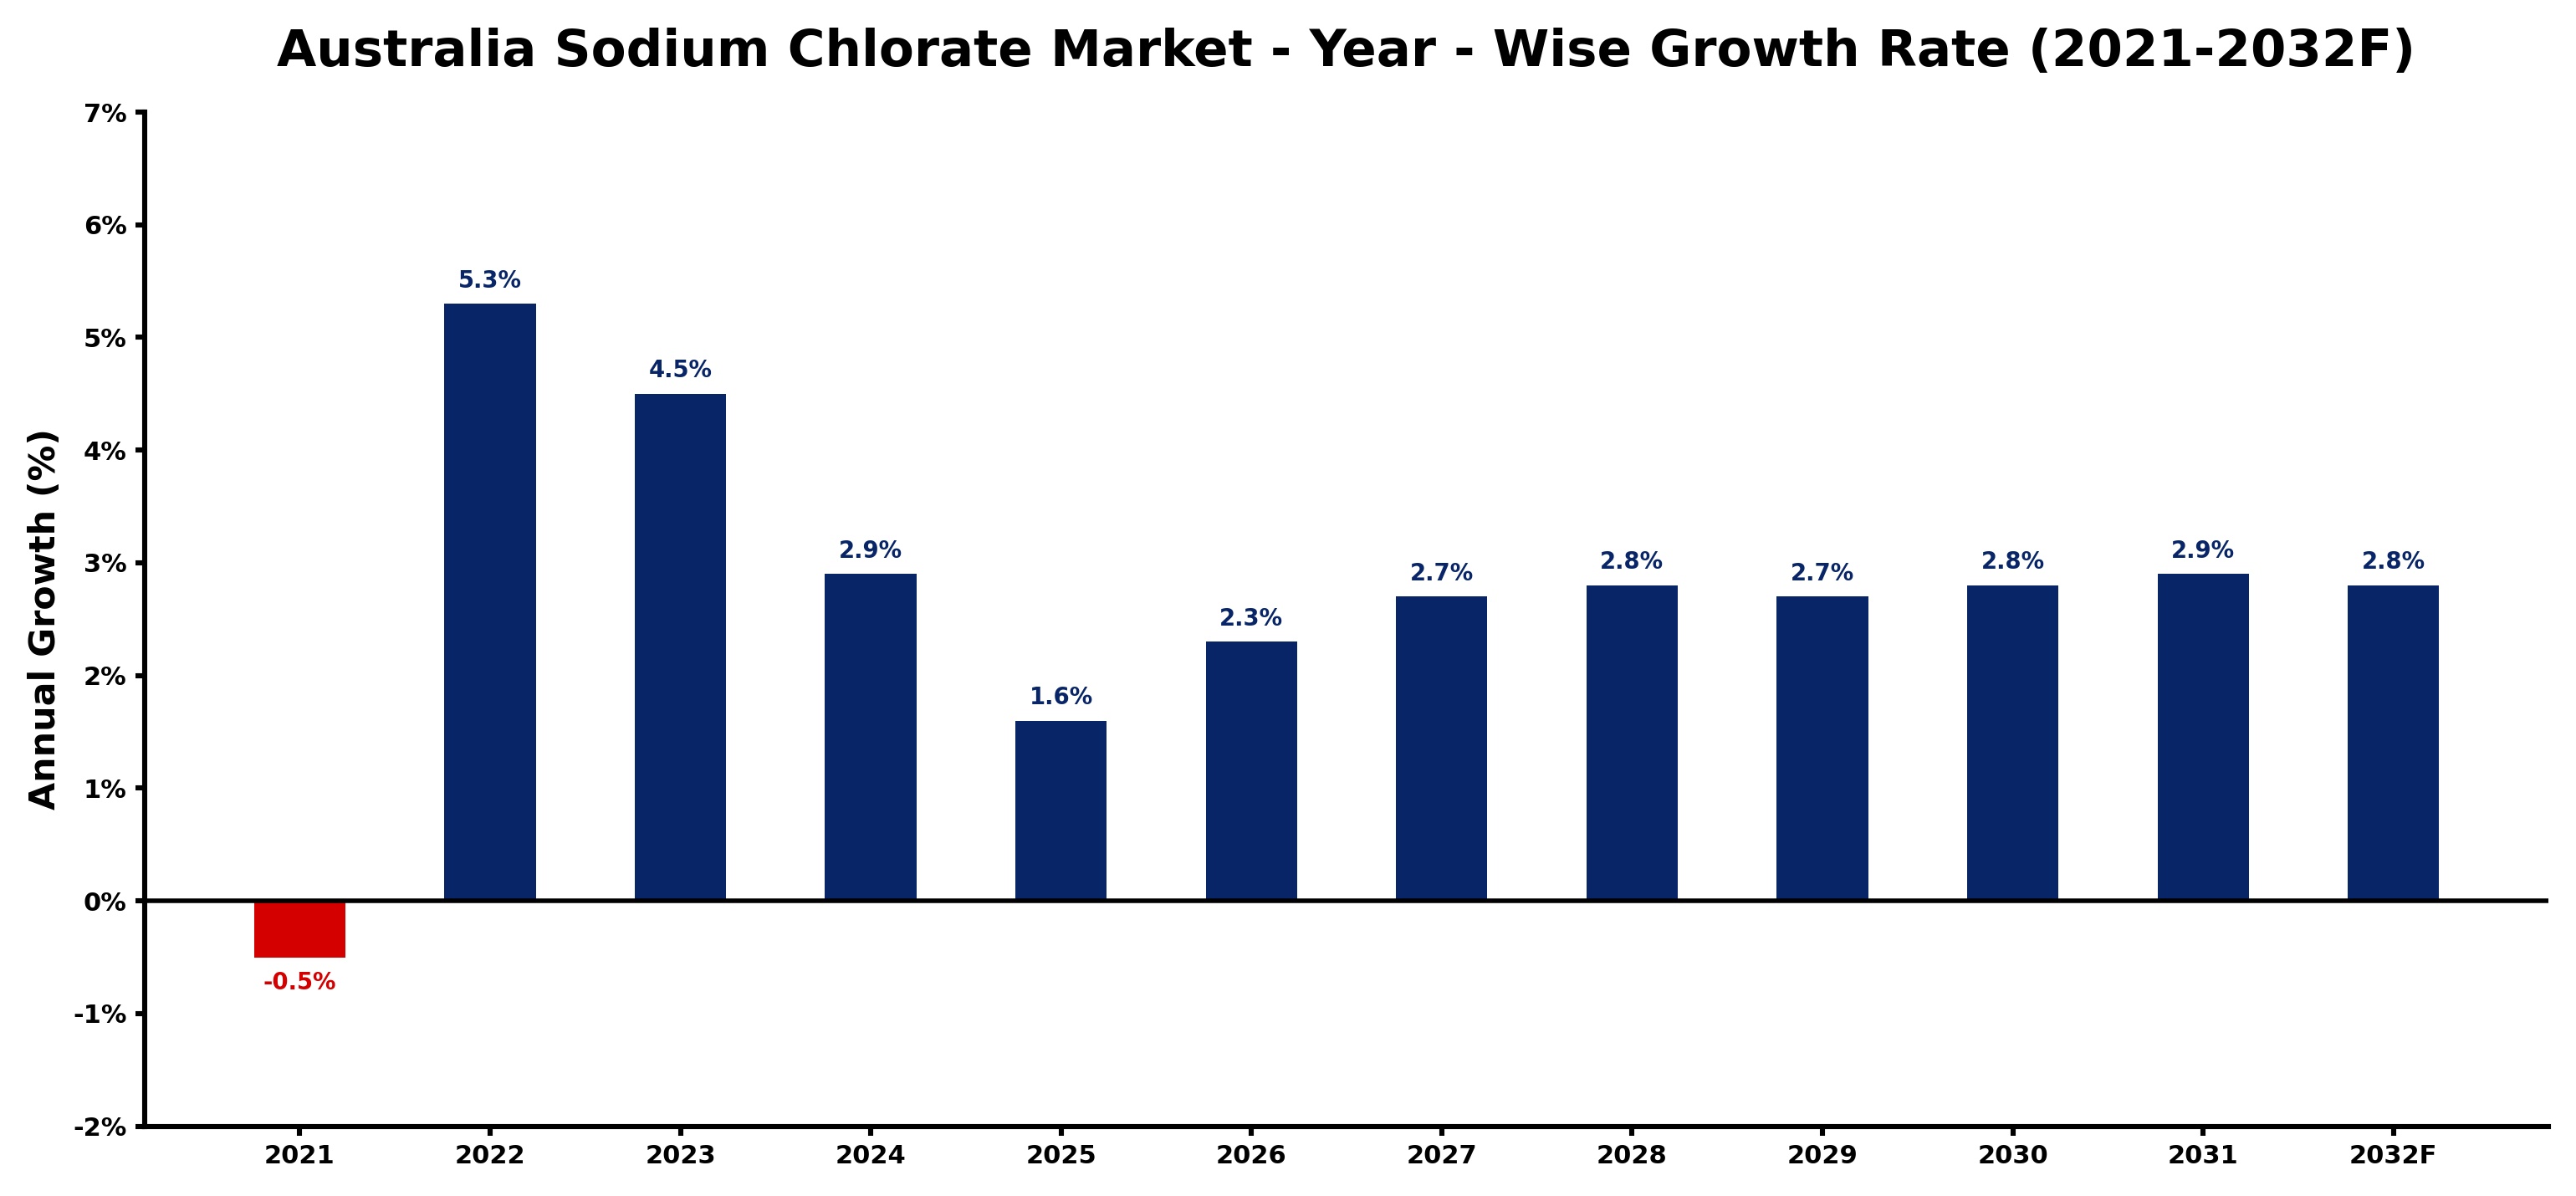
The table below presents the year‑wise growth rates along with the key drivers influencing the market
| Year | Growth Rate | Major Drivers |
| 2021 | -0.5% | Declining mining sector investments reduced sodium chlorate production demand |
| 2022 | 5.3% | Accelerated mining projects boosted sodium chlorate demand for processing |
| 2023 | 4.5% | Export driven mining operations enhance sodium chlorate procurement for processing |
| 2024 | 2.9% | Mining sector demand for sodium chlorate drives production efficiency enhancements |
| 2025 | 1.6% | Improved mining sector maintenance boosts sodium chlorate procurement levels |
| 2026 | 2.3% | Mining sector expansion drives sodium chlorate procurement for processing |
| 2027 | 2.7% | Strategic mine maintenance contracts boosted sodium chlorate supply chain resilience |
| 2028 | 2.8% | Mining sector expansion drives sodium chlorate demand for processing |
| 2029 | 2.7% | Domestic mining maintenance drives sodium chlorate demand for processes |
| 2030 | 2.8% | Mining sector investments drive sodium chlorate demand for processing |
| 2031 | 2.9% | Technological advancements streamline sodium chlorate production for mining applications |
| 2032 | 2.8% | Mining sector investments drive sodium chlorate production facility upgrades |
Note - Market size estimations and growth projections presented in this report are based on 6Wresearch’s advanced forecasting approach, validated with industry datasets as of June 2026.
Australia Sodium Chlorate Market Synopsis
The Australian sodium chlorate market is deeply intertwined with the pulp and paper industry, accounting for a substantial portion of demand. With environmental regulations becoming increasingly stringent, manufacturers are leaning towards sodium chlorate as a more eco-friendly bleaching option, boosting its market appeal.
Sodium chlorate is not merely a chemical but an enabler of innovation within the paper manufacturing process. As the industry adapts to changing consumer preferences for sustainable products, the need for advanced bleaching agents like sodium chlorate will continue to shape the market landscape.
Australia Sodium Chlorate Market Key Takeaways
- The market is expected to grow steadily, driven by the pulp and paper sector's reliance on sodium chlorate for bleaching.
- Emphasis on sustainable practices is leading to increased adoption of sodium chlorate within manufacturing processes.
- Compliance with evolving government regulations is essential for businesses operating in the sodium chlorate space.
- Emerging technologies are set to enhance production efficiency and reduce environmental impact.
- Stakeholders must remain vigilant to changing market dynamics to leverage growth opportunities effectively.
Evaluation of Restraints in Australia Sodium Chlorate Market
The sodium chlorate market in Australia faces significant restraints stemming from the declining demand in traditional applications, notably within the pulp and paper manufacturing sector. As digital media increasingly replaces paper, the industry is witnessing a contraction, which directly impacts sodium chlorate consumption. Additionally, regulatory restrictions regarding the use of sodium chlorate necessitate diligent compliance, posing further challenges for stakeholders. This landscape requires companies to innovate and diversify into emerging markets to offset losses in traditional segments, thus presenting a complex but navigable environment.
Australia Sodium Chlorate Market Trends
The market is seeing a shift towards more advanced production technologies that focus on efficiency and sustainability. Innovations in manufacturing processes are enabling the creation of high-purity sodium chlorate, catering to increasing quality demands. Furthermore, there is a noticeable trend towards utilizing sodium chlorate in applications beyond paper, such as water treatment and chemical synthesis, indicating a diversification of its utility.
Australia Sodium Chlorate Market Opportunities
Genuine growth opportunities lie in the expanding pulp and paper sector as it adapts to eco-friendly practices. The rising need for sustainable production methods creates a favorable landscape for sodium chlorate as an environmentally safe bleaching agent. Moreover, emerging applications in other industries present a potential avenue for growth, allowing businesses to tap into new revenue streams and diversify their product offerings effectively.
Government Initiatives in the Australia Sodium Chlorate Market
Government policies play a pivotal role in the sodium chlorate market landscape, setting stringent safety standards and production practices aimed at minimizing environmental impact. Public spending initiatives targeting sustainable practices in the manufacturing sector further enhance the market's attractiveness. Companies that align with government policies and actively participate in sustainability programs are more likely to benefit from incentives and support, fostering a conducive environment for growth.
Future Insights of the Australia Sodium Chlorate Market
Looking ahead to 2026-2032, the Australian sodium chlorate market is poised for transformation driven by sustainability imperatives. As manufacturers increasingly prioritize eco-friendly materials, sodium chlorate's role as a pivotal bleaching agent is expected to solidify. Technological advancements will likely focus on enhancing production efficiencies while adhering to stricter environmental regulations, further positioning sodium chlorate as a cornerstone in the sustainable paper production chain.
Australia Sodium Chlorate Market Latest Developments (May 2025 - June 2026)
Recent trends in the Australian sodium chlorate market indicate a shift towards collaborative efforts among industry players to advance sustainable practices. Industry associations and regulatory bodies are enhancing dialogue regarding the environmental implications of sodium chlorate use. Additionally, there has been a marked emphasis on research and development to innovate production technologies that reduce waste and improve output quality, reflecting the growing commitment to sustainability.
Australia Sodium Chlorate Market - Key Attractiveness of the Report
- 10 Years of Market Numbers
- Historical Data Starting from 2022 to 2025
- Base Year: 2025
- Forecast Data until 2032
- Key Performance Indicators Impacting the Market
- Major Upcoming Developments and Projects
Key Highlights of the Report:
- Australia Sodium Chlorate Market Outlook
- Market Size of Australia Sodium Chlorate Market, 2025
- Forecast of Australia Sodium Chlorate Market, 2032
- Historical Data and Forecast of Australia Sodium Chlorate Revenues & Volume for the Period 2022-2032F
- Australia Sodium Chlorate Market Trend Evolution
- Australia Sodium Chlorate Market Drivers and Challenges
- Australia Sodium Chlorate Price Trends
- Australia Sodium Chlorate Porter's Five Forces
- Australia Sodium Chlorate Industry Life Cycle
- Historical Data and Forecast of Australia Sodium Chlorate Market Revenues & Volume By Form for the Period 2022-2032F
- Historical Data and Forecast of Australia Sodium Chlorate Market Revenues & Volume By Crystalline for the Period 2022-2032F
- Historical Data and Forecast of Australia Sodium Chlorate Market Revenues & Volume By Solution for the Period 2022-2032F
- Historical Data and Forecast of Australia Sodium Chlorate Market Revenues & Volume By Application for the Period 2022-2032F
- Historical Data and Forecast of Australia Sodium Chlorate Market Revenues & Volume By Bleaching Agent for the Period 2022-2032F
- Historical Data and Forecast of Australia Sodium Chlorate Market Revenues & Volume By Oxidizing Agent for the Period 2022-2032F
- Historical Data and Forecast of Australia Sodium Chlorate Market Revenues & Volume By Herbicide for the Period 2022-2032F
- Historical Data and Forecast of Australia Sodium Chlorate Market Revenues & Volume By Water Treatment for the Period 2022-2032F
- Historical Data and Forecast of Australia Sodium Chlorate Market Revenues & Volume By Others for the Period 2022-2032F
- Australia Sodium Chlorate Import Export Trade Statistics
- Market Opportunity Assessment By Form
- Market Opportunity Assessment By Application
- Australia Sodium Chlorate Top Companies Market Share
- Australia Sodium Chlorate Competitive Benchmarking By Technical and Operational Parameters
- Australia Sodium Chlorate Company Profiles
- Australia Sodium Chlorate Key Strategic Recommendations
Australia Sodium Chlorate Market - Frequently Asked Questions
The growth is primarily fueled by its essential role in the pulp and paper industry, particularly as a bleaching agent. Additionally, the industry's shift towards sustainable practices amplifies its demand.
The Australia Sodium Chlorate Market was estimated at USD 135 Million in 2025 and is projected to reach USD 158 Million by 2032, growing at a CAGR of 2.3% from 2026 to 2032.
Stricter regulations compel manufacturers to adopt more eco-friendly practices, increasing the relevance of sodium chlorate as a sustainable bleaching option in the pulp and paper sector.
Yes, there is growing interest in its use beyond paper manufacturing, particularly in water treatment and chemical synthesis, which may lead to new market opportunities.
Government initiatives shape the market through safety regulations, production standards, and incentives for sustainable practices, which are critical for long-term growth.
6Wresearch actively monitors the Australia Sodium Chlorate Market and publishes its comprehensive annual report, highlighting emerging trends, growth drivers, revenue analysis, and forecast outlook. Our insights help businesses to make data-backed strategic decisions with ongoing market dynamics. Our analysts track relevent industries related to the Australia Sodium Chlorate Market, allowing our clients with actionable intelligence and reliable forecasts tailored to emerging regional needs.
Yes, we provide customisation as per your requirements. To learn more, feel free to contact us on sales@6wresearch.com
1 Executive Summary |
2 Introduction |
2.1 Key Highlights of the Report |
2.2 Report Description |
2.3 Market Scope & Segmentation |
2.4 Research Methodology |
2.5 Assumptions |
3 Australia Sodium Chlorate Market Overview |
3.1 Australia Country Macro Economic Indicators |
3.2 Australia Sodium Chlorate Market Revenues & Volume, 2022 & 2032F |
3.3 Australia Sodium Chlorate Market - Industry Life Cycle |
3.4 Australia Sodium Chlorate Market - Porter's Five Forces |
3.5 Australia Sodium Chlorate Market Revenues & Volume Share, By Form, 2022 & 2032F |
3.6 Australia Sodium Chlorate Market Revenues & Volume Share, By Form, 2022 & 2032F |
4 Australia Sodium Chlorate Market Dynamics |
4.1 Impact Analysis |
4.2 Market Drivers |
4.2.1 Increasing demand for sodium chlorate in the pulp and paper industry for bleaching processes. |
4.2.2 Growth in the mining industry in Australia, leading to higher demand for sodium chlorate for explosives manufacturing. |
4.2.3 Rising awareness and adoption of sodium chlorate as a herbicide in the agriculture sector. |
4.3 Market Restraints |
4.3.1 Strict regulations and environmental concerns related to the production and use of sodium chlorate. |
4.3.2 Fluctuating raw material prices impacting the overall production cost of sodium chlorate. |
4.3.3 Competition from alternative chemicals or technologies affecting the market growth. |
5 Australia Sodium Chlorate Market Trends |
6 Australia Sodium Chlorate Market, By Types |
6.1 Australia Sodium Chlorate Market, By Form |
6.1.1 Overview and Analysis |
6.1.2 Australia Sodium Chlorate Market Revenues & Volume, By Form, 2022-2032F |
6.1.3 Australia Sodium Chlorate Market Revenues & Volume, By Crystalline, 2022-2032F |
6.1.4 Australia Sodium Chlorate Market Revenues & Volume, By Solution, 2022-2032F |
6.2 Australia Sodium Chlorate Market, By Application |
6.2.1 Overview and Analysis |
6.2.2 Australia Sodium Chlorate Market Revenues & Volume, By Bleaching Agent, 2022-2032F |
6.2.3 Australia Sodium Chlorate Market Revenues & Volume, By Oxidizing Agent, 2022-2032F |
6.2.4 Australia Sodium Chlorate Market Revenues & Volume, By Herbicide, 2022-2032F |
6.2.5 Australia Sodium Chlorate Market Revenues & Volume, By Water Treatment, 2022-2032F |
6.2.6 Australia Sodium Chlorate Market Revenues & Volume, By Others, 2022-2032F |
7 Australia Sodium Chlorate Market Import-Export Trade Statistics |
7.1 Australia Sodium Chlorate Market Export to Major Countries |
7.2 Australia Sodium Chlorate Market Imports from Major Countries |
8 Australia Sodium Chlorate Market Key Performance Indicators |
8.1 Average selling price of sodium chlorate in the Australian market. |
8.2 Growth rate of sodium chlorate consumption in key end-user industries. |
8.3 Number of new product developments or innovations in the sodium chlorate market. |
8.4 Percentage of market share held by key sodium chlorate manufacturers in Australia. |
8.5 Environmental impact assessment and sustainability initiatives adopted by sodium chlorate producers. |
9 Australia Sodium Chlorate Market - Opportunity Assessment |
9.1 Australia Sodium Chlorate Market Opportunity Assessment, By Form, 2022 & 2032F |
9.2 Australia Sodium Chlorate Market Opportunity Assessment, By Application, 2022 & 2032F |
10 Australia Sodium Chlorate Market - Competitive Landscape |
10.1 Australia Sodium Chlorate Market Revenue Share, By Companies, 2025 |
10.2 Australia Sodium Chlorate Market Competitive Benchmarking, By Operating and Technical Parameters |
11 Company Profiles |
12 Recommendations |
13 Disclaimer |
Global Go To Market Strategy - 2030
Export potential enables firms to identify high-growth global markets with greater confidence by combining advanced trade intelligence with a structured quantitative methodology. The framework analyzes emerging demand trends and country-level import patterns while integrating macroeconomic and trade datasets such as GDP and population forecasts, bilateral import–export flows, tariff structures, elasticity differentials between developed and developing economies, geographic distance, and import demand projections. Using weighted trade values from 2020–2024 as the base period to project country-to-country export potential for 2030, these inputs are operationalized through calculated drivers such as gravity model parameters, tariff impact factors, and projected GDP per-capita growth. Through an analysis of hidden potentials, demand hotspots, and market conditions that are most favorable to success, this method enables firms to focus on target countries, maximize returns, and global expansion with data, backed by accuracy.
By factoring in the projected importer demand gap that is currently unmet and could be potential opportunity, it identifies the potential for the Exporter (Country) among 190 countries, against the general trade analysis, which identifies the biggest importer or exporter.
To discover high-growth global markets and optimize your business strategy:
Click Here
Pricing
- Single User License$ 1,995
- Department License$ 2,400
- Site License$ 3,120
- Global License$ 3,795

Leadership Perspectives from Industry Events
Search
Thought Leadership and Analyst Meet


Our Clients
6WResearch In News
- India Air Conditioner Market Set for Strong Rebound in 2026 After Weather-Led Correction and GST-Driven Recovery: 6Wresearch
- ADAS in India: How Automatic Emergency Braking, Blind Spot Detection & Driver Monitoring are Transforming Road Safety
- Doha a strategic location for EV manufacturing hub: IPA Qatar
- Demand for luxury TVs surging in the GCC, says Samsung
- Empowering Growth: The Thriving Journey of Bangladesh’s Cable Industry
- Demand for luxury TVs surging in the GCC, says Samsung
Latest Reports
- Poland Fire Protection Systems Market (2026-2032)
- Cape Verde Portable Hand-Thrown Extinguisher Market (2026-2032)
- Canada Portable Hand-Thrown Extinguisher Market (2026-2032)
- Cameroon Portable Hand-Thrown Extinguisher Market (2026-2032)
- Burundi Portable Hand-Thrown Extinguisher Market (2026-2032)
- Burkina Faso Portable Hand-Thrown Extinguisher Market (2026-2032)
- Bulgaria Portable Hand-Thrown Extinguisher Market (2026-2032)
- Brunei Portable Hand-Thrown Extinguisher Market (2026-2032)
- Botswana Portable Hand-Thrown Extinguisher Market (2026-2032)
- Bosnia and Herzegovina Portable Hand-Thrown Extinguisher Market (2026-2032)
Industry Events and Analyst Meet

HIMTEX 2026

India Refining Summit 2026

India EV Show 2026

EV tech India Expo 2026

Auto Tech Asia 2026
Whitepaper
- Middle East & Africa Commercial Security Market Click here to view more.
- Middle East & Africa Fire Safety Systems & Equipment Market Click here to view more.
- GCC Drone Market Click here to view more.
- Middle East Lighting Fixture Market Click here to view more.
- GCC Physical & Perimeter Security Market Click here to view more.