Australia Sodium Permanganate Market (2026-2032) Outlook | Industry, Size, Revenue, Companies, Value, Growth, Forecast, Trends, Share & Analysis
Market Forecast By Types (Sodium Permanganate 40%, Sodium Permanganate 20%), By Applications (Water Treatment, Electronics, Fine Chemicals and Pharmaceuticals) And Competitive Landscape
| Product Code: ETC194987 | Publication Date: May 2022 | Updated Date: Jun 2026 | Product Type: Market Research Report | |
| Publisher: 6Wresearch | Author: Ravi Bhandari | No. of Pages: 60 | No. of Figures: 40 | No. of Tables: 7 |
Australia Sodium Permanganate Market Size, Share & Growth Rate
The Australia Sodium Permanganate Market was estimated at USD 152 Million in 2025 and is projected to reach USD 180 Million by 2032, growing at a CAGR of 2.4% from 2026 to 2032. This growth trajectory is underpinned by increasing regulatory emphasis on water quality standards, particularly in urban and industrial contexts, where sodium permanganate is indispensable for effective contaminant removal. Furthermore, the ongoing advancements in chemical manufacturing processes are expanding its utility, solidifying sodium permanganate’s role in Australia's industrial landscape.
Australia Sodium Permanganate Market Growth Rate Analysis (2021-2032)
The Australian sodium permanganate market experienced a notable recovery following a slight decline of 0.4% in 2021, with growth reaching 5.6% in 2022. This rebound was driven by escalating demand across water treatment and industrial applications, as well as increased investments in infrastructure and energy transition projects. While growth moderated to 5.1% in 2023, projections indicate continued expansion, with rates stabilizing around 2.6% to 3.1% between 2024 and 2032. Factors such as technological advancements in production processes and rising consumer demands for sustainable solutions are expected to bolster market performance, fostering a robust environment for sodium permanganate usage across various sectors in Australia.
Australia Sodium Permanganate Market Year-wise Growth Rate and Key Drivers
This graph highlights how the Australia Sodium Permanganate Market has steadily grown over the past five years, supported by major growth factors.
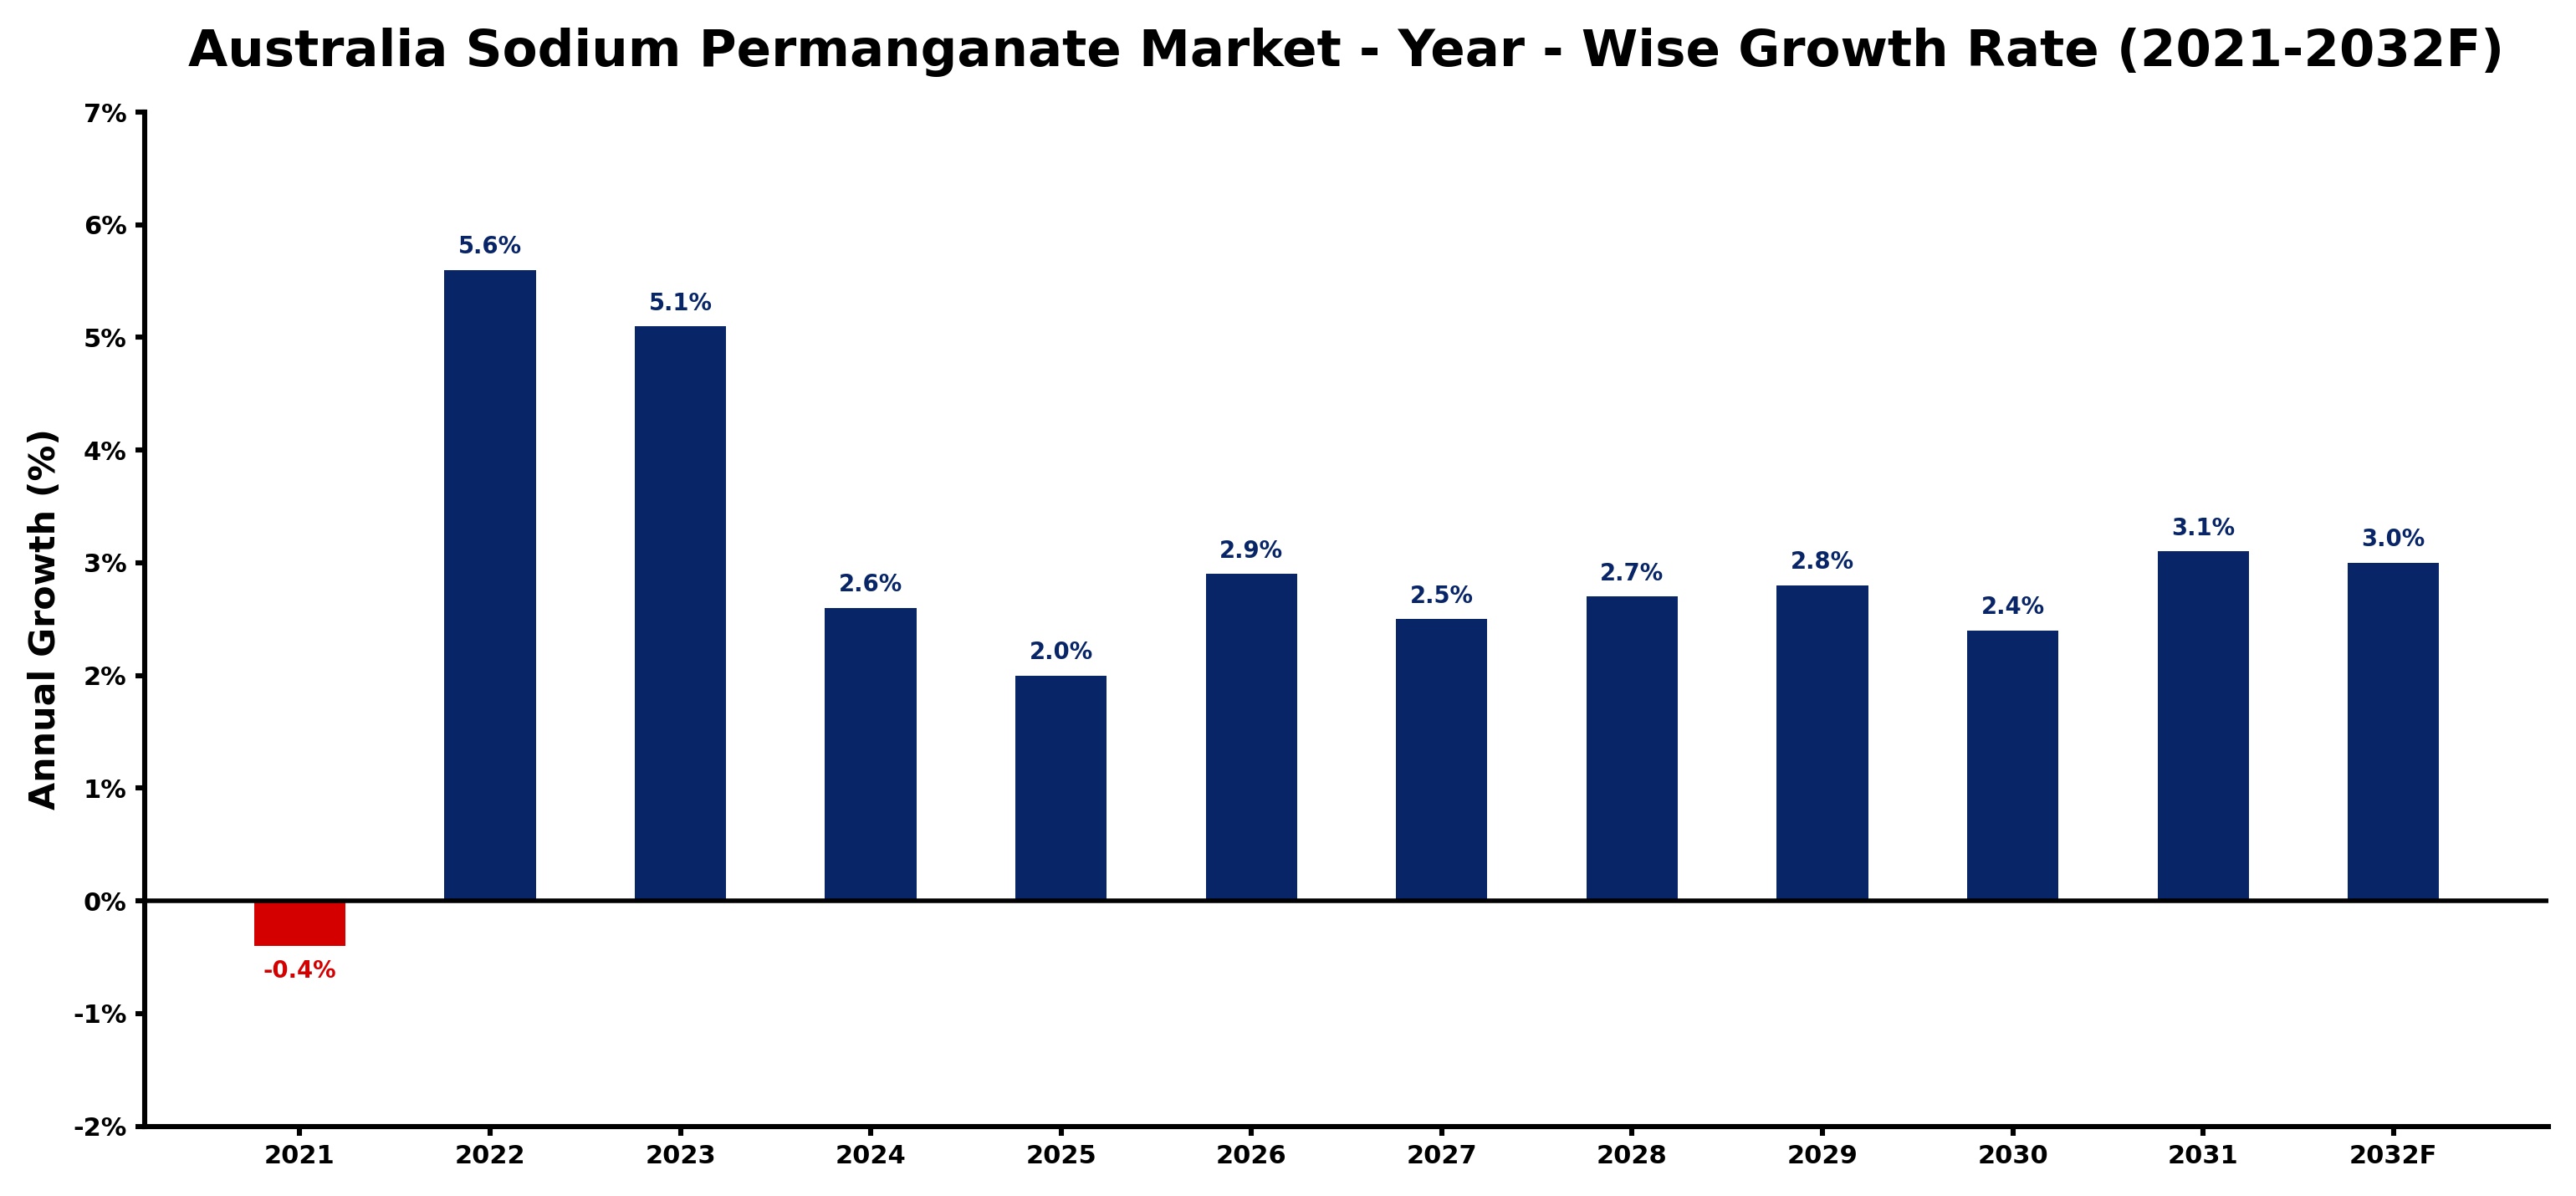
The table below presents the year‑wise growth rates along with the key drivers influencing the market
| Year | Growth Rate | Major Drivers |
| 2021 | -0.4% | Supply chain disruptions affected production |
| 2022 | 5.6% | Industrial applications expanded significantly |
| 2023 | 5.1% | Water treatment demand increased sharply |
| 2024 | 2.6% | Agricultural sector growth drove usage |
| 2025 | 2.0% | Chemical manufacturing expanded capacity |
| 2026 | 2.9% | Environmental regulations enhanced adoption |
| 2027 | 2.5% | Pharmaceutical applications gained traction |
| 2028 | 2.7% | Research initiatives increased consumption |
| 2029 | 2.8% | Sustainability trends boosted demand |
| 2030 | 2.4% | Emerging markets expanded opportunities |
| 2031 | 3.1% | Technological advancements improved efficiency |
| 2032 | 3.0% | Global trade agreements enhanced access |
Note - Market size estimations and growth projections presented in this report are based on 6Wresearch’s advanced forecasting approach, validated with industry datasets as of June 2026.
Australia Sodium Permanganate Market Synopsis
In Australia, sodium permanganate is predominantly utilized in the water treatment sector, where it is critical for disinfection and oxidation of impurities. This focus on clean water initiatives drives substantial demand from municipalities and industrial users alike.
Additionally, its applications extend into the chemical manufacturing and textile industries, where it serves as a key oxidizing agent. The interplay between industrial demands and regulatory measures is shaping the evolving landscape of the sodium permanganate market in Australia.
Australia Sodium Permanganate Market Key Takeaways
- The market is experiencing steady growth, driven primarily by water quality initiatives.
- Applications in chemical manufacturing and textiles are emerging as significant demand sources.
- Regulatory compliance and environmental sustainability are key considerations influencing market dynamics.
- Technological advancements are essential for expanding the efficiency of sodium permanganate uses.
- The niche nature of sodium permanganate applications poses both opportunities and limitations for growth.
Evaluation of Restraints in Australia Sodium Permanganate Market
The Australia Sodium Permanganate Market is constrained by its limited applications, primarily focused on niche sectors such as water treatment and specialized industrial processes. This narrow scope can limit market expansion, particularly when compared to more versatile chemicals. Additionally, fluctuations in raw material costs and stringent regulatory frameworks could further impact profitability and market accessibility. Manufacturers must continually invest in R&D to enhance product efficacy and address environmental concerns, while navigating the complexities of compliance with evolving governmental policies.
Australia Sodium Permanganate Market Trends
A notable trend in the Australia Sodium Permanganate Market is the increasing integration of technology in monitoring and controlling water treatment processes. Smart water management systems are becoming essential, as they optimize the use of sodium permanganate and improve operational efficiencies. Furthermore, there's a shift towards greener alternatives, prompting producers to focus on sustainability and reduce environmental impact.
In the textile sector, the focus on environmentally friendly processing methods is also driving innovation, leading to more sustainable applications of sodium permanganate. This trend not only helps in meeting regulatory requirements but also aligns with consumer preferences for eco-friendly products.
Australia Sodium Permanganate Market Opportunities
Emerging opportunities in the Australia Sodium Permanganate Market lie primarily in the expansion of applications across diverse sectors. As industries increasingly prioritize sustainability, the potential for sodium permanganate to be used in innovative ways can drive demand. Moreover, with the rising focus on water quality and treatment technologies, investments in water infrastructure will likely create new avenues for market growth. Collaborations between manufacturers and technology firms can also lead to advancements that enhance product applicability.
Government Initiatives in the Australia Sodium Permanganate Market
Australian government policies focused on environmental protection and public health are crucial to shaping the sodium permanganate market. Authorities emphasize the importance of strict safety regulations regarding product purity and environmental impact during the manufacturing process. Initiatives that promote the responsible use of sodium permanganate, along with investments in sustainable technologies and infrastructure upgrades, reflect a commitment to enhancing water quality across the nation.
Future Insights of the Australia Sodium Permanganate Market
Looking ahead to 2026-2032, the Australia Sodium Permanganate Market is poised for measured growth. The increasing regulatory focus on water treatment efficacy and safety will continue to bolster demand, particularly in urban settings. Additionally, as technological advancements facilitate enhanced applications, the market may see a gradual expansion into other industrial sectors. The adaptability of sodium permanganate to meet evolving environmental standards will be pivotal, positioning it as a key player in Australia’s chemical landscape.
Australia Sodium Permanganate Market Latest Developments (May 2025 - June 2026)
Recent developments within the Australia Sodium Permanganate Market indicate a shift towards increased investment in R&D aimed at improving product efficiency and reducing environmental impact. Stakeholders are actively exploring innovative uses and formulations that align with sustainability goals. Moreover, collaborations among industry players and research institutions are becoming more common, focusing on developing next-generation applications that meet both regulatory requirements and market needs.
Australia Sodium Permanganate Market - Key Attractiveness of the Report
- 10 Years of Market Numbers
- Historical Data Starting from 2022 to 2025
- Base Year: 2025
- Forecast Data until 2032
- Key Performance Indicators Impacting the Market
- Major Upcoming Developments and Projects
Key Highlights of the Report:
- Australia Sodium Permanganate Market Outlook
- Market Size of Australia Sodium Permanganate Market, 2025
- Forecast of Australia Sodium Permanganate Market, 2032
- Historical Data and Forecast of Australia Sodium Permanganate Revenues & Volume for the Period 2022-2032F
- Australia Sodium Permanganate Market Trend Evolution
- Australia Sodium Permanganate Market Drivers and Challenges
- Australia Sodium Permanganate Price Trends
- Australia Sodium Permanganate Porter's Five Forces
- Australia Sodium Permanganate Industry Life Cycle
- Historical Data and Forecast of Australia Sodium Permanganate Market Revenues & Volume By Types for the Period 2022-2032F
- Historical Data and Forecast of Australia Sodium Permanganate Market Revenues & Volume By Sodium Permanganate 40% for the Period 2022-2032F
- Historical Data and Forecast of Australia Sodium Permanganate Market Revenues & Volume By Sodium Permanganate 20% for the Period 2022-2032F
- Historical Data and Forecast of Australia Sodium Permanganate Market Revenues & Volume By Applications for the Period 2022-2032F
- Historical Data and Forecast of Australia Sodium Permanganate Market Revenues & Volume By Water Treatment for the Period 2022-2032F
- Historical Data and Forecast of Australia Sodium Permanganate Market Revenues & Volume By Electronics for the Period 2022-2032F
- Historical Data and Forecast of Australia Sodium Permanganate Market Revenues & Volume By Fine Chemicals and Pharmaceuticals for the Period 2022-2032F
- Australia Sodium Permanganate Import Export Trade Statistics
- Market Opportunity Assessment By Types
- Market Opportunity Assessment By Applications
- Australia Sodium Permanganate Top Companies Market Share
- Australia Sodium Permanganate Competitive Benchmarking By Technical and Operational Parameters
- Australia Sodium Permanganate Company Profiles
- Australia Sodium Permanganate Key Strategic Recommendations
Australia Sodium Permanganate Market - Frequently Asked Questions
The Australia Sodium Permanganate Market was estimated at USD 152 Million in 2025 and is projected to reach USD 180 Million by 2032, growing at a CAGR of 2.4% from 2026 to 2032, driven by regulatory pressures and technological advancements.
Sodium permanganate is a critical oxidizing agent in water treatment, used extensively for disinfecting water and removing contaminants, thus ensuring compliance with health standards.
Yes, beyond water treatment, sodium permanganate is increasingly being utilized in chemical manufacturing and textile industries, where its oxidizing properties play a vital role in production processes.
Government policies aimed at ensuring product purity and environmental safety significantly impact market dynamics, encouraging manufacturers to adopt responsible practices and innovate sustainably.
Producers face challenges stemming from fluctuating raw material costs, stringent regulatory requirements, and the limited scope of sodium permanganate applications, which can restrict market growth.
6Wresearch actively monitors the Australia Sodium Permanganate Market and publishes its comprehensive annual report, highlighting emerging trends, growth drivers, revenue analysis, and forecast outlook. Our insights help businesses to make data-backed strategic decisions with ongoing market dynamics. Our analysts track relevent industries related to the Australia Sodium Permanganate Market, allowing our clients with actionable intelligence and reliable forecasts tailored to emerging regional needs.
Yes, we provide customisation as per your requirements. To learn more, feel free to contact us on sales@6wresearch.com
1 Executive Summary |
2 Introduction |
2.1 Key Highlights of the Report |
2.2 Report Description |
2.3 Market Scope & Segmentation |
2.4 Research Methodology |
2.5 Assumptions |
3 Australia Sodium Permanganate Market Overview |
3.1 Australia Country Macro Economic Indicators |
3.2 Australia Sodium Permanganate Market Revenues & Volume, 2022 & 2032F |
3.3 Australia Sodium Permanganate Market - Industry Life Cycle |
3.4 Australia Sodium Permanganate Market - Porter's Five Forces |
3.5 Australia Sodium Permanganate Market Revenues & Volume Share, By Types, 2022 & 2032F |
3.6 Australia Sodium Permanganate Market Revenues & Volume Share, By Applications, 2022 & 2032F |
4 Australia Sodium Permanganate Market Dynamics |
4.1 Impact Analysis |
4.2 Market Drivers |
4.2.1 Increasing demand for water treatment solutions in Australia |
4.2.2 Growing awareness about the importance of wastewater treatment and environmental protection |
4.2.3 Rising investments in infrastructure projects in the country |
4.3 Market Restraints |
4.3.1 Fluctuating prices of raw materials used in sodium permanganate production |
4.3.2 Stringent government regulations on the use of chemicals in water treatment |
4.3.3 Competition from alternative water treatment chemicals |
5 Australia Sodium Permanganate Market Trends |
6 Australia Sodium Permanganate Market, By Types |
6.1 Australia Sodium Permanganate Market, By Types |
6.1.1 Overview and Analysis |
6.1.2 Australia Sodium Permanganate Market Revenues & Volume, By Types, 2022-2032F |
6.1.3 Australia Sodium Permanganate Market Revenues & Volume, By Sodium Permanganate 40%, 2022-2032F |
6.1.4 Australia Sodium Permanganate Market Revenues & Volume, By Sodium Permanganate 20%, 2022-2032F |
6.2 Australia Sodium Permanganate Market, By Applications |
6.2.1 Overview and Analysis |
6.2.2 Australia Sodium Permanganate Market Revenues & Volume, By Water Treatment, 2022-2032F |
6.2.3 Australia Sodium Permanganate Market Revenues & Volume, By Electronics, 2022-2032F |
6.2.4 Australia Sodium Permanganate Market Revenues & Volume, By Fine Chemicals and Pharmaceuticals, 2022-2032F |
7 Australia Sodium Permanganate Market Import-Export Trade Statistics |
7.1 Australia Sodium Permanganate Market Export to Major Countries |
7.2 Australia Sodium Permanganate Market Imports from Major Countries |
8 Australia Sodium Permanganate Market Key Performance Indicators |
8.1 Environmental impact indicators, such as reduction in pollutants in treated water |
8.2 Adoption rate of sodium permanganate in various industries |
8.3 Efficiency metrics, such as dosage required for effective water treatment |
8.4 Innovation rate in sodium permanganate technology |
8.5 Customer satisfaction levels with sodium permanganate products |
9 Australia Sodium Permanganate Market - Opportunity Assessment |
9.1 Australia Sodium Permanganate Market Opportunity Assessment, By Types, 2022 & 2032F |
9.2 Australia Sodium Permanganate Market Opportunity Assessment, By Applications, 2022 & 2032F |
10 Australia Sodium Permanganate Market - Competitive Landscape |
10.1 Australia Sodium Permanganate Market Revenue Share, By Companies, 2025 |
10.2 Australia Sodium Permanganate Market Competitive Benchmarking, By Operating and Technical Parameters |
11 Company Profiles |
12 Recommendations |
13 Disclaimer |
Global Go To Market Strategy - 2030
Export potential enables firms to identify high-growth global markets with greater confidence by combining advanced trade intelligence with a structured quantitative methodology. The framework analyzes emerging demand trends and country-level import patterns while integrating macroeconomic and trade datasets such as GDP and population forecasts, bilateral import–export flows, tariff structures, elasticity differentials between developed and developing economies, geographic distance, and import demand projections. Using weighted trade values from 2020–2024 as the base period to project country-to-country export potential for 2030, these inputs are operationalized through calculated drivers such as gravity model parameters, tariff impact factors, and projected GDP per-capita growth. Through an analysis of hidden potentials, demand hotspots, and market conditions that are most favorable to success, this method enables firms to focus on target countries, maximize returns, and global expansion with data, backed by accuracy.
By factoring in the projected importer demand gap that is currently unmet and could be potential opportunity, it identifies the potential for the Exporter (Country) among 190 countries, against the general trade analysis, which identifies the biggest importer or exporter.
To discover high-growth global markets and optimize your business strategy:
Click Here
Pricing
- Single User License$ 1,995
- Department License$ 2,400
- Site License$ 3,120
- Global License$ 3,795

Leadership Perspectives from Industry Events
Search
Thought Leadership and Analyst Meet


Our Clients
6WResearch In News
- India Air Conditioner Market Set for Strong Rebound in 2026 After Weather-Led Correction and GST-Driven Recovery: 6Wresearch
- ADAS in India: How Automatic Emergency Braking, Blind Spot Detection & Driver Monitoring are Transforming Road Safety
- Doha a strategic location for EV manufacturing hub: IPA Qatar
- Demand for luxury TVs surging in the GCC, says Samsung
- Empowering Growth: The Thriving Journey of Bangladesh’s Cable Industry
- Demand for luxury TVs surging in the GCC, says Samsung
Latest Reports
- Poland Fire Protection Systems Market (2026-2032)
- Cape Verde Portable Hand-Thrown Extinguisher Market (2026-2032)
- Canada Portable Hand-Thrown Extinguisher Market (2026-2032)
- Cameroon Portable Hand-Thrown Extinguisher Market (2026-2032)
- Burundi Portable Hand-Thrown Extinguisher Market (2026-2032)
- Burkina Faso Portable Hand-Thrown Extinguisher Market (2026-2032)
- Bulgaria Portable Hand-Thrown Extinguisher Market (2026-2032)
- Brunei Portable Hand-Thrown Extinguisher Market (2026-2032)
- Botswana Portable Hand-Thrown Extinguisher Market (2026-2032)
- Bosnia and Herzegovina Portable Hand-Thrown Extinguisher Market (2026-2032)
Industry Events and Analyst Meet

HIMTEX 2026

India Refining Summit 2026

India EV Show 2026

EV tech India Expo 2026

Auto Tech Asia 2026
Whitepaper
- Middle East & Africa Commercial Security Market Click here to view more.
- Middle East & Africa Fire Safety Systems & Equipment Market Click here to view more.
- GCC Drone Market Click here to view more.
- Middle East Lighting Fixture Market Click here to view more.
- GCC Physical & Perimeter Security Market Click here to view more.