Australia Sports Graphics Market (2026-2032) | Companies, Segmentation, Competitive Landscape, Trends, Share, Forecast, Size & Revenue, Value, Growth, Outlook, Analysis, Industry
Market Forecast By Product (Digital Printing, Screen Printing, Embroidery), By End- Users (Promotional Products, Sports Apparel & Accessories) And Competitive Landscape
| Product Code: ETC6191797 | Publication Date: Sep 2024 | Updated Date: Mar 2026 | Product Type: Market Research Report | |
| Publisher: 6Wresearch | Author: Ravi Bhandari | No. of Pages: 75 | No. of Figures: 35 | No. of Tables: 20 |
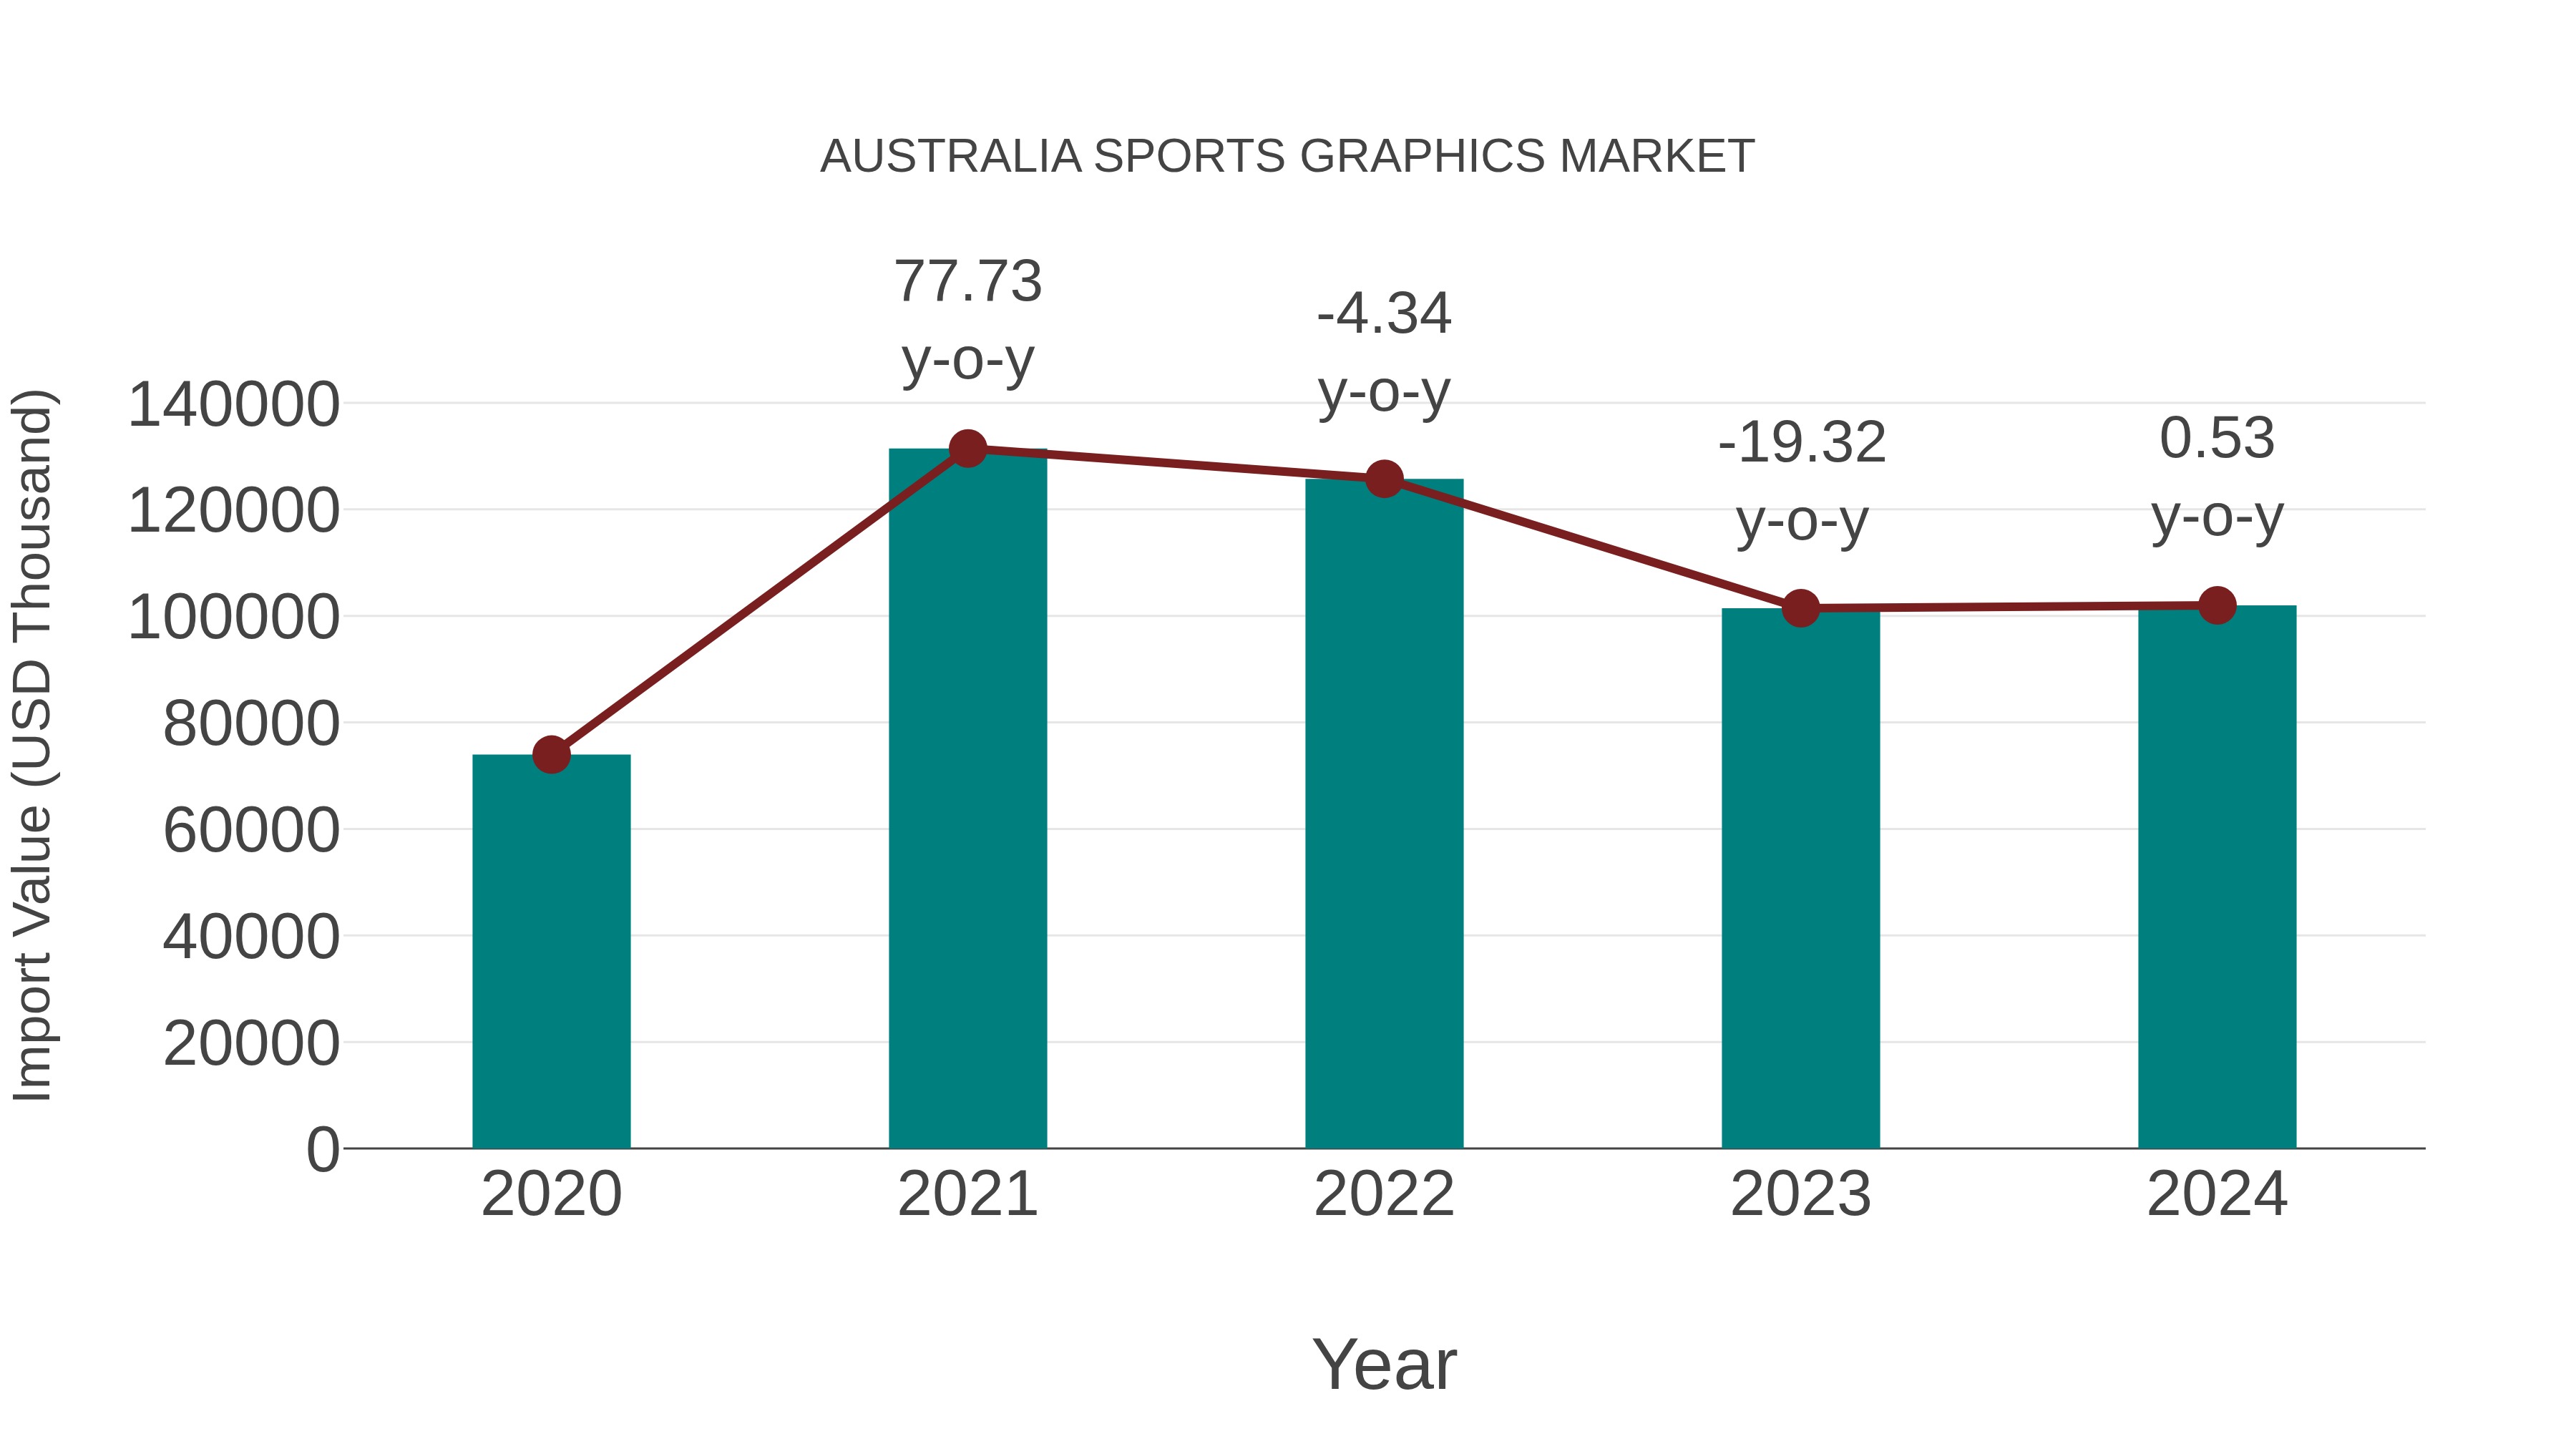
Australia Sports Graphics Market: Import Trend Analysis
In 2024, Australia`s import trend for the sports graphics market showed a growth rate of 0.53%, with a compound annual growth rate (CAGR) of 8.37% from 2020 to 2024. This upward import momentum can be attributed to a sustained demand shift towards high-quality sports graphics products, indicating market stability and a consistent need for such goods.
Australia Sports Graphics Market Overview
The Australia sports graphics market has experienced significant growth driven by the increasing demand for enhanced visual experiences in sports broadcasting, marketing, and fan engagement. This market includes digital graphics, 3D animations, augmented reality (AR), and virtual reality (VR) applications that enrich live sports events and highlight reels. Sports broadcasters and digital platforms invest heavily in innovative graphic solutions to improve storytelling and viewer engagement, especially with the rise of eSports and virtual sports presentations.
Trends of the market
The Australian sports graphics market is experiencing a surge in demand driven by advancements in digital technology and increased consumption of sports content across multiple platforms. The rise of augmented reality (AR) and virtual reality (VR) technologies is enabling more immersive visual experiences for fans, boosting demand for sophisticated sports graphics in broadcasting and live events. Additionally, customization and interactive graphics for social media and mobile apps are gaining popularity, reflecting the trend towards personalized fan engagement.
Challenges of the market
The sports graphics market in Australia faces challenges related to rapidly evolving technology and high consumer expectations for visually immersive experiences. Keeping pace with advances such as augmented reality (AR), virtual reality (VR), and real-time data visualization requires significant investment. Additionally, integrating graphics seamlessly into live broadcasts and digital platforms without latency issues is technically demanding. The market also struggles with content licensing and rights management, as securing permissions from sports leagues can be complex and costly.
Investment opportunities in the Market
The sports graphics market in Australia is evolving rapidly with growing demand for digital content, live event enhancements, and immersive fan experiences. Investment opportunities lie in advanced graphic design software, augmented reality (AR), and virtual reality (VR) integrations for sports broadcasting and marketing. Startups focused on AI-powered analytics for visual data representation and customized fan engagement through graphics also present high-growth potential. Additionally, partnerships with sports leagues and media companies to deliver innovative visual content can drive substantial returns.
Government Policy of the market
The Australian government encourages innovation and technology adoption within the sports sector, which directly impacts the sports graphics market. Policies promoting digital transformation and support for creative industries foster the growth of sports graphics solutions, including real-time visualizations and augmented reality in sports broadcasting. Additionally, funding programs for startups and tech enterprises help boost companies developing sports graphics software and platforms, enhancing fan engagement and commercial opportunities.
Key Highlights of the Report:
- Australia Sports Graphics Market Outlook
- Market Size of Australia Sports Graphics Market, 2025
- Forecast of Australia Sports Graphics Market, 2032
- Historical Data and Forecast of Australia Sports Graphics Revenues & Volume for the Period 2022 - 2032F
- Australia Sports Graphics Market Trend Evolution
- Australia Sports Graphics Market Drivers and Challenges
- Australia Sports Graphics Price Trends
- Australia Sports Graphics Porter's Five Forces
- Australia Sports Graphics Industry Life Cycle
- Historical Data and Forecast of Australia Sports Graphics Market Revenues & Volume By Product for the Period 2022 - 2032F
- Historical Data and Forecast of Australia Sports Graphics Market Revenues & Volume By Digital Printing for the Period 2022 - 2032F
- Historical Data and Forecast of Australia Sports Graphics Market Revenues & Volume By Screen Printing for the Period 2022 - 2032F
- Historical Data and Forecast of Australia Sports Graphics Market Revenues & Volume By Embroidery for the Period 2022 - 2032F
- Historical Data and Forecast of Australia Sports Graphics Market Revenues & Volume By End- Users for the Period 2022 - 2032F
- Historical Data and Forecast of Australia Sports Graphics Market Revenues & Volume By Promotional Products for the Period 2022 - 2032F
- Historical Data and Forecast of Australia Sports Graphics Market Revenues & Volume By Sports Apparel & Accessories for the Period 2022 - 2032F
- Australia Sports Graphics Import Export Trade Statistics
- Market Opportunity Assessment By Product
- Market Opportunity Assessment By End- Users
- Australia Sports Graphics Top Companies Market Share
- Australia Sports Graphics Competitive Benchmarking By Technical and Operational Parameters
- Australia Sports Graphics Company Profiles
- Australia Sports Graphics Key Strategic Recommendations
Australia Sports Graphics Market (2026-2032): FAQs
6Wresearch actively monitors the Australia Sports Graphics Market and publishes its comprehensive annual report, highlighting emerging trends, growth drivers, revenue analysis, and forecast outlook. Our insights help businesses to make data-backed strategic decisions with ongoing market dynamics. Our analysts track relevent industries related to the Australia Sports Graphics Market, allowing our clients with actionable intelligence and reliable forecasts tailored to emerging regional needs.
Yes, we provide customisation as per your requirements. To learn more, feel free to contact us on sales@6wresearch.com
1 Executive Summary |
2 Introduction |
2.1 Key Highlights of the Report |
2.2 Report Description |
2.3 Market Scope & Segmentation |
2.4 Research Methodology |
2.5 Assumptions |
3 Australia Sports Graphics Market Overview |
3.1 Australia Country Macro Economic Indicators |
3.2 Australia Sports Graphics Market Revenues & Volume, 2022 & 2032F |
3.3 Australia Sports Graphics Market - Industry Life Cycle |
3.4 Australia Sports Graphics Market - Porter's Five Forces |
3.5 Australia Sports Graphics Market Revenues & Volume Share, By Product, 2022 & 2032F |
3.6 Australia Sports Graphics Market Revenues & Volume Share, By End- Users, 2022 & 2032F |
4 Australia Sports Graphics Market Dynamics |
4.1 Impact Analysis |
4.2 Market Drivers |
4.2.1 Increasing popularity of sports events in Australia leading to higher demand for sports graphics |
4.2.2 Growing investments in sports infrastructure and facilities requiring advanced graphics solutions |
4.2.3 Technological advancements in the field of graphics leading to innovative sports graphics products |
4.3 Market Restraints |
4.3.1 High competition in the sports graphics market leading to pricing pressures |
4.3.2 Economic uncertainties impacting the budget allocation for sports graphics by organizations |
5 Australia Sports Graphics Market Trends |
6 Australia Sports Graphics Market, By Types |
6.1 Australia Sports Graphics Market, By Product |
6.1.1 Overview and Analysis |
6.1.2 Australia Sports Graphics Market Revenues & Volume, By Product, 2022 - 2032F |
6.1.3 Australia Sports Graphics Market Revenues & Volume, By Digital Printing, 2022 - 2032F |
6.1.4 Australia Sports Graphics Market Revenues & Volume, By Screen Printing, 2022 - 2032F |
6.1.5 Australia Sports Graphics Market Revenues & Volume, By Embroidery, 2022 - 2032F |
6.2 Australia Sports Graphics Market, By End- Users |
6.2.1 Overview and Analysis |
6.2.2 Australia Sports Graphics Market Revenues & Volume, By Promotional Products, 2022 - 2032F |
6.2.3 Australia Sports Graphics Market Revenues & Volume, By Sports Apparel & Accessories, 2022 - 2032F |
7 Australia Sports Graphics Market Import-Export Trade Statistics |
7.1 Australia Sports Graphics Market Export to Major Countries |
7.2 Australia Sports Graphics Market Imports from Major Countries |
8 Australia Sports Graphics Market Key Performance Indicators |
8.1 Percentage increase in adoption of AR/VR-based sports graphics solutions in Australia |
8.2 Average customer satisfaction score related to sports graphics services |
8.3 Number of partnerships with major sports organizations for providing graphics solutions |
8.4 Percentage growth in demand for interactive and real-time sports graphics solutions |
9 Australia Sports Graphics Market - Opportunity Assessment |
9.1 Australia Sports Graphics Market Opportunity Assessment, By Product, 2022 & 2032F |
9.2 Australia Sports Graphics Market Opportunity Assessment, By End- Users, 2022 & 2032F |
10 Australia Sports Graphics Market - Competitive Landscape |
10.1 Australia Sports Graphics Market Revenue Share, By Companies, 2025 |
10.2 Australia Sports Graphics Market Competitive Benchmarking, By Operating and Technical Parameters |
11 Company Profiles |
12 Recommendations |
13 Disclaimer |
Global Go To Market Strategy - 2030
Export potential enables firms to identify high-growth global markets with greater confidence by combining advanced trade intelligence with a structured quantitative methodology. The framework analyzes emerging demand trends and country-level import patterns while integrating macroeconomic and trade datasets such as GDP and population forecasts, bilateral import–export flows, tariff structures, elasticity differentials between developed and developing economies, geographic distance, and import demand projections. Using weighted trade values from 2020–2024 as the base period to project country-to-country export potential for 2030, these inputs are operationalized through calculated drivers such as gravity model parameters, tariff impact factors, and projected GDP per-capita growth. Through an analysis of hidden potentials, demand hotspots, and market conditions that are most favorable to success, this method enables firms to focus on target countries, maximize returns, and global expansion with data, backed by accuracy.
By factoring in the projected importer demand gap that is currently unmet and could be potential opportunity, it identifies the potential for the Exporter (Country) among 190 countries, against the general trade analysis, which identifies the biggest importer or exporter.
To discover high-growth global markets and optimize your business strategy:
Click Here
Pricing
- Single User License$ 1,995
- Department License$ 2,400
- Site License$ 3,120
- Global License$ 3,795

Leadership Perspectives from Industry Events
Search
Thought Leadership and Analyst Meet


Our Clients
6WResearch In News
- India Export Attractiveness Tracker 2026
- India Air Conditioner Market Set for Strong Rebound in 2026 After Weather-Led Correction and GST-Driven Recovery: 6Wresearch
- ADAS in India: How Automatic Emergency Braking, Blind Spot Detection & Driver Monitoring are Transforming Road Safety
- Doha a strategic location for EV manufacturing hub: IPA Qatar
- Demand for luxury TVs surging in the GCC, says Samsung
- Empowering Growth: The Thriving Journey of Bangladesh’s Cable Industry
Latest Reports
- Qatar Access and Home Network Market (2026-2032)
- Nicaragua RPG Gaming Market (2026-2032)
- New Zealand RPG Gaming Market (2026-2032)
- Netherlands RPG Gaming Market (2026-2032)
- Nauru RPG Gaming Market (2026-2032)
- Namibia RPG Gaming Market (2026-2032)
- Mozambique RPG Gaming Market (2026-2032)
- Montenegro RPG Gaming Market (2026-2032)
- Mongolia RPG Gaming Market (2026-2032)
- Monaco RPG Gaming Market (2026-2032)
Industry Events and Analyst Meet

EV India Expo 2026

HIMTEX 2026

India Refining Summit 2026

India EV Show 2026

EV tech India Expo 2026
Whitepaper
- Middle East & Africa Commercial Security Market Click here to view more.
- Middle East & Africa Fire Safety Systems & Equipment Market Click here to view more.
- GCC Drone Market Click here to view more.
- Middle East Lighting Fixture Market Click here to view more.
- GCC Physical & Perimeter Security Market Click here to view more.