Australia Winches Market (2026-2032) | Industry, Revenue, Companies, Growth, Trends, Forecast, Value, Size, Analysis, Outlook & Share
Market Forecast By Type (Electric Winches, Hydraulic Winches, Manual Winches), By Applications (Mining, Construction, Utility, Freight, Oceaneering, Others) And Competitive Landscape
| Product Code: ETC026635 | Publication Date: Oct 2020 | Updated Date: Jun 2026 | Product Type: Report | |
| Publisher: 6Wresearch | Author: Ravi Bhandari | No. of Pages: 70 | No. of Figures: 35 | No. of Tables: 5 |
Australia Winches Market Summary
The australia winches market was estimated at USD 97 Million in 2025 and is projected to reach USD 113 Million by 2032, growing at a CAGR of 2.5% from 2026 to 2032.
Australia Winches Market Growth Rate Analysis (2021-2032)
The Australia winches market witnessed a notable shift from a decline of 0.9% in 2021 to robust growth, reaching 5.7% in 2022. This surge can be attributed to increased demand for winches in construction and mining, driven by infrastructure expansion and a surge in energy projects. Sustained growth continued into 2023 at 4.8%, with investments in renewable energy projects further propelling the market. While growth is projected to moderate to 3.1% in 2024, the upward trend is expected to persist through 2032, averaging around 2.5% annually. This stability is supported by advancements in technology and a steady rise in consumer demand for efficient lifting solutions across various sectors.
Australia Winches Market Year-wise Growth Rate and Key Drivers
This graph highlights how the Australia Winches Market has steadily grown over the past five years, supported by major growth factors.
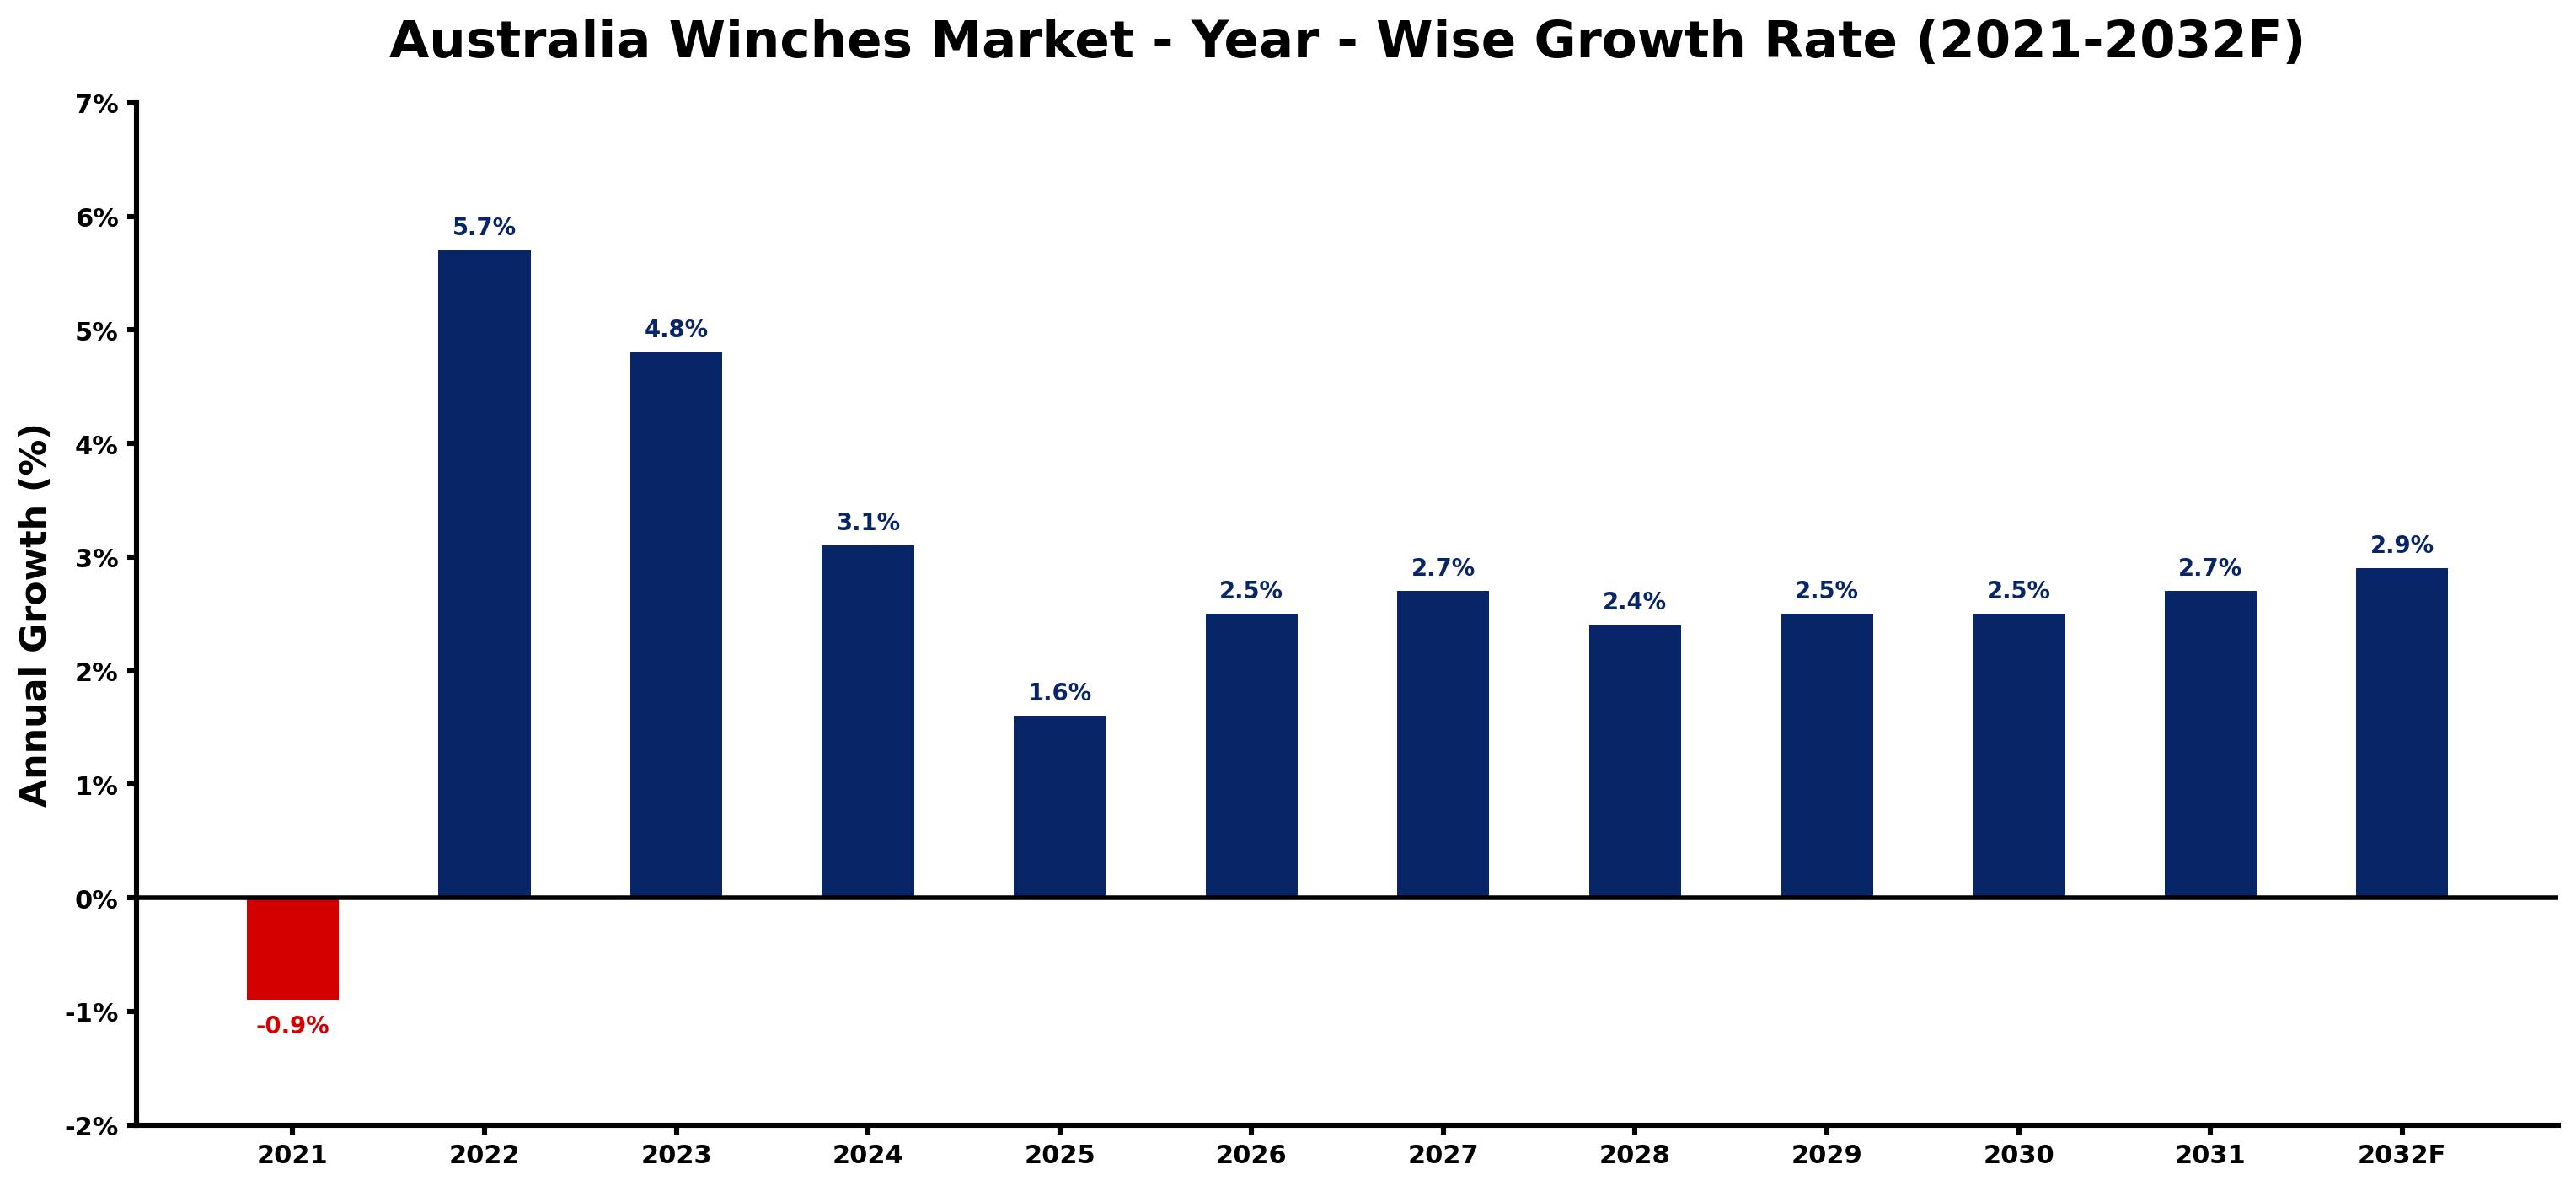
The table below presents the year wise growth rates along with the key drivers influencing the market
| Year | Growth Rate | Major Drivers |
| 2021 | -0.9% | Severe supply chain disruptions hindered winch availability, diminishing sales across construction and marine sectors. |
| 2022 | 5.7% | Emergence of renewable energy initiatives boosts demand for wind and solar winching solutions. |
| 2023 | 4.8% | Infrastructure upgrades across mining sectors create opportunities for enhanced winch applications. |
| 2024 | 3.1% | Technological integration into equipment drives market competitiveness and innovation in designs. |
| 2025 | 1.6% | Increased investments in construction sector enhance demand for durable winch installations. |
| 2026 | 2.5% | Emerging safety regulations necessitate advanced winching technology for compliance in industries. |
| 2027 | 2.7% | Rural electrification projects gain traction, increasing demand for portable winch alternatives. |
| 2028 | 2.4% | Enhanced supply chain logistics promote the need for efficient material handling winches. |
| 2029 | 2.5% | Customization trends in manufacturing lead to specialized winches for diverse applications. |
| 2030 | 2.5% | Focus on sustainability inspires development of eco-friendly winching systems and materials. |
| 2031 | 2.7% | Consumer preferences shift towards automation, resulting in smart winch technology advancements. |
| 2032 | 2.9% | Market consolidation among suppliers enhances distribution networks and lowers production costs. |
Note - Market size estimations and growth projections presented in this report are based on 6Wresearch's advanced forecasting approach, validated with industry datasets as of June 2026.
Australia Winches Market Synopsis
The Australia Winches Market is projected to reach 2.5% and witness significant growth during the forecast period (2026-2032). This growth can be attributed to the increasing demand for lifting, towing, and pulling equipment across various sectors such as marine, construction, forestry, and mining. With a blend of domestic and international manufacturers competing to offer tailored solutions, the market is poised for innovation driven by technological advancements.
Australia Winches Market Growth Drivers
The expansion of critical industries in Australia serves as a primary driver for the winches market. Several key factors are propelling this growth:
- The construction sector is experiencing a surge due to ongoing infrastructure projects, prompting an increased need for reliable winching equipment to support various lifting operations.
- The mining industry, with its demanding operational requirements, is heavily reliant on winches for efficient resource extraction and transportation of heavy materials.
- Marine applications are also a significant contributor, as winches play a crucial role in anchoring and towing, particularly in Australia's extensive coastal and maritime sectors.
- Technological advancements in winch systems, such as the development of remote-controlled and automated capabilities, enhance productivity and safety, further driving market growth.
- Urbanization and related infrastructure developments are pushing demand for winching solutions that facilitate various construction and maintenance activities in urban environments.
Australia Winches Market Challenges and Restraints
Despite the promising growth trajectory, the Australia winches market encounters several challenges that manufacturers must navigate:
- Product reliability is imperative, particularly in high-stakes environments such as mining and construction, where failure can lead to significant operational setbacks.
- Stringent safety regulations require that winches undergo rigorous testing and certification processes, increasing the operational costs for manufacturers.
- The potential for liability issues related to accidents or failures mandates ongoing investments in safety measures and training for users.
- The market's reliance on precise engineering and high-quality materials implies that fluctuations in raw material prices can significantly impact profitability.
- Emerging competition from international players may challenge domestic manufacturers' market share, necessitating continuous innovation and enhancement of product offerings.
Australia Winches Market Government Investment and Initiatives
The Australian government's involvement in local industries significantly impacts the winches market. Several initiatives and regulations are aimed at fostering a safe and competitive environment:
- The government enforces standards set by organizations like Standards Australia, ensuring that winches meet safety and quality assurance requirements.
- Public spending on infrastructure development contributes to the demand for winch systems, further encouraging manufacturers to innovate and enhance their offerings.
- Investment incentives provided by the government encourage research and development of advanced winch technologies, particularly those that improve operational safety.
- Trade agreements and import/export policies regulate the market and ensure the fair distribution of winch products, promoting healthy competition.
- Regular assessments and updates of safety regulations help maintain high standards within the winches market, driving manufacturers toward achieving compliance and excellence.
Australia Winches Market Latest Developments (May 2025 - June 2026)
Recent developments in the Australia winches market reflect the ongoing transformations influenced by technology and market demands. Key trends observed include:
- The introduction of smart winch systems incorporating IoT and automation technologies to improve operational efficiency and monitoring capabilities.
- Increased partnerships between technology providers and traditional winch manufacturers to integrate advanced features into existing product lines.
- Growing emphasis on sustainability, with manufacturers exploring eco-friendly technologies to reduce environmental impacts associated with winch operations.
- Market players are meticulously adapting to evolving safety regulations, with many undertaking initiatives to enhance product reliability and user training.
- Innovations in materials used for fabricating winches are being researched to increase durability and reduce maintenance costs, aligning with industry demands.
Australia Winches Market - Key Attractiveness of the Report
- 10 Years of Market Numbers
- Historical Data Starting from 2022 to 2025
- Base Year: 2025
- Forecast Data until 2032
- Key Performance Indicators Impacting the Market
- Major Upcoming Developments and Projects
Key Highlights of the Report:
- Australia Winches Market Outlook
- Market Size of Australia Winches Market, 2025
- Forecast of Australia Winches Market, 2032
- Historical Data and Forecast of Australia Winches Revenues & Volume for the Period 2022-2032F
- Australia Winches Market Trend Evolution
- Australia Winches Market Drivers and Challenges
- Australia Winches Price Trends
- Australia Winches Porter's Five Forces
- Australia Winches Industry Life Cycle
- Historical Data and Forecast of Australia Winches Market Revenues & Volume By Type for the Period 2022-2032F
- Historical Data and Forecast of Australia Winches Market Revenues & Volume By Electric Winches for the Period 2022-2032F
- Historical Data and Forecast of Australia Winches Market Revenues & Volume By Hydraulic Winches for the Period 2022-2032F
- Historical Data and Forecast of Australia Winches Market Revenues & Volume By Manual Winches for the Period 2022-2032F
- Historical Data and Forecast of Australia Winches Market Revenues & Volume By Applications for the Period 2022-2032F
- Historical Data and Forecast of Australia Winches Market Revenues & Volume By Mining for the Period 2022-2032F
- Historical Data and Forecast of Australia Winches Market Revenues & Volume By Construction for the Period 2022-2032F
- Historical Data and Forecast of Australia Winches Market Revenues & Volume By Utility for the Period 2022-2032F
- Historical Data and Forecast of Australia Winches Market Revenues & Volume By Freight for the Period 2022-2032F
- Historical Data and Forecast of Australia Winches Market Revenues & Volume By Oceaneering for the Period 2022-2032F
- Historical Data and Forecast of Australia Winches Market Revenues & Volume By Others for the Period 2022-2032F
- Australia Winches Import Export Trade Statistics
- Market Opportunity Assessment By Type
- Market Opportunity Assessment By Applications
- Australia Winches Top Companies Market Share
- Australia Winches Competitive Benchmarking By Technical and Operational Parameters
- Australia Winches Company Profiles
- Australia Winches Key Strategic Recommendations
Frequently Asked Questions About the Market Study (FAQs):
The growth is primarily driven by the expansion of key industries such as construction, mining, marine, and forestry that rely on winches for various lifting and towing applications.
Government policies enforce safety regulations and quality standards, fostering a competitive environment while ensuring consumer safety and product reliability.
Manufacturers face challenges such as ensuring product reliability, compliance with stringent safety standards, and the need for continuous innovation amidst rising competition.
Recent developments include the integration of smart technologies, partnerships for product innovation, and a growing focus on sustainability and compliance with safety regulations.
6Wresearch actively monitors the Australia Winches Market and publishes its comprehensive annual report, highlighting emerging trends, growth drivers, revenue analysis, and forecast outlook. Our insights help businesses to make data-backed strategic decisions with ongoing market dynamics. Our analysts track relevent industries related to the Australia Winches Market, allowing our clients with actionable intelligence and reliable forecasts tailored to emerging regional needs.
Yes, we provide customisation as per your requirements. To learn more, feel free to contact us on sales@6wresearch.com
1 Executive Summary |
2 Introduction |
2.1 Key Highlights of the Report |
2.2 Report Description |
2.3 Market Scope & Segmentation |
2.4 Research Methodology |
2.5 Assumptions |
3 Australia Winches Market Overview |
3.1 Australia Country Macro Economic Indicators |
3.2 Australia Winches Market Revenues & Volume, 2022 & 2032F |
3.3 Australia Winches Market - Industry Life Cycle |
3.4 Australia Winches Market - Porter's Five Forces |
3.5 Australia Winches Market Revenues & Volume Share, By Type, 2022 & 2032F |
3.6 Australia Winches Market Revenues & Volume Share, By Applications, 2022 & 2032F |
4 Australia Winches Market Dynamics |
4.1 Impact Analysis |
4.2 Market Drivers |
4.2.1 Growth in infrastructure development projects requiring winches for construction and maintenance activities. |
4.2.2 Increasing demand for winches in the marine and offshore industry for activities such as ship docking and anchoring. |
4.2.3 Adoption of winches in the mining and forestry sectors for material handling and extraction operations. |
4.3 Market Restraints |
4.3.1 High initial investment costs associated with advanced winch technologies. |
4.3.2 Limited availability of skilled workforce for operating and maintaining winches. |
4.3.3 Stringent regulations and compliance standards impacting the market entry and expansion. |
5 Australia Winches Market Trends |
6 Australia Winches Market, By Types |
6.1 Australia Winches Market, By Type |
6.1.1 Overview and Analysis |
6.1.2 Australia Winches Market Revenues & Volume, By Type, 2022-2032F |
6.1.3 Australia Winches Market Revenues & Volume, By Electric Winches, 2022-2032F |
6.1.4 Australia Winches Market Revenues & Volume, By Hydraulic Winches, 2022-2032F |
6.1.5 Australia Winches Market Revenues & Volume, By Manual Winches, 2022-2032F |
6.2 Australia Winches Market, By Applications |
6.2.1 Overview and Analysis |
6.2.2 Australia Winches Market Revenues & Volume, By Mining, 2022-2032F |
6.2.3 Australia Winches Market Revenues & Volume, By Construction, 2022-2032F |
6.2.4 Australia Winches Market Revenues & Volume, By Utility, 2022-2032F |
6.2.5 Australia Winches Market Revenues & Volume, By Freight, 2022-2032F |
6.2.6 Australia Winches Market Revenues & Volume, By Oceaneering, 2022-2032F |
6.2.7 Australia Winches Market Revenues & Volume, By Others, 2022-2032F |
7 Australia Winches Market Import-Export Trade Statistics |
7.1 Australia Winches Market Export to Major Countries |
7.2 Australia Winches Market Imports from Major Countries |
8 Australia Winches Market Key Performance Indicators |
8.1 Average utilization rate of winches in key industries. |
8.2 Number of new product innovations and technological advancements introduced in the market. |
8.3 Percentage of market penetration in untapped sectors such as agriculture or renewable energy. |
9 Australia Winches Market - Opportunity Assessment |
9.1 Australia Winches Market Opportunity Assessment, By Type, 2022 & 2032F |
9.2 Australia Winches Market Opportunity Assessment, By Applications, 2022 & 2032F |
10 Australia Winches Market - Competitive Landscape |
10.1 Australia Winches Market Revenue Share, By Companies, 2025 |
10.2 Australia Winches Market Competitive Benchmarking, By Operating and Technical Parameters |
11 Company Profiles |
12 Recommendations |
13 Disclaimer |
Global Go To Market Strategy - 2030
Export potential enables firms to identify high-growth global markets with greater confidence by combining advanced trade intelligence with a structured quantitative methodology. The framework analyzes emerging demand trends and country-level import patterns while integrating macroeconomic and trade datasets such as GDP and population forecasts, bilateral import–export flows, tariff structures, elasticity differentials between developed and developing economies, geographic distance, and import demand projections. Using weighted trade values from 2020–2024 as the base period to project country-to-country export potential for 2030, these inputs are operationalized through calculated drivers such as gravity model parameters, tariff impact factors, and projected GDP per-capita growth. Through an analysis of hidden potentials, demand hotspots, and market conditions that are most favorable to success, this method enables firms to focus on target countries, maximize returns, and global expansion with data, backed by accuracy.
By factoring in the projected importer demand gap that is currently unmet and could be potential opportunity, it identifies the potential for the Exporter (Country) among 190 countries, against the general trade analysis, which identifies the biggest importer or exporter.
To discover high-growth global markets and optimize your business strategy:
Click Here
Pricing
- Single User License$ 1,995
- Department License$ 2,400
- Site License$ 3,120
- Global License$ 3,795

Leadership Perspectives from Industry Events
Search
Thought Leadership and Analyst Meet


Our Clients
6WResearch In News
- India Air Conditioner Market Set for Strong Rebound in 2026 After Weather-Led Correction and GST-Driven Recovery: 6Wresearch
- ADAS in India: How Automatic Emergency Braking, Blind Spot Detection & Driver Monitoring are Transforming Road Safety
- Doha a strategic location for EV manufacturing hub: IPA Qatar
- Demand for luxury TVs surging in the GCC, says Samsung
- Empowering Growth: The Thriving Journey of Bangladesh’s Cable Industry
- Demand for luxury TVs surging in the GCC, says Samsung
Latest Reports
- Poland Fire Protection Systems Market (2026-2032)
- Cape Verde Portable Hand-Thrown Extinguisher Market (2026-2032)
- Canada Portable Hand-Thrown Extinguisher Market (2026-2032)
- Cameroon Portable Hand-Thrown Extinguisher Market (2026-2032)
- Burundi Portable Hand-Thrown Extinguisher Market (2026-2032)
- Burkina Faso Portable Hand-Thrown Extinguisher Market (2026-2032)
- Bulgaria Portable Hand-Thrown Extinguisher Market (2026-2032)
- Brunei Portable Hand-Thrown Extinguisher Market (2026-2032)
- Botswana Portable Hand-Thrown Extinguisher Market (2026-2032)
- Bosnia and Herzegovina Portable Hand-Thrown Extinguisher Market (2026-2032)
Industry Events and Analyst Meet

HIMTEX 2026

India Refining Summit 2026

India EV Show 2026

EV tech India Expo 2026

Auto Tech Asia 2026
Whitepaper
- Middle East & Africa Commercial Security Market Click here to view more.
- Middle East & Africa Fire Safety Systems & Equipment Market Click here to view more.
- GCC Drone Market Click here to view more.
- Middle East Lighting Fixture Market Click here to view more.
- GCC Physical & Perimeter Security Market Click here to view more.